Introduction
Anatomic force microscope is a scanning probe microscope (Fundamental Theory of Atomic Force Microscopy, n.d.). Scanning probe microscopes (SPMs) are meant to quantify properties such as friction, magnetism, and height using a probe. Early forms of electron microscopes such as the scanning tunneling microscope can only obtain images of conducting or semiconducting surfaces (Atomic Force Microscopy, n.d.). However, the atomic force microscope deciphers this problem and can scan numerous insulating surfaces including those of composites, ceramics, polymers, and glass (Berry et al., 2007). In addition, AFM can operate in a multitude of environments such as aqueous solutions, numerous solvents, air, vacuum, and other gases.
The atomic force microscope was invented in 1985 by Binnig, Quate, and Gerberas a modification to the scanning tunneling microscope (Atomic Force Microscopy, n.d.). The cantilever approach substituted the electron tunneling from a thin wire in the scanning tunneling microscope. The first AFM comprised a diamond splinter connected to a narrow piece of gold foil. The diamond tip had straight contact with the sample surface and the interactions between molecules occurred via the van der Waals forces of attraction (Atomic Force Microscopy Overview, n.d.).
Principles of Atomic Force Microscopy
The fundamental principle of the atomic force microscope is that a probe is upheld in close contact with the surface of the sample by feedback machinery as it scans over the surface in the ‘x,’ ‘y’ and ‘z’ axes (AFM: Beginner’s Guide, n.d.). The ability of the probe to remain at the same probe-sample distance is the topography of the sample. AFMs work by quantifying the force between the probe and the sample. The scanning probe of the microscope scans a small area of the sample in a raster pattern and produces the image simultaneously. The probe consists of a sharp silicon or silicon trioxide tip approximately 3 to 6 µm long.
The shape of the probe is a pyramid whose base has a radius of about 15 to 40 µm. The vertical resolution of an AFM is very high (0.1 nm). However, convolution causes it to have relatively low lateral resolutions. A scanner, more often a piezoelectric element moves the probe over the surface of the sample. The optical lever quantifies the sideways and perpendicular deflections of the cantilever, which amounts to the resolution of the image. The optical lever redirects a laser beam from the cantilever (Fundamental Theory of Atomic Force Microscopy, n.d.).
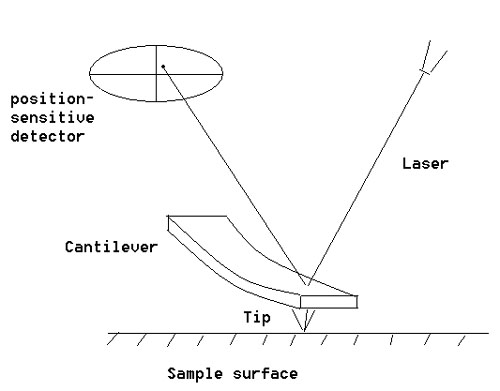
The reflected laser beam hits a photodetector that is sensitive to positions. This photodetector has four segments. The precise movements provided by the piezoelectric element, the extremely sharp tip, and the sensitive optical lever confer high resolutions to atomic force microscopes.
Atomic force microscopy depends on the force between the sample and the tip. Therefore, it is imperative to know these forces for the proper production of images. Hook’s law helps determine the force by using the formula F=-kz, where ‘z’ is the distance bent by the lever, ‘k’ is the rigidity of the lever, and ‘F’ is the force (Magonov and Heaton, n.d.).
AFM Modes of Operation
AFM is an extremely versatile technique and uses several modes such as the contact mode, lateral surface mode, non-contact mode, dynamic force mode or the tapping mode, force modulation, and phase imaging. The regularly used modes of operation are the tapping mode, contact mode, and non-contact mode. The tapping mode and non-contact mode are also referred to as the dynamic modes because the cantilever oscillates during operation.
In the contact mode, the tip is deflected while moving over the corrugations on the surface during raster-scanning of the sample. A constant deflection is achieved by constantly fine-tuning the tip and upholding a steady height above the surface of the sample. The adjustment of the tip is what the microscope presents as data. The feedback circuit sometimes inhibits proper tracking of the surface hence the measurement of the adjustment. Therefore, in such instances, the AFM measures only deflection.
The tapping mode is also the intermittent contact (IC-AFM) or the vibrating mode. The probe tip makes contact with the sample and each oscillating cycle results in the tip shifting away from the sample. The tip taps the sample during each oscillation hence the name ‘tapping mode.’ The tapping mode exhibits more stability in the air than other media hence is commonly employed in numerous applications.
In the non-contact mode, the cantilever is in close contact with the sample throughout and the magnitude of the oscillation amplitude is smaller than in tapping mode (AFM: Beginner’s Guide, n.d.). Some authors refer to the modes by their mechanisms of detection. The tapping mode, therefore, becomes the amplitude modification (AM-AFM), whereas the non-contact mode becomes the frequency modulation (FM-AFM) (AFM: Beginner’s Guide, n.d.).
Phase Imaging
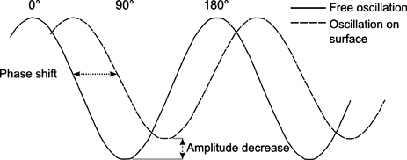
Phase contrast is among the regularly used methods of characterizing sample surfaces according to their composition and mechanical properties. Phase imaging is carrying out an intermittent contact AFM while monitoring the signal and producing a phase-contrast image. It entails the recording of the phase shift. A phase shift is a delay in the undulating motion of the cantilever as it glides up and down the sample.
Phase differences are sensitive to changes in friction, adhesion, viscoelasticity, and composition among many other factors. However, elasticity contributes very little to the phase signal in elastic materials. This phenomenon implies that phase shift is useful in indicating viscoelastic traits, adhesion traits, and replicating topometric disparities. All this is possible because phase is the degree of the dispersion of energy involved in the link between the sample and the tip. The extent of energy dispersion relies on factors such as adhesion, viscoelasticity, and the area of contact (What is Phase Imaging? n.d.). The inclination of the sample determines the contact area. Therefore, a phase image also has topographic contributions. This makes the interpretation of phase images easier and more accurate in flat samples than in slanting ones.
AFM not only collects images of samples but also enables the study of other surface properties. Different modes enable the collection of surface traits. For example, magnetic force microscopy (MFM) quantifies the magnetic dispersal of the magnetic field in the sample; nanoindentation establishes the solidity or softness of a sample, and force spectroscopy quantifies the discrete molecular relations (AFM: Beginner’s Guide, n.d). The contact potential difference across the surface of the sample is determined by the Kelvin probe microscopy, whereas thermal modes enable the quantification of thermal traits of the sample.
AFM Uses in Polymer Science
AFM is a useful microscopic technique in the examination of polymer materials in fields such as “engineering plastics, paints, coatings, rubber, packaging fiber, and a wide range of consumer goods” (Magonov and Heaton, n.d.).
Early AFM studies look at the morphology of polymers, nanostructures, and molecular order. However, the advancement of AFM capabilities sees a significant broadening of the applications of AFM in polymer science. Surface compositional mapping in heterogeneous samples is one of the local material characteristics that AFM helps determine. These advanced techniques enable the study of surface properties as well as the underlying surfaces. Some of the polymers that can be studied by AFM are bulk polymers, block polymers, polymer composites, thin-film polymers, and composite blends (Yu and Magonov, n.d.).
Effect of Tip-Sample Force
Most polymers are soft and necessitate the use of minimal force (as little interaction as possible between the probe tip and the sample) to obtain images without destroying the surfaces. The tapping mode in AFM enables the study of polymer surfaces without damaging them rather than the conventional contact mode. The oscillating tip in AFM precludes destruction by getting rid of the sideway forces that are part of the contact mode. The gentle approach of tapping mode makes it the preferred method for polymer studies. Certain brands of AFMs such as Multimode TM and Dimension TM allow the user to regulate the force exerted on the tip in various applications.
The magnitude of the force on the tip determines the kind of information obtained from the studies. Reducing the tip-sample force on the pliable matter gives height images that closely resemble the topography of the sample. In addition, the best image resolutions are given by the tiny tip-sample contact area that is part of the reduced force imaging. High tip-forced distorts the sample and can produce a height image depicting rigidity of the sample, which is usually different from the expected sample topography. Consequently, practical applications require the use of varying forces during imaging to produce rational images and to ensure that essential details in the sample do not escape notice.
The recording of phase images and height images occurs at the same time. Phase imaging gives significant contrast for morphological traits. On the other hand, phase images in heterogeneous samples indicate disparities in the traits of individual components hence providing helpful compositional mapping in composites and copolymers.
High-Resolution Surface Profiling
AFM enables the production of high-resolution images in morphology and nanostructure studies of polymers. For example, in the Langmuir-B Blodgett film of poly (styrene) poly (methylmethacrylate), (PSB-PMMA) copolymer AFM reveals useful information. The height image of this copolymer shows that the water-loving PMMA blocks develop a 0.6 to 0.8 nm dense layer on the substrate. Individual monoblocks of water-hating PS are put together as string-like combinations or ball-like patterns (Magonov and Heaton, n.d.). The phase images using A0 of 2 nm and Asp of 1.6 nm also reveal that the diameters of the single PS monoblocks are between 8 and 12 nm. Increasing A0 beyond this point produces poor resolution, automatically deforms the surface, and impairs the film.
It is also possible to observe tiny details of nanostructure in commercial PVDF film with a biaxial direction using phase imaging. The images produced have an elevated resolution such that one can see the orthogonal orientation of the nanofibrils as well as the ‘shish-kebab’ nanostructures that form as a consequence of crystallization and stretching.
Experiments on hot rubbed PVDF films using phase imaging produces high-resolution images by differentiating oriented nanofibrils with extremely small diameters. This shows that AFM gives resolutions of a few nanometers. It is also possible to see structural traits such as sub-lamellar arrangement in spherulites using AFM, a task that is impossible with electron microscopes (Magonov and Heaton, n.d.).
Local Mechanical Properties
AFM enables the investigation of local mechanical traits such as rigidity and friction. In addition, many researchers demonstrate the adhesive properties of numerous surfaces using AFM. The formation of force-induced surface corrugations on samples after carrying out contact AFM is usually a consequence of the local rigidity of atoms in materials containing layers. Materials containing layers with varying densities and chain blocks in oriented polymers are also prone to force-induced surface corrugations. Increasing the tip-sample force leads to the distortion of plastics and displacement of polymer materials.
Increasing the force to cause the indentation of the sample and the subsequent imaging of the indent in low-force AFM in tapping mode to comprise ‘nanoindentation’ studies, which enable the characterization of local mechanical properties. Nanoindentation studies on PE with numerous layers reveal that the innermost 2 µm band contains high-density material and is bordered by extensive layers of PE with low densities.
It is also possible to use the AFM tip to stretch a single macromolecule before investigating its mechanical traits. Some of the macromolecules stick onto the AFM tip, which inserts into the sample. Withdrawing the tip stretches the adhered molecules until they break. Force curves document this sequence of occurrences, which enables the establishment of the mechanical traits of various macromolecules.
Compositional Mapping
AFM can differentiate constituents in heterogeneous samples by force modulation imaging in the contact mode (Magonov and Heaton, n.d.). However, it is also possible to use the tapping mode and phase imaging to obtain similar results while getting rid of the harmful effects of lateral forces. The machinery of phase imaging reveals that the energy emitted by the contact between the sample and tip determines the phase differences of the cantilever and the free-oscillating tip. Consequently, heterogeneous samples contain various constituents and are likely to affect energy dispersion.
Examining heterogeneous samples in the tapping mode means that the phase contrast is also affected. According to Magonov and Heaton, the quantities of energy dissipated by various components depend on their mechanical properties with an increase in A0 and a decrease in Asp (n.d.).
The Use of AFM in the Study of Impact-Modified Plastics
The comprehension of structure-property relations in polymers is possible with microscopic examination of sample organization and the dissemination of constituents at the micron and sub-micron levels. Transmission electron microscopy is useful for these studies although it requires laborious sample preparation procedures such as staining and sectioning. However, using AFM can give similar results without going through the backbreaking process of sample preparation. Carrying out the process in the light tapping mode gives the sample topography with slight differences in the contrast of the phase image. Heavy tapping, on the other hand, shows the sample composition.
The Study of Polymer Latex Systems
The scattering of fragments of polymers on a substrate to form close-packed arrays is what develops polymer latex films. The process of thermal annealing causes these arrays to form homogenous films. Such films are regularly used as paints and surface coating in paper and textiles. AFM uncovers the composition, morphology, and film formation features in polymer latex systems.
Differentiation of Heterogeneous Polymer Systems Using Phase Imaging
Simultaneous data acquisition is a key advantage of AFM that enables one to see the various constituents of heterogeneous polymer substances in-phase images. This is particularly useful in studies about mesomorphic polymers, block copolymers, and semi-crystalline polymers.
Examination of Polymer Thermal Transitions
Polymers are categorized into two broad groups according to their thermal properties. These are the thermosetting polymers and thermoplastic polymers (Yu and Magonov, n.d.). Several practical applications require proper comprehension of the thermal properties of materials. Macroscopic methods such as dynamic mechanical analysis (DMA) and differential scanning calorimetry (DSC) look into the temperature transitions of polymers except that they do not provide nanometer-scale and direct polymer visualization at varying temperatures (Yu and Magonov, n.d.). AFM comes in handy in providing “unique microscopic insights on polymer thermal behavior” (Yu and Magonov, n.d.).
The Use of AFM in the Study of Triblock Copolymer
Some polymer samples have a soft, thin layer on their surfaces. The outer layer frequently consists of substances that are different from the underlying polymer. It is possible to study the top surface using a little force, whereas increased tip force enables the examination of the underlying structure. This application is useful in the study of triblock copolymers and mesomorphic polysiloxanes.
Block copolymers (BCP) are polymeric systems that microphase-separate during the process of annealing because of the chemical incongruity of the blocks (Yager et al., 2010). BCPs exhibit nanostructures of varying morphologies, a phenomenon that makes them suitable candidates for nanomanufacturing and high-density patterning. Nonetheless attaining fault-free management of the order of the structures’ orientation poses numerous challenges.
Several tactics are proposed including the “application of electric fields, solvent annealing, topographic and chemical patterning, and tuning the substrate surface energy and/or roughness” (Yager et al. 2010). In the moving thermal zone, recrystallization and arranged growth of grains can take place on the front of the plane that arises from the cooling edge of the zone. Studies by Yager et al. show that improved ordering kinetics and special positioning of the microstructure can be attained by annealing a BCP sheer film by a moving thermal zone where the maximum temperature is lower than the order-disorder transition temperature (2010).
Such a process can be termed as a cold zone annealing (CZA) and does not distort the material during processing. Therefore, the basis of ordering and placement is qualitatively distinctive from traditional thermal zone enhancement methods (hot zone annealing). Computing the structure of a cylinder forming block copolymer all through the thermal region is a useful step in the study of BCP kinetics during a CZA process.
An atomic force microscopy is a useful tool in providing grain size estimates, which when combined with structural information from grazing-incidence small-angle X-ray scattering (GISAXS) measures the structural changes that take place in the various phases of the thermal zone. Yager et al. utilize AFM and GIXAXS to establish the ordering steps that take place in the course of a zone annealing experiment (2010).
Previous studies of block copolymers entail the use of TEM. TEM samples need an ultramicrotome to produce thin slices of stained samples. They reveal that the outer layer of the copolymer-air interface is about 10 nm thick and comprises low surface energy polybutadiene (PB) blocks. The separation of PB and PS blocks shows that the interface consists of curved 20 to 30 nm thick curved nanostructures thick. An AFM of PS-PB-PS film also reveals similar results implying that AFM is a reliable technique for studying copolymer blocks. However, imaging at varying tip-sample force degrees produces finer details of the material.
Light tapping, for example, gives height images showing copolymer film topography with 0 to 3 nm wide corrugations. Phase images in the same mode do not show marked differences in contrast. Reducing Asp causes profound changes in the images such as the appearance of dots (15 to 20 nm in diameter). At hard tapping, the height and phase images show worm-like patterns similar to the TEM micrographs (Magonov and Heaton, n.d.). PS blocks, which are more rigid than PB blocks produce brighter height and phase images.
Berry et al. also use AFM in tapping mode to establish “measurements of rapid ordering and preferential alignment in block copolymer films zone annealed below the order-disorder transition temperature” (2007). In this experiment, AFM solves the key challenge in copolymer self-assembly as a technique in nanofabrication by eliminating the formation of defects. This work has immense similarities to studies by Yager et al. (2010).
In addition, both researchers use atomic force microscopy to quantify the fast ordering of copolymer films in the zone annealing process. Berry et al. use thin films of asymmetric poly (styrene-b-methyl methacrylate) that are approximately 168 nm thick or lattice spacing of 6.5. They use toluene solution to spin-cast a fraction of the polystyrene into silicon wafers. The films are pushed through a temperature gradient at varying velocities.
Tapping mode atomic force microscopy is then used to collect images around the thermocouple region. They then measure the orientation order of the polymer and compute the intensity of the local gradient for all the points in the AFM phase images. The intensity of the local gradient helps determine the cylinder orientation. An average of the local gradient for the whole square domain is established to cater to the regions of small, undefined gradients. Berry et al. define the angle made by this gradient with the horizontal as the cylinder orientation angle (θ) (2007). They realize that the magnitude of the defects reduces substantially as the velocity decreases.
Using an Atomic Force Microscope
Using atomic force microscopes is a simple and uncomplicated procedure. However, it requires that an individual follows some instructions to ensure the production of good-quality images. Different brands of AFMs have their user manuals to give users an easy time working with their machines. The following is the general procedure of working with a NANO-R AFM instrument. Some of the steps can apply to all AFMs and some can differ from model to model.
All AFMs require manual assemblage of components before carrying out any experiment. This involves mounting the cantilever in its holder, attaching the scanner to its base, setting up the optical head to the scanner, and securing the cantilever holder in the optical head (Atomic Force Microscopy in Practice, n.d.).
The first step in the acquisition of a basic image is the launching of the InkCAD software. One then selects the configuration file, which can either be ‘contact’ or ‘close contact.’ Alternatively, one can simply choose the probe in the InkCAD. The next step entails the withdrawal of the tip to hoist the scanner. This enables an appropriate distance between the sample puck and the tip of the probe. A prepared sample is loaded on the sample puck after which a probe is installed on the AFM scanner (How to Use an AFM, n.d.). It is essential to align the detector and establish the resonance frequency for the cantilever in the machine.
The probe is then brought close to the sample after the location of the features whose images are required. One can see the sample features by looking at the video monitor. The x-y stage regulator is important in bringing the image to the current optical field of view. If the surface of the sample is still far from the probe, clicking the Z-Up button further raises the stage. One can then scan the sample, perform image processing and analysis routines, and ultimately withdraw the probe from the surface of the sample.
A probe can encounter damage during usage and require to be changed. The first step in changing the probe is clicking on the ‘Tip Change’ in the stage control page of the AFM. The ‘Start’ option is then selected in the dialog box that appears to lift the stage so that there is enough space to facilitate the exchange of the tip. Selecting the ‘Stop’ option terminates this action after attaining sufficient space. The scanner head is manipulated by rotating it by approximately 900. Tweezers are useful in grabbing the metal part of the probe. To prevent damaging the probe, it is imperative to ensure that the probe is at a safe distance from the sample puck before engaging the services of a motorized stage.
Atomic force microscopes have sensitive parts, and utmost care is necessary to ensure that no part of the instrument is damaged. Wearing latex or polyurethane gloves helps protect the user from electric shock and ensures that sensitive areas of the microscope do not have fingerprints.
Adjusting Tip-Sample Forces in the Production of Height Images
The correspondence between the amplitude of the oscillating cantilever (A0) and the set-point amplitude (Asp) characterizes the extent of tip-sample dealings (Magonov and Heaton, n.d.). Small values of A0 around 2 to 5 nm produce gentle images. The features and degree of tip-sample relations are dependent on “the phase of the freely oscillating tip and the phase of the tip as it interacts with the surface” (Magonov and Heaton, n.d.). Therefore, the tapping mode requires strict monitoring of these changes.
Preparing Samples for Atomic Force Microscopy
Atomic force microscopy can aid in the visualization of various types of samples. Each sample requires prior preparation before the visualization of the desired features. The method of sample preparation depends on the type of sample. For example, biological samples are not prepared in the same approach as polymers. However, all samples need to lie flat on the sample puck before performing any meaningful analysis.
The preparation of AFM samples uses various approaches that take into account the size of the particles, the native environment, hydrophobicity, and biocompatibility (Starostina and West, n.d.). When taking images of particles the particles must be uniformly distributed and adhere firmly to the surface of the substrate. In addition, the size of the particles ought to be smaller than the particle size of the substrate. The topographical traits of the substrate should not exceed the size of the particles to be analyzed.
Most experiments that characterize nanoparticles take place in the air. Glass slides and mica are the main substrates for dry powders. Deposition of Poly-L-lysine on the glass or mica surface improves their adhesive traits. Dusting a tiny amount of powder over the substrate and the subsequent flicking removes particle agglomerates from the surface. Polished metals and wax are the best substrates for particles with granular sizes of 500 nm or greater. Using polished metals and wax entails depositing wax on the metal surface, melting it at 70oC, and allowing the wax to form the solid-liquid interface. The particles are then sprinkled on the wax surface, and the wax is allowed to cool completely. Once the wax is cool, the sample is ready for microscopy analysis.
Biological samples require rigorous sample preparation techniques to ensure the stability of the samples before and during imaging. Preparation of polymers involves adding toluene or an appropriate solvent to the polymer and thorough mixing. Air is then removed from the sample by degassing in a vacuum. Casting the mixture onto silicon wafers enables the production of 150 nm thick slices that can be analysed. All in all, the method of sample preparation depends on the physical and chemical properties of the substance and the specific feature to be analyzed.
References
AFM: Beginner’s Guide, n.d. Web.
Atomic Force Microscopy in Practice, n.d. Web.
Atomic Force Microscopy Overview, n.d. Web.
Berry, B. C; Bosse, A. W.; Douglas, J. F.; Jones, R. L.; Karim, A. Orientational Order in Block Copolymer Films Zone Annealed below the Order−Disorder Transition Temperature. Nano Letters 2007, 7(9), 2789-2794.
Fundamental Theory of Atomic Force Microscopy, n.d. Web.
How to Use an AFM, n.d. Web.
Magonov, S.; Heaton, M. G. Applications of AFM for Polymers, n.d. Web.
Starostina, N.; West, P. Part II: Sample Preparation for AFM Particle Characterization, n.d. Web.
What is Phase Imaging? n.d. Web.
Yager, K. G.; Fredin, N. J; Zhang, X.; Berry, B. C.; Karim, A.; Jones, R. L. Evolution of Block-Copolymer Order through a Moving Thermal Zone. Soft Matter 2010, 6, 92–99.
Yu, J.; Magonov, S. M. Application of Atomic Force Microscopy (AFM) in Polymer Materials, n.d. Web.