Animals
Ovaries for histological analysis,y and for isolation of OSE cells collection were procured obtained from cycling the heifers, butchered infrom the local abattoir. Ovaries were sorted and collected from the pregnant heifers brought to the abattoir at different stages of gestation, (mid pregnancy; i.e.) ( 55-80 d, n = 4ays) and (late pregnancy;) ( i.e. 90-140 d, n = 4). (n=4, n=4), and fFor the control groups, ovaries were collected from butchered non-pregnant cycling heifers (n = 4). A total of 6 ovaries were used for in vitro study. Gestation period in heifers lasts from 278-284 days.
In vivo apoptosis detection
In situ Terminal Transferase-Mediated dUTP Nick End Labelling (TUNEL)
(If possible write two sentences about how sections were made? For eg. Tissues were fixed in 4% paraformaldehyde and embedded in paraffin and section for ca. 5 μm sections by standard procedures.) Apoptotic activity in the epithelial cells of the ovarian surface and inclusion cysts was detected with an in situ apoptosis Detection Kit (FragEL™, DNA Fragmentation Detection Kit, Colorimetric – TdT EEnzyme)). (If possible write two sentences about how sections were made?). Histological sections of ca. 5 μm histological sections were pre-treated with proteinase K (2 mg/ml pProteinase K in 10 mM Tris-HCl buffer, pH?) at 37ºC for 20 min. Endogenous peroxidase activity was inactivatedeliminated by incubating the slidessections withon in 30% H2O2 for 5 min at room temperature. The slides were then covered with an equilibration buffer (composition?) for 30 min before incubation with the TdT enzyme for 90 min at 37ºC is given. The reaction was stopped with the 1X stop buffer for (1X10 min). After washing with TBS, the anti-digoxygenin-peroxidase conjugate was applied to the sections. The reaction was detected with 0.05% diaminobenzidine (Vector) in PBS containing freshly prepared 1% H2O2 for 10 min. For bBackground counterstaining was doneperformed by using haematoxylin for 30 second. Apoptotic nuclei were stained dark brown. Negative controls were the sections incubated in the absence of TdT-enzyme. Apoptotic activity was quantified asby the apoptotic index, which representsed the percentage of apoptotic epithelial cells with apoptotic nuclei in each tissue sample. A total of 10 fields from each tissue section (20 sections for each group) were randomly selectedchosen, and approx. 100 epithelial cells from each field were counted. Data was expressed as a percentage of apoptotic cells within the OSE layer and inclusion cyst’s lining cells.
Immunohistochemistry for cytokeratin
To verify the epithelial origin of the OSE cells and cells in the inner lining of the inclusion cysts and to detect the proliferativeon activity, of the OSE cells and cells lining the inclusion cysts, slides were deparaffinized using xylenes and rehydrated with subsequent series of ethanol dilutions. (how?). Antigen retrieval was performed using sodium citrate by microwaving for 5 min aton high and 5 min aton low temperatures, followed by cooling in solution for 20 min. Slides were washed within PBS. Tissues were blocked for 15 min in freshly prepared 3% H2O2hydrogen peroxide. Slides were incubated in 10% horse serum (serum of the secondary antibody host) in PBS for 20 min at room temperature. After blocking, slides were incubated with cytokeratin antibody for 30 min (1:50 diluted mouse monoclonal cytokeratin; Clone MNF116 DakoCytomation, Denmark A/S) at 25ºC. Following the washing stepages, cells were incubated for 30 min with anti-mouse IgG biotinylated antibody. Slides were then washed in PBS, and antigen-antibody-horseradish peroxidase complex was visualized using diaminobenzidine (DAB) for 5 min. Control slides received serum block instead of the primary antibody.
Immunohistochemistry for P53 localization
Ovaries were procured from non-pregnant cycling heifers from local abattoir and transferred to flasks containinged M199 medium. Ovaries (n = 8) for immunohistochemistry localization of P53, were sections were fixed in Bouins fixative,, paraffin embedded, and cut into 5 µm sections. A minimum of three sections from 8 different ovaries were immunostained for P53. Avidin-biotin peroxidase complex (ABC) method with diaminobenzidine as chromogen was used. P53 antigens were retrieved by microwaving in 0.01 M sodium citrate buffer, pH.? (High- 800W). The monoclonal antibody (mouse anti-P53 primary antibody; (Novocastra) at (1:100 dilution) in PBS) was used. Negative control for eachvery experiment was run by replacing the primary antibody with normal serum. Non-specific binding was minimised by incubating the sectioned slides with normal rabbit serum. Slides were counterstained with Haematoxylin.
Microscopy and data collection
Following immunocytochemistry, slides were examined using a light microscope. Cells were analyzed using a magnification of 10X × 60X. To determine labelling of OSE, 4 different fields were observed around the area of study in section (24 sections). In each field, at least 100 cells were counted and the percentage of the DAB stained cells were calculated. The immunohistochemistry data arewas expressed as proportion of the labelled cells in total OSE cells.
P53 expression at different areas of the OSE
To investigate if P53 is expressedinvolved in the ovulation process, OSE cells were isolated from ovaries (n = 8) of non-pregnant heifers from different locations, 1) over large antral follicles (size range 10-15 mm; n = 15), over mature corpora lutea (17 mm; n = 7) and over stroma in positionsareas away from any ovulatory activityies. Sheets of OSE layer were removed (how, in what?) and centrifuged at 300 rpm.
Reverse transcription-PCR (RT-PCR) for determining p53 gene expression
The TRI REAGENT method was applied to extract total RNA from suspended OSE cells. Following the manufacturer’s instructions, RNA samples were purified by phenol-chloroform extraction and precipitated with absolute ethanol. The amount of RNA was determined spectrophotometrically at 260/280 nm.
The PCR was carried out in 50 µl reaction mixture prepared in ice bath. The reaction mixture contained 25 µl AccessQuick Master Mix, 0.5 µM upstream primer, 0.5 µM downstream primer, 1 µl AMV Reverse Ttranscriptase and 1 µg RNA template. The customized PCR primers used for amplification were synthesized by (Sigma-Genosys) on the basis of the available bovine sequences (Table 7.1).
The PCR conditions were as follows: 45ºC for 45 min as a starting point for first strand cDNA synthesis, followed by 40 cycles at 95ºC for 2 min, 52.8ºC for 1 min, and 72ºC for 1 min, respectively, and then final extension step of 5 min at 72ºC.
After amplification, 10 µl of the PCR products were separated by electrophoresis on 1.5% agarose gels containing 0.002% ethidium bromide, and visualized under a transilluminator and then photographed. The equal loading of the RNA samples was ensured by RT-PCR analysis of a housekeeping gene, GAPDH. Negative controls (reactions without template) were run in parallel to verify the absence of DNA contamination in RNA preparations.
OSE cell culture and steroids treatment
Bovine ovarian surface epithelial cells were isolated from fresh ovaries (n = 6) procured from abattoir. For this cells were gently scrapped off from the ovarian surface using sterile wooden spatula (is this correct?). The cells were incubated in culture media consisting of M199/MCDB 105 medium (1:1), containing 1 mM L-glutamine, 100 UI/ml pPenicillin, 100 µug/ml sStreptomycin and 10% fetal bovine serum (FBS). The presence of OSE flakes in the scrapings was confirmed using aby phase-contrast microscopey. The cells were grown in above culture mediuma poured in 4 culture flasks (n=4) and were incubated in culture media at 37º C under 5% CO2an atmosphere. of 5% CO2. Mediuma has beenwas changed evrery 3-4 days until cultures reached confluence stage (normally after 3 to 4 weeks) (Ffig.ure). Once the cells had grown to confluence, the cells were harvested in trypsin /EDTA (0.05% trypsin and 0.02% EDTA in double distilled water -is this correct?) and counted using a heamatocytometer.
Apoptosis Assay
Apoptosis was quantitatively determined using APOPercentage™ apoptosis assay kit (Biocolor Ltd., Belfast, Northern Ireland). The assay uses a dye that is selectively incorporated into apoptotic but not necrotic cells. The incorporation of dye is considered to be due to the membrane “flip-flop” event when phosphatidyl serine is translocated from the inner membranes to the outer site.
After the OSE cells reach 95% confluencyt, they were detached from the flask by treating them with trypsin solution (0.05% trypsin and/ 0.02% Na2EDTA in double distilled water) for 5 min at 37º C before ,. Ffurther incubation was carried outfollowed the cells after they were counted using hemocytometer.
A total of 5×10⁴ cells/well, were seeded in 96-well tissue culture plate in 200 µul fresh culture medium supplemented with 10% serum. This was incubated for 24 h before any treatment was giventhe addition of the treatment. The cells were incubated at 37º C in humidified incubator under atmosphere of 5% CO2 for 24 hours followed bywith another 24 h incubation with serum free medium underat the same atmosphere. After the 24 hours, the culture medium was removed and replenishedaced with 100µl/well of each treatment in the medium, and this followed anotherby 24 hours incubation.
For steroids treatments, pProgesterone and estrogen were dissolved in absolute ethanol and supplemented toprepared at a final concentration of 10ng/ml (low dose) or 10 μg/ml (high dose) in serum- free culture medium. For positive control, OSE cells were treated with 5 nM freshly prepared H2O2.hydrogen peroxide. Negative control was, the OSE cells incubated with medium and ethanol alone (1%) without the steriods treatment. The OSE cells were then incubated for 24 h at 37º C in a 5% CO2 incubator.
After incubation of the OSE cells in presence ofwith the twovarious concentrations of progesterone and estrogen, or equivalent alcohol, the medium was decanted offremoved 30 min before the completion of the incubation time is reached, Then the cells were incubated with 200 µl of serum-free medium containing 10 μl of APOPercentage dye and theseis wereas incubated at 37 °C in humidified air supplemented with 5% CO2 for another 1 h. After washing twice with PBS, cell surface- bound dye was extracted by lysis solution. The absorbance was and measured at OD of 590 nm wavelength using a microplate reader. All treatments were given inanalyzed with four replicates (Mutaguchi et al. 2003).
Determining P53 expression under steroid influence
To test if P53 expression in the OSE cells is regulated by steroids, cells were transferred onto chamber slides (50,000/well) and incubated in M199/MCDB 105 medium for another 24 h at 37ºC under atmosphere of 5% CO2 in air. This was followed by further 24 h incubation in serum free medium as above.
Cells were treated with progesterone (3 and 3000 ng/ml) and estradiol (3 and 3000 ng/ml) for 24 h. For control, cells were incubated in serum free culture medium for the same period and under same conditions. After incubation, the cells were fixed with ice-cold methanol for 10 min and washed with PBS. The cells were then permeabilized by rinsing with Triton-X 100 solution in PBS, incubated for 30 min with 10% normal goat serum and for 1 h with anti-P53 antibody. After primary antibody treatment, cells were twice washed twice with PBS, and incubated for 30 min with secondary goat anti-mouse antibody. Slides were again washed in PBS prior to 30-min incubation with the preformed Vectastain ABC reagent. After post incubation washings with PBS, the slides were rinsed with few drops of DAB stain, and left to develop for 3-6 min. A positive reaction produces a brown endpoint, which was stopped by rinsing transferring of the slides withto water stream. Sections were counterstained with a nuclear stain, Haematoxylin, for 10-15 s and dehydrated through graded alcohols (70% to absolute alcohol). Sections were cleared by xylene then mounted with DPX. Treatments were replicated for three times.
Results
Cytokeratin expression in OSE layer and inclusion cysts
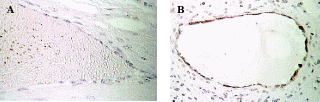
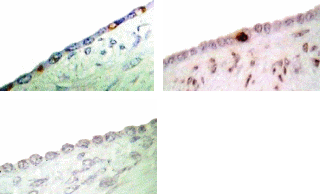
The epithelial cell origin of the cells lining the inclusion cysts was confirmed by their positive anti-cytokeratin immunostaining, characteristic of most types of epithelial cells (Figure). The area of the OSE around the ovary in cycling animals was completely stained with cytokeratin. Additionally, all the inclusion cysts which were distinctly detected under microscope were also expressing the epithelial marker cytokeratin. Most cysts were typically lined with a single layer of epithelial cells, flat to squamous in shape.
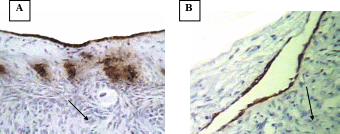
Immunohistolocalization staining of apoptotic cells in bovine OSE and inclusion cysts in pregnant and cycling heifers
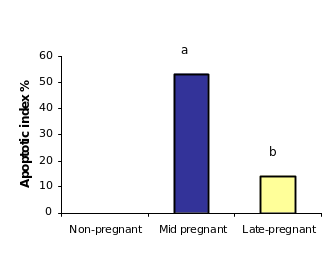
After having confirmed the epithelial nature of the OSE and inclusion cyst layers, the extent of apoptosis was enumerated in these layers at different reproductive stages. Apoptosis pPositive cells byfor TUNEL assays were recognized assessed according to their staining patterns and morphological featureschanges such as chromatin condensation on the periphery of the nucleus, and grossly heavily stained nucleus (Figure). It can be seen that vVery few apoptotic epithelial cells were discernable within etected in the total OSE cells examined in all groups of the animalsstudy, both non-pregnant and pregnant animals. Tissues with relatively high apoptotic index of 8.8% were found in OSE cells duringof mid pregnancy group, whereas, tissues collected from late pregnantcyt group of animals showed significant reductiondecrease in the number of apoptotic OSE cells in proportion torelative to total cells (2%) (P≤0.05). The leastowest apoptotic index was founddetected in within the OSE cells of non-pregnant group (0.75%) (P≤ 0.05) (figure).
When Among the inclusion cysts were considered for such analysis, a similar such a trend of apoptotic index was observed within epithelial cells of different group of animals seemed to be similar as was found in case of to the OSE cells. Data analyses showed that overmore than half (53%) of the inclusion cysts in the ovarian tissues from mid pregnancy animals were completely apoptotic. In fact under microscope (all the lining cells seemed to bewere apoptotic) (53%) (Figure),. Conversely, whereas, the apoptosistic analysis through the ovarian tissues from late pregnant animals indicated that lower the number of apoptotic cells in inclusion cysts reduced to ( 14.2%) (P≤0.05). Interestingly, the microscopic observations showed no apoptotic inclusion cysts within the ovarian tissues of non-pregnant animals (Figure)., Here, all the inclusion cysts that observed were lined with flattened cells with practically no sign of apoptosis.
Cytokeratin expression in OSE layer and inclusion cysts
The epithelial cell origin of the cells lining the inclusion cysts was confirmed by their positive anti-cytokeratin immunostaining, characteristic of most types of epithelial cells (Figure). The area of the OSE around the ovary was completely stained with cytokeratin, additionally all the inclusion cysts which were detected were expressing the epithelial marker cytokeratin. Most cysts were typically lined with a single layer of epithelial cells, flat to squamous in shape.
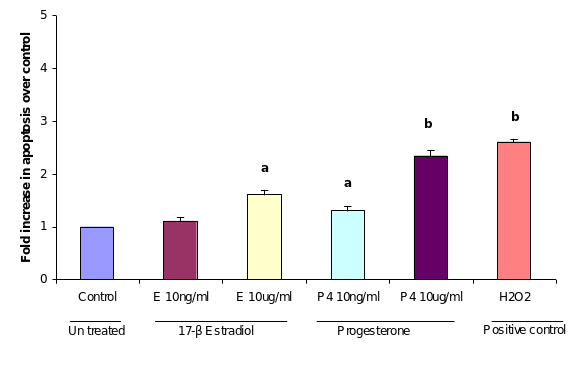
Induction of apoptosis by progesterone in cultured OSE cells
APOPercentage™ assay, a colorimetric apoptosis detection system was used to detect apoptotic cell death in the cultured OSE cellsvitro upon treatment of two concentrations of in the progesterone and estrogen treated OSE cells. After 24 hours of 10 µug/ml progesterone treatment, as shown in (figure), the percentage of apoptotic cells in population of total OSE cells reached 2.3% comparing to the control (2.6). Under the same conditions, proportion of cell apoptosis was approximately 1.3% in OSE cells treated with low dose of progesterone (10 ng/ml). Treatment of OSE cells with low dose of estrogen (10ng/ml) did not induce apoptosis when it was compared with controls OSE cells incubated with equivalent ethanol. On the other handWhereas, treatment with high dose of estrogen (10 µug/ml) induced apoptosis to nearlyapproximately 1.6%, which this was similar to the result of effects of the low dose of progesterone.
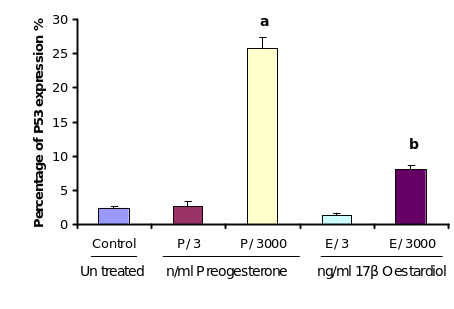
Effect of steroids on P53 expression in cultured OSE cells
As the results of cellular apoptosis revealed a direct influence of progesterone and to some extent estrogen, it was a matter of interest to find out whether this process is mediated with a concomitant expression of P53 in the same cells. In order to study the effect of progesterone and estrogen on P53 expression, cultured OSE cells were treated with different doses of the two steroids. Analysing the immunocytochemistry results it is revealed that low dose (3 ng/ml) of both the steroid treatments did not induce P53 expression. However, high dose of progesterone (3000 ng/ml) increased P53 expression significantly over controls (P≤0.01) incubated with equivalent ethanol. Estrogen treatment at high dose 3000ng/ml also increased the level of P53 expression significantly (P≤0.05) but not as much as the high dose of progesterone did.
Immunohistochemistry for P53 localization
Ovaries were obtained from non-pregnant cycling heifers. Ovaries were collected randomly from the local abattoir and delivered in flask contained media M199. Ovaries (n=8) for immunohistochemistry localization of P53 were fixed in Bouins fixative, paraffin embedded and cut into 5µm sections. A minimum of three sections from 8 different ovaries were immunostained for P53. Avidin-biotin peroxidase complex (ABC) method with diaminobenzidine as the chromogen was used. P53 antigens were retrieved by microwave in 0.01M Citrate buffer (High- 800W). The monoclonal antibody, mouse anti P53 primary antibody (Novocastra) (1:100) in PBS, was used. Negative control for every experiment was done by replacing the primary antibody with normal serum. Non-specific binding was minimised by incubating section slides with normal rabbit serum. Slides were counterstained with Haematoxylin.
Microscopy and data collection
Following immunocytochemistry, slides were examined using a light Microscope. Cells were analyzed using a magnification of X60. To determine labelling of OSE, 4 different fields were observed around the area of study in section (24 sections). In each field a count of 100 cells were noted and the percentage of the DAB stained cells in these 100 cells were calculated. The immunohistochemistry data was expressed as proportion of labelled cells in OSE.
P53 expression at different areas of the OSE
To investigate if P53 involved in the ovulation process, OSE cells were isolated from ovaries (n=8) of non-pregnant heifers from different location, 1) over large antral follicles (range from10-15 -mm) (n=15), over mature corpora lutea (17mm) (n=7) and finally OSE cells over stroma in areas away from any ovulatory activities. Sheet of OSE were removed and centrifuged 300 rpm.
Reverse transcription- PCR (RT-PCR)
The TRI REAGENT method was used to extract total RNA from suspended ovarian surface epithelial cells. According to the manufacturer’s instructions, RNA samples were purified by phenol-chloroform extraction followed by precipitation with ethanol. The amount of RNA was estimated by spectrophotometry at 260/280nm.
The PCR was carried out in 50µl reaction mixture prepared on ice which contained 25ul AccessQuick Master Mix, 0.5 µM upstream primer, 0.5µM downstream primer, 1 µl AMV Reverse transcriptase and 1µg RNA template. The PCR primers used for amplification were synthesized by (Sigma-Genosys) on the basis of the bovine sequences (Table 7.1).
The PCR conditions were 45ºC for 45 minutes as a starting point for first strand cDNA synthesis followed by 40 cycles of 95 ºC for two minutes, 52.8 ºC for 1 minute, and 72 ºC for 1 minute, respectively and then final extension step of 5 minutes at 72 ºC.
After amplification, 10ul of the PCR products were separated by electrophoresis on 1.5% agarose gels containing 0.002% ethidium bromide, visualized by U.V light and photographed. The equal loading of the samples was demonstrated by RT-PCR analysis of the housekeeping gene GAPDH. Negative controls (reactions without template) were performed to verify the absence of DNA contamination. No products were observed in the control reactions.
Isolation and culture of ovarian surface epithelial cells
Epithelial cells were isolated fresh from bovine ovaries (n=4) for culture. Sheets of epithelial cells were removed from the surface of the ovaries using the blunt edge of a blade. Cells from different ovaries were pooled and incubated in a culture flasks (n=4) at 37 ºC in an atmosphere of 5% CO2 and air. Cells were incubated in culture medium; MCDB105/M199 (1:1) supplemented with 15% fetal bovine serum (FBS) and penicillin-streptomycin (100IU/ml-100ug/ml). The media were changed every 3 days until the cells reached confluence. Once the cells had grown to confluence, the cells were harvested with trypsin /EDTA and counted using heamatocytometer.
Effects of steroids on P53 expression
To test if P53 expression in the OSE cells is regulated with steroids, cells were transferred onto chamber slides (50,000/well) and incubated in culture medium for further 24 hours at 37 ºC in an atmosphere of 5% CO2 and air, followed with 24 hours incubation in serum free medium.
Cells were treated with progesterone (3 and 3000ng/ml) and estradiol (3 and 3000ng/ml) for 24 hours, for control, cultured cells were incubated in serum free culture medium for the same period and under the same conditions. After incubation period, the cells were fixed with ice-cold methanol for 10minitues, washed with PBS. The cells were permabilized by washing with Triton 100 X solution in PBS, then incubated for 30 minutes with 10% normal goat serum and for 1 hour with P53 antibody, washed twice with PBS, incubated for 30 minutes with secondary goat anti-mouse antibody. Slides were again washed in PBS prior to 30-minute incubation with the preformed Vectastain ABC reagent. After post incubation washes with PBS the slides were covered by drops of DAB stain and left to develop for 3-6 minutes- a positive reaction produces a brown end point, which was stopped by transfer of the slides to water. Sections were counterstained with the nuclear stain Haematoxylin for 10-15 seconds and dehydrated through graded alcohols (70%- absolute alcohol). Sections were cleared by xylene then mounted with DPX. Treatments were replicated 3 times.
Results
P53 Immunohistolocalization in cycling animals
Since both apoptosis induction and P53 expression were regulated by direct hormone treatments, we approached to detect P53 expression in different regions of OSE layer in cycling animal. Microscopic observations showed that, P53 expression within the OSE was very low in most of the areas around the ovary. Analyzing the labelling index in each area of the OSE layer;, over the large antral follicles, over the CL and over the stroma away from ovulation events showed, that more immunoreactive cells were detected over the CL than in in contrast to the other areas. The labelling index of P53 antigen was 4% over the CL, which was significantly higher than the number of labelled cells, which detected over the large antral follicles (1%) (P≤0.05). No positive stained cells for P53 was detectedobserved in the OSE cells over the stroma though.
pP53 gene expression in different regionareas of the OSE layer in cycling animals
To understand whether differential P53 expression at different OSE regions were due to higher turnover of the pre-formed P53 protein or de novo synthesis, the p53 gene expression was monitored at mRNA level byIn order to examine P53 expression in freshly isolated bovine OSE cells, RT-PCR analysis was performed. Results from studying the gene expression showed indicated that the level of pP53 gene expression of the OSE cells which collected over the CL was higher than the equivalent cells from other areas. The pP53 gene expression ofwithin the OSE cells which collected from over the large follicles was lower than corresponding values level of expression found over the CL. There was nNo apparent pP53 gene expression observed in the OSE cells that collected from over the stroma.
Effects of steroids treatment on P53 expression
In order to study the effect of progesterone and estrogen on P53 expression, cultured OSE cells were treated with different doses of treatments. Analysing the immunocytochemistry results showed that low dose (3ng/ml) of both treatments; progesterone and estrogen did not induce P53 expression. High dose of progesterone 3000ng/ml increased P53 expression significantly comparing to control (P≤0.01). Estrogen treatment at high dose 3000ng/ml also increases the level of P53 expression significantly (P≤0.05) but not as much as the high dose of progesterone.
Results (charts and figures)
Table: PCR primers for P53 and GAPDH genes, annealing temperature (Ta), number of cycles and cDNA size used for gene expression analysis.
Apoptosis in bovine OSE cells and inclusion cyst
Table 1: Overall Apoptotic index in bovine OSE cells and inclusion cysts
A- Apoptosis in OSE layer

B- Apoptosis in inclusion cysts

Results of the second study
P53 Immunohistolocalization

P53 expression at different areas of the OSE
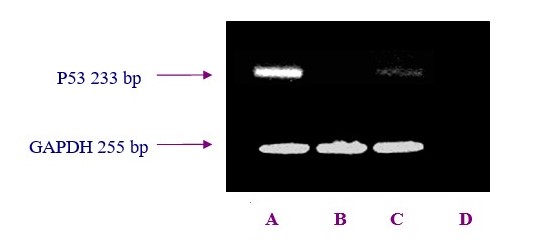
Table: PCR primers for P53 and GAPDH genes, annealing temperature (Ta), number of cycles and cDNA sizes used for gene expression analysis.