Abstract
Singapore’s Information and Communication (ICT) technology sector contributed S$26 billion in value to the economy in recent times which accounted for nearly 20% of the country’s GDP. Various spheres of product/service export include knowledge-based industries of Internet Service Providers (ISP’s), software development, publishing and IT education services.
The objective of this dissertation is to understand and evaluate the functioning of different Singapore-based ICT companies from the perspective of brand management. Like all other products and service sectors, “brands” play a major role in building and sustaining various products exported from Singapore’s ICT sector.
Having established itself as a hub for communication industry and service sector requirements, brands in Singapore are defined by similar attributes as described by marketing management authors. These are: brand personality, brand identity, brand image and brand loyalty. This research attempts to investigate the impact of brand personality and auxiliary concepts such as brand identity and brand image to show how all these concepts affect brand loyalty and consumer brand preference in Singapore’s ICT sector.
Introduction
Overview of Research
This research offers a focused study on brand management principles as applied to Singapore’s booming Information and Communication Technology (ICT) sector. This consists of different brand equity concepts which will contribute knowledge towards various ICT-based products which seek to establish Singapore’s reputation as a global R&D hub for innovative technologies. Some salient examples of Singapore-based companies which have made their mark in marketing high-quality ICT-based brands:
- Autodesk Asia Pte Ltd. – Offers products like AutoCAD architecture, Revit Structure and other applications in Engineering design/draughting (Tradelink Singapore, 2008).
- ABD Computer Service – Supplies innovative accounting software like Quicken, MYOB products, UBS Stock Control, UBS Payroll, UBS Accounting, Assets Register etc (Tradelink Singapore, 2008).
- Databook Pte Ltd. – Supplies business software for small, medium and large entereprises (Tradelink Singapore, 2008)
- Datum Technologies Pte Ltd. – Provides enterprise solutions in the area of corporate email management, data transfer etc (Tradelink Singapore, 2008).
- Ei-nets Ltd. – Offers innovative products like SmarttSurveillance for surveillance and data recovery, SmarttPapers for publishing e-papers, SmarttExhibitions for virtual exhibitions (Tradelink Singapore, 2008).
Other Singapore-based companies with their own ICT brands include Fujitsu Singapore, PC Connect, mTouche, Sarin Technologies, Simplex Consultants, Tally (which is a famous accounting and inventory software brand and will be used in our studies/surveys), UBS Business Solutions and UIC Asian Computer Services Pte. Ltd.
Marketing management authors advocate pursuing of different principles of brand management as part of the four-stage literature review process: brand personality, brand identity, brand preference and finally, measuring their combined results in assessing the customers’ loyalty towards the brand. These attributes of brand management will be discussed extensively in literature review to highlight the power of these brands to achieve a conceptualised framework within which these brands impact the perception of Singapore’s ICT-sector.
A salient feature of our dissertation lies in the importance given to conducting a real (online) survey which revolve around 5 chosen brands e.g. Tally 9 software. This qualitative/quantitative survey is based on a sample of 100 global customers who are familiar with Singapore-based ICT brands. Results from this survey are later interpreted using statistical means (e.g. regression analysis) to understand the relationship between different values in impacting the perception of Singapore’s ICT sector.
Rationale of research
The author is a student of marketing management and has chosen this unique theme because it directly concerns my future career needs in seeking internship with leading advertising and marketing management firms such as Leo Burnett, McKinsey etc. Apart from exciting compensation packages, such companies offer a stimulating environment for professionals like me to develop talents/skills in several attributes of brand management: brands in general, consist of cognitive values which hold a lot of interest to me. Brand equity analysis is the hot topic for various business analysts and this dissertation gives the opportunity to first-hand experience trial themes unique to brand management discussions with a real focus group research.
Singapore’s ICT sector was chosen because of its huge potentiality in present-day global knowledge economy. Since, Singapore aims to establish itself as a global R&D hub for innovative software products, brands automatically establish themselves in this continuous era of internet connectivity, iPhones and wireless communications. Some of these brands have been discussed in this chapter.
Outline of Research
The dissertation has been divided into the following chapters:
- Introduction: This chapter presents a summary analysis of the aims/objectives of research.
- Literature Review: An extensive literature review will thrive on a strong theoretical framework which outlines different facets of brand management e.g. brand personality, brand identity, brand image and brand loyalty. Also, we shall discuss the utility of these brands in Singapore’s ICT sector.
- Data and Methodology: This chapter outline methods/procedures which highlight the values affecting our focus survey on 5 chosen brands and common statistical methods to interpret the results.
- Findings and Discussions: This chapter will detail the results of our survey and their correlation with Literature Review.
- Conclusion and Study Recommendations: This is the final chapter which provides summary analysis and achievements of this dissertation.
References and Appendix (Note: The list is indicative and not exhaustive). For research purposes, a separate bibliography is been provided.
Research aims
The following research aims have been fixed for this dissertation:
- Identifying major brand equity concepts through literature evidence and understanding common tools and methodologies used in those concepts. In all, four brand equity concepts have been identified and elaborated on: brand personality, brand identity, brand image and brand loyalty.
- Developing understanding of the Information and Communication Technology (ICT) sector in Singapore and identifying successful brands for primary research (surveys).
- Application of brand equity concepts along with tools and methodologies in five primary brands shortlisted for the survey. Developing a questionnaire, sample size and survey to connect with brand equity concepts for short-listed brands.
Literature Review
Overview
This chapter shall set study objects into a broader framework through critical investigation of secondary literature sources enumerating different concepts of brand management as applied to Singapore’s ICT industry. It has been argued by authors that brands are so crucial to the survival and success of business firms that we must understand them in all their “subtleties” and “complexities” so that it is possible to manage them correctly (Randall, 2000; Kotler, Fpoertsch and Michi, 2006; Coomber, 2007). In the course of this investigation, four concepts will be touched in detail: brand personality, brand identity, brand image and brand loyalty. All these concepts have synergised relevance for advanced applications which we shall present in the next chapter, chapter 3.
Brands are defined by marketing consultancy agencies such as McKinsey as: 1) Part of a winning value proposition for an acquiring firm; 2) controlling the core assets of the firm to deliver right value to customers; 3) owning the consumer relationship in the most efficient way (Randall, 2000).Experts believe that in today’s world, an individual may come in contact with 30,000 messages on a daily basis out of which around 3,000 will be branded in one way or the other (Mason, 2002). Brands are meant to “complement” marketing functions in the aim of selling a product/service to customers and build/shape customer loyalty for a long period of time (Murphy, 1987).
In an endeavour to fully understand the implications of promoting brand management exercise for marketing functions of organisations which sell innovative products, an attempt should be made to discuss various parameters associated with it: brand psychology, legal issues, business implications and consequently, its impact on R&D products in the ICT sector of Singapore industry. Since, Singapore seeks to establish itself as a premier source for developing innovative software products, the implications of advanced branding methodologies cannot be ignored for this country (Yong & Rao, 1995).
Overview of Singapore’s ICT sector
The establishment of Singapore’s ICT sector in 1987 has opened new vistas of opportunity for the island’s entrepreneur’s to achieve all that it takes to create a sustainable information technology Giant in the Asian business scene (Scalise, 1999). In order to understand the institutional analysis of Singapore’s ICT sector, an attempt should be made to understand theoretical constructs of a full-fledged IT sector for a global service economy.
Any ICT sector requires a steady human resources team comprising of architects, analysts (DB designers), developers, project managers, test engineers, system engineers and system administrators (Association of Thai Software Industry, 2003). These people will constitute the effective “brand managers” to oversee the development of brand value at each and every stage of product development for the ICT organisation (Zhu, Chu & Hill, 2006). Singapore, a developed country, has clearly lost its advantage in the manufacturing sector because it has to compete for wages against similarly-placed neighbouring countries in Asia.
The presence of open-labour markets for too long precluded any need for labour-intensive operations in the country’s ICT sector (Zhu, Chu & Hill, 2006). This is in sharp contrast to India and the Philippines where “outsourcing” is the buzzword for software companies wanting to make their presence felt in a global economic landscape (Zhu, Chu & Hill, 2006). Singapore’s uniquely-positioned status as the service hub for entire Asia has spawned a number of ICT companies with their own premium brand value which goes into the making of Singapore as an attractive brand propositioning entity on global financial markets. A number of Singapore-based ICT companies operate as R&D hubs for innovative software solutions as mentioned in Section 1.1. The stated objective of making Singapore the software capital of the Far East by 2010 is in full swing and as per as value proposition in the ICT sector is concerned, Singapore trails behind only India in Asia-Pacific, in terms of where most dynamic knowledge-based industries are concerned (Electronics Week, 2007).
According to a recent survey by Business Software Alliance (BSA), it was revealed that almost 83% of ICT professionals in Singapore realise the importance of developing a home-grown software industry and with it, development of “key brand associations” with the country (BSA Survey, 2007). The five critical roles identified for the government in terms of intervening in the ICT sector were:
- Increase funding for training and development initiatives (BSA Survey, 2007).
- Promote industry self-regulation instead of government intervention in order to achieve greater brand equity for ICT firms (BSA Survey, 2007).
- Maintaining strong intellectual property (IP) rights protection for domestic and overseas firms willing to invest in R&D efforts in Singapore (BSA Survey, 2007).
- Encouragement of open-source software platforms for development professionals (BSA Survey, 2007).
- To improve national strategy and policymaking in all initiatives of the country’s ICT sector (BSA Survey, 2007).
Above findings define the crucial “operating environment” under which Singapore’s ICT industry will have a chance to flourish under the most testing competition environment brought about by diversified interests in the country’s quest to become a global leader in software R&D solutions. R&D development in the IT industry depend a lot on government encouragement efforts towards different facets of software product design/development. Brands in the IT industry thrive on a clear framework based on value proposition variables such as intellectual property (IP) rights protection – a parameter which will be discussed later in this dissertation for applied consumer surveys (also, this parameter is part of the survey mentioned therein). Let us now shift our attention to the theoretical variables in discussing brand value management for Singapore’s ICT industry.
Brand Personality
Expert marketing consultants believe a “brand” has a personality of its own – just like human beings (Value Based Management, 2007). According to Jennifer Aaker, a brand equity professor at Stanford Business School, each brand has a distinct personality which can be broken down into 5 core variables as depicted in the following picture:
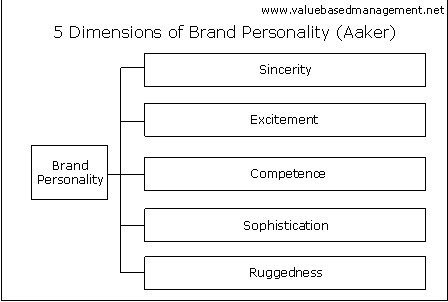
According to the personality framework shown above, Aaker (1997) has identified five core dimensions of a successful brand. These are:
- Sincerity: down-to-earth, honesty, wholesome, cheerfulness (Value Based Management, 2007)
- Excitement: daring, inspiration, imagination, up-to-date (Value Based Management, 2007).
- Competence: reliability, intelligence, success (Value Based Management, 2007).
- Sophistication: upper-class, charming (Value Based Management, 2007).
- Ruggedness: outdoorsy, tough (Value Based Management, 2007)
These terms require an outright clarification. When referring to a brand’s “humane” attribute, each and every brand personality trait achieve some measure of satisfaction which a consumer will receive through direct interaction with any member of the human species (Aaker, 1997). To ensure a brand is perceived as sincere, consumers will need to associate it with imagery of honesty and candid cheerfulness (Aaker, 1997). For excitement in its brand worth (think of the excitement you felt when you met a new interesting person) – the brand should be inspiring, convey lots of imagination and be up-to-date on latest things which “interest’ us (Aaker, 1997). For competence, the brand should have a product/service reputation for good quality and success in all its varied applications. For sophistication, it is well-known that intelligent consumers prefer those brands (not necessarily cheap) which fit in with their style consciousness and self-imagery – this is the reason intelligent advertising efforts create a lasting impact on consumers which remains permanently with them (Aaker, 1997). For ruggedness in especially a product, a brand should deliver the promise it will stay in perfect shape for “rough use” in any critical circumstances (Aaker, 1997).
The Brand personality Dimensions Framework as outlined by Jennifer Aaker, can be used to analyse the “current status” of a given brand: and also, its “future value/worth” (Value Based Management, 2007). The desired future status of a brand will ensure a viable brand value proposition for developing product value in the near and future (Aaker, 1997).
Apart from Aaker, different authors have proposed similar “humanistic” aspects of a brand rendering it personality qualities akin to a human being – brands convey “feelings” similar to what a human being does (Lannon, 1993; Carr, 1996; Keller, 1998). All authors agree on the common precept of projecting brand value in such a way that the imagery will stay in the subconscious of consumer for a very long time to come. Aaker (1996) believes that the brand personality conveys the “entirety of all associations” which is strongly based on benevolence, high spiritedness and other similar attributes (Gelder, 2003). The following set of questions (a part of which will be considered in survey questionnaires for estimation of brand personality) reflect on the human-like attributes associated with a particular brand which must convey proper image of the product/service (Gelder, 2003). Brand personality dimensions as identified by Aaker (1996) can have different interpretations/meanings based on target market consumer preferences. This has been documented in Fig 2.2
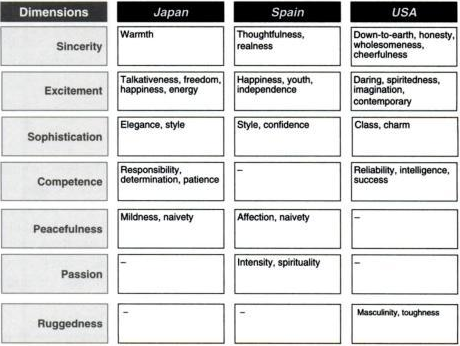
As can be interpreted from above figure, the same product can have different brand personality facets for same Aaker core dimensions. Whereas sincerity in Japan reflects the product’s “warmth” for the customer, Spaniards associate the characteristic with thoughtfulness and genuineness. Americans (and most Anglo-Saxons) in contrast identify the facets as a summation of down-to-earth, honesty, wholeness and cheerfulness which constitutes Aaker’s own association with this feature (since she’s an American!). The job of a qualified brand personality manager is to “identify” and “develop” Aaker’s Brand Personality Attribute diagram for a variety of products/features which convey the impression of the product as a proper framework within which it’s mental associations with “humane” personality attributes are established for consumer preferences (Gelder, 2003).
Most brand personalities are derived from the mission and ambition defined by a given business culture which eventually becomes the mission and ambition strategy for the entire corporate brand (Gelder, 2003). A financial services provider that strives to be a reputed institution for investors and analysts alike will strive to appeal to the “ruggedness” and “competence” aspects of brand personality framework (Gelder, 2003). In sharp contrast, an IT services solution provider (as discussed in our dissertation) will concentrate on the “exciting” and “sophistication” aspect of the product because user-friendliness is the most defining feature of concerned software products in a given setting. Brand personality is always a summation of “core dimensions” and their facets as identified by brand managers for a given target consumer base (shown in Fig.2). Identifying the brand personality needs of a given consumer base requires extensive analysis of tastes/preferences of the given base of consumers. This can be achieved only through extensive marketing and product research (Gelder, 2003). Brands can never create impact without suitable support from agencies/institutions which understand personality issues for given brand. Most brand managers, due to their inadequate preparation in analyzing subtle and intricate aspects of target market fail to evolve suitable brand personality attributes – the end result is usually a failure for the product.
Brand personality creates a real basis on which consumers are able to “relate” with the brand according to the feelings and emotions are produced with their association (Gelder, 2003). Brand personality provides utilitarian benefits which enable marketing teams to reach out to diverse segments of consumer base. In a strict sense, Aaker’s brand personality dimensions chart converges popular consumer perception about human characteristics with product characteristics which appeal to them (Gelder, 2003). Most consumers are well-aware about subtle advertising mechanisms which are meant to attract their attention – brands, by definition are very different from advertising efforts. Brands are a sum total of consumer behaviour attributes which lead to proper interfacing with marketing channels in enabling the product/service to become almost second skin to the consumer (Gelder, 2003).
In this dissertation, we have applied Aaken’s Brand Personality chart to assess the humane attributes of software applications developed by ICT companies identified in the survey.
Brand Identity
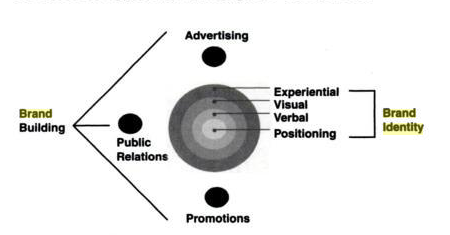
While on surface, the term Brand Identity would seem similar to Brand Personality, there’s more to what meets the eye. Brand identity is all about creating an effective identity of the product (as it relates to the organisation) before a secondary identity is built using PR’s and advertising efforts (Perry & Wisnom, 2002). This brand identity relates to the company’s self-image about its product – it’s more than just product features; brand identity reflects a company’s basic towards its products (Perry & Wisnom, 2002). A strong brand like Coca Cola symbolises a global credibility which attracts attention in any country due to its classic projected image in consumer subconscious – each brand has its own story which explains the huge conflicts experienced by managers when they cannot agree on specific identity attributes for their brand (Perry & Wilson, 2002). Various step-by-step aspects of a successful brand identity are best understood using the following figure 2.3:
Human nature makes consumers associate brand names/images/logos with everything that a company has to offer, an attribute which is used to understand the mental associations people have with successful brands (Perry & Wilson, 2002). This is where the company needs a “self-description” platform which would enable it to reach out to consumers better, and in a more efficient way. Brand identity can be compared to that of a child’s unique identity (Perry & Wilson, 2002). Initially, a child’s identity is defined by the environment surrounding him. Sooner or later, the child develops personality traits, physical traits, a name, basic vocabulary etc. – attributes which enable him to develop his own distinct identity which matures with age (Perry & Wilson, 2002). These defining features become central to the child’s “self-perception” about himself and his environment. Successful brands for consumer products follow somewhat similar line of action.
A successful branded product is made of various controllable elements of a company, product or service which are as these: core essence, positioning, brand name, tag line, logo, messaging and use (Perry & Wilson, 2002). These “controllable elements” can be compared to “facets” in brand personality (Perry & Wilson, 2002). The purpose/objective of developing brand identity is to understand the four core areas where the brands operate – an aspect of branding depicted in the figure below 2.4:
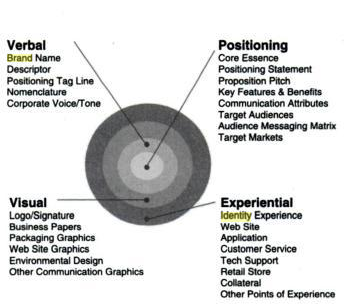
Let us discuss each of above core areas of brand identity in detail:
- Positioning: While at first glance, positioning will appear as a close-knit marketing term – from a brand identity point of view, it indicates some sort of “tactical blueprint” which allows the creative vision of product makers with the intended consumers for which the product has been developed (Perry & Wilson, 2002). It consists of several “defining features” which reflect the general attitude and sense of well-being for the company (Perry & Wilson, 2002). The Brand Identity “positioning statement”, for example, consists of methods and manoeuvres which highlights the general direction in which the branding exercise takes place.
- Verbal identity: Advertisers often swear by the power of a single word caption – the slogan which becomes second definition of target brand (Perry & Wilson, 2002). The Nike identity of “Just Do it” and Apple’s “Think Different” reinforce an image of confidence which gives the product a lifetime value based on how far-reaching the product’s impact could be. Consumers associate verbal gestures as an acceptance of the product into the big league (Perry & Wilson, 2002). Famous products are always known by their famous slogans.
The different facets of verbal identity render a profound impact on average customer subconscious imagery which enable them in creating lifetime associations with the product and in this way, a successful brand is established. For software companies (particularly, internet-based companies which constitute a decisive chapter in our survey discussions), “logical” verbal gestures have little meaning beyond the obvious (Perry & Wilson, 2002). Brands such as Yahoo, Skype, Napster, Kazaa have little verbal associations compared to their sizeable marketshare in all segments of online business. A clever selection of “words” and “phrases” often perpetuate the image of the product in customer psyche and can translate into long-term sales for the company, and a permanent establishment of the brand as major success (Perry & Wilson, 2002).
- isual Identity: Once the positioning and verbal identities have been fixed, a strong visual identity helps generate tangible visual representation of the product to aid “memorability” of the product (Perry & Wilson, 2002). Psychology experts assert that most people find it easier to remember pictorial descriptions than casual tag lines which may or may not register in their minds (Perry & Wilson, 2002). Powerful visual imagery brings the brand to “life” by creating lasting and permanent impression on customers (Perry & Wilson, 2002).
Visual identities consist of several core elements:
- The Signature: Brand name in a specific typeface (e.g. Microsoft brand typeface) (Perry & Wilson, 2002).
- The Logomark: A graphic element which is real or abstract (e.g. Adidas’s symbol used in television advertisements) (Perry & Wilson, 2002).
- The Colour: Colours play a major role in establishment of successful brand Identity in a given product description (Perry & Wilson, 2002).
- The Packaging: Of course, no good product/service looks appealing without attractive packagaing (Perry & Wilson, 2002).
Consider an all-too familiar scenario in which a person walks into a room filled with strangers and needs to socialise (Perry & Wilson, 2002). What will be his/her modus operandi in this regard? Searching for people with common background or similar situations? Looking out for approachable and friendly people as against restrictive, sullen ones? The way a person interacts with another one goes in the building/breaking of a good image. In case of a branded product, a consumer is basically yearning for similar strands of information (Perry & Wilson, 2002). Strong mental associations formed by customers enable product development companies to concentrate on aesthetic and visual pleasures concerning the product (Perry & Wilson, 2002). It I remarkable to note how these visuals balance the overall aesthetic experience for a customer handling the product.
- The Identity Experience
Compared to other core constituents of brand identity, it’s the identity experience which really matters at the end of day – no matter how memorable the product name is, no matter the size and colour; if at the end of the day, the customer has a negative experience with the product it will be permanently etched in his memory (Perry & Wilson, 2002). The branded experience is defined as the summation of taste, feel, fit and performance (Perry & Wilson, 2002).
Another important aspect of brand experience is “customer interface” (Perry & Wilson, 2002). Good customer interfacing can make or break a brand (Perry & Wilson, 2002). Was the salesperson helpful? Was the technical guy knowledgeable? Did the waitress forget your order? As far as the IT industry is concerned, these aspects are transferred to the customer’s web interface. If a company seeks to establish its image as a firm which cares about customer concerns, it will do good to improve its front-line service facility which should consist of polite, highly-trained individuals (Perry & Wilson, 2002). Often times, the customer who carries negative feedback on a particular brand will shift his “brand loyalty” (see last section) from one company to that of another (Perry & Wilson, 2002).
In summation, brand identity reflects the viewpoint of the marketer or brand owner as far as the owner would believe the brand represents to customers, consumers, prospects and other relevant stakeholders (Schulz & Schulz, 2003). Brand identity has a lot to do with “perceived quality” of the product; it is defined as an “impression” of the product’s performance during use by a regular customer (Schulz & Schulz, 2003). Brand Perceived Quality is defined as the sum of overall expectations for the brand from customer point of view – this gives it direct relevance to financial value of the brand and ultimately, stock price and general marketplace performance of the product (Schulz & Schulz, 2003).
This dissertation attempts a systematic breakdown of ICT products in case study, as a summation of core constituents identified by brand identity chart: visual identity, verbal identity, position identity and experience identity. This will give brands in discussion the knowledge which will achieve significant value to answer our research aims on brand identity.
Brand Image
Brand image is defined as summation of perceptions held by customers about the brand: a set of beliefs and values which reinforce the customer’s future commitment towards the brand (Kotler, 1998). In the process of understanding subtle nuances of brand imagery, we shall introduce a pattern of “questionnaires” which reflect the huge diversity in sense of perception people have about a particular brand (Brace, 2004).
Brand image is mostly measured using attributes called “scalars” (Brace, 2004). Each brand is evaluated on a number of dimensional entities, each dimension being different and distinct from the other (Brace, 2004). Each brand is later, evaluated with the purpose of rotating sequence order for different survey respondents to get a general overview of how the brands are perceived by customers in the long run (Brace, 2004). One of the common “scales” used to get brand image data is the “agree-disagree” scale well-known for measuring general attitude towards a particular brand. This questionnaire is one of the qualitative tools to achieve much-required customer perception about a given brand (Brace, 2004).
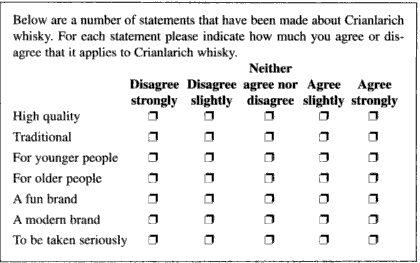
The “scalar” approach to measure brand image provides strong interval data which can be used to achieve various calculations such as mean, standard deviations, correlation and regression and other statistical analysis for the purpose of understanding brand requirements for a particular intended target group (Brace, 2004). There are however, two significant drawbacks to the scalar approach of brand image formation:
- It’s slightly difficult to compare one brand attribute with another. The key here is most survey respondents “just don’t care” about slight differences in brand image like marketers do (Brace, 2004). This may lead to wrong survey results despite large sampling.
- The second disadvantage in the “scalar” approach lies in the unusually long time it may take for the brand survey to be completed (Brace, 2004).
It is with above shortcomings in mind we shall introduce our dissertation technique to measure brand image based on “attributes” and not “scales” – this is defined by the “brand attribute association matrix” which is just a major extension over the agree-disagree matrix described previously (Brace, 2004). It is shown in the following figure 2.6:
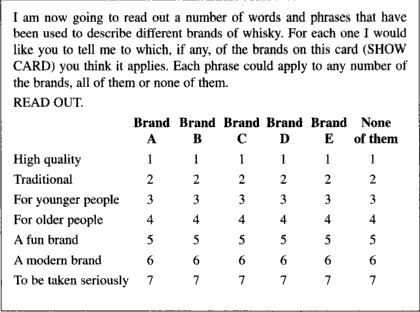
As depicted in above figure, the objective of a brand attribute association matrix is to present a series of brand names which must be associated with some kind of “mental imagery” by the focus group of customers being surveyed (Brace, 2004). Assigning a number rating (between 1-7) is much easier and quicker than deciding on the “degree” and “quality” of brand association as represented by agree-disagree scalar matrix (Brace, 2004). Each brand in question is meant to perform for only one attribute whether or not it applies to given image (Brace, 2004). Fact remains if respondents truly perform the survey without having to think twice, it gives far accurate representation of brand consciousness for marketing agencies.
The coding numbers in brand attribute association matrix are arranged vertically rather than horizontally. This is done for two reasons: first, when respondents see the questionnaire there is no suggestion of an order of priority among the brands (Brace, 2004). A horizontal coding sequence would imply Brand A always get 1 and Brand F always 6 (Brace, 2004). Secondly, the coding sequence enables brand researchers to think in terms of brand image profiles for each brand rather than the brands associated with each image functionality/feature (Brace, 2004). Getting rid of technical difficulties in brand recognition sequences is a vital/important step towards establishing a clear brand image.
This dissertation utilises brand image association matrices for generating data which will be used to gauge/analyse consumer preferences for various ICT products discussed in our survey (5 of them). Theoretical knowledge as above enables us to understand and appreciate various brand image objectives which will impact brand loyalty in the end. Keller (1998) outlines three important dimensions of brand associations: attributes, benefits and attitudes. Attributes could be both specific and abstract. Benefits percolate to all levels of brand consciousness and attitudes reflect customer response to brand surveys as depicted by Fig.5 and Fig 6. Attributes such as size, colour and weight are specific, whereas “brand personality” attributes such as “youthful”, “durable” and “rugged” are abstract in nature. Attributes could also be categorized as product-related and non-product related.
Brand Loyalty
According to Jacoby and Chestnut (1978), brand loyalty is perhaps the most difficult thing to define for any brand consultant interested in tapping into consumer behaviour. Loyalty has different scales and levels e.g. a consumer may be loyal to a particular retailer more than the brand itself. At the end of the day, brand loyalty is about convenience, usability, reach and penetration of the product in consumer psyche. Brand loyalty is based on the basic marketing premise that “all customers are not created equal” which means all customers don’t mean equal value to the company (Hallberg, 1995). Understanding brand loyalty enables the marketing machinery to undertake a more differential approach when dealing with different kinds of customers in a given target zone (Hallberg, 1995).
Brand loyalty’s importance as a business strategy cannot be denied due to its association with future market sales – all major companies try to do their best in reinforcing this marketing characteristic. Keimingham, Munn, Aksoy and Estrin (2005) describe the loyalty process as a summation of observation, scoring, selection, prioritization and leveraging. It primarily involves mutually beneficial interactions between companies and customers through improving customer’s levels of satisfaction and their experiences with the brands in order to allow companies to develop and sustain permanent brand consciousness for given target base of customers Keimingham, Munn, Aksoy and Estrin (2005).
This interest in brand loyalty is also reflected in the academic literature, where Beatty and Kahle (1998) refers to loyalty as commitment and retention towards a single brand. Brand loyalty is also a measure of the health of the organisation.
Brand Loyalty has been established as the ultimate criteria to assess the “firm establishment” of a company brand in the consciousness of the customer (Richard, 1999).
Since, the main motive of ascertaining brand loyalty is regarding the extent to which it can be measured to achieve full profits, customer retention translates into understanding metrics (values) which quantify the extent to which consumers are loyal towards a particular brand. (Gustafsson & Johnson, 2000). The key methodology to build and sustain brand loyalty in a complex business scenario is called the “systems approach” which is basically a round-up of several sources of data which establish the link from quality to final profits (Gustafsson & Johnson, 2000). It basically evolves into a “mixed choice scenario” in which consumers tend to choose those brands which are similar in different product attributes (Roberts and Nedungadi, 1995).
The following procedural steps discuss analysis of brand loyalty information for the purpose of achieving real discussion on this subject:
- Step 1: Identify the Preliminaries – The first question to be asked is what the customer survey should seek to establish in terms of a generic statement, “what the customer wants and how we can give it to him” (Gustafsson & Johnson, 2000). This translates into direct questions about customer satisfaction and loyalty (Gustafsson & Johnson, 2000). Also, the brand manager needs to ensure that the things to be asked/verified are directly under company control (Gustafsson & Johnson, 2000).
- Step 2 – Segment Survey respondents – Market segment classification is based on any information collected prior to the survey (Gustafsson & Johnson, 2000). This is usually done using an indirect approach where descriptive terms include background details of respondents e.g. age, sex, income level, education level, ethnic background, geographic variables etc (Gustafsson & Johnson, 2000) are taken into consideration. The other approach is direct approach where customers are asked specific questions about the use/reliability of a particular product (Gustafsson & Johnson, 2000). Each and every question in such surveys points out to a specific attribute of the brand in question. The customer is made to fill out his best behavioural response to concerned situations in the survey (Gustafsson & Johnson, 2000).
- Step 3 – Consolidating the Survey – Brand Loyalty surveys are meant to achieve simplistic solutions to customer preferences problems which are common with companies and their brand assortments (Gustafsson & Johnson, 2000). In this regard, one must do questioning and self-analysis to achieve perfection in brand management results.
Apart from procedure, it is important to take a look into survey methods which must be applied towards communicating with customers and administering the survey (Gustafsson & Johnson, 2000).
Summary of chapter
In this chapter, the author has given a theoretical understanding of brand performance, brand identity, brand image and brand loyalty combine to achieve a realistic solution for defining brand equity of a product as applied to a given scenario. In next two chapters, we shall implement lessons learned in a real chain-email survey. The theoretical constructs identified in previous chapter give realistic value to our statistical discussion.
Data and Methodology
Questionnaire
In order to evaluate responses as per our theoretical discussions, a survey has been prepared which will answer most curiosities related to questions on brand attributes. The survey itself consists of a chain email questionnaire chosen for a random sample of 100 Singapore university students (originally, the emails were sent across a much larger sample but approximately 134 chose to reply). Survey details are depicted in Appendix I. The following five IT brands (based in Singapore) were chosen for their applicability in our dissertation. Let’s carry a brief discussion of brands selected (also refer Section 1.1). All brands are associated with Singapore’s Information and Communication Technology (ICT) sector:
- Autodesk Asia’s AutoCAD 2009 3D CAD which is an engineering design graphics software used for three-dimensional drawings.
- ABD Computer Service’s UBS Payroll software which is used to keep track of supply chain inventory, a well-known brand in this field.
- Databook Pte Ltd’s ubiquitous Accounting Software Solution MYOB
- Tally Solutions Singapore’s flagship product Tally 9 R 2.13 – a famous business solution brand for financial accounting, inventory management, order processing etc.
- Ei Nets Pte. Ltd.’s – SmarttPapers for e-publishing content on the internet.
Each one of above brands in question has a unique, ubiquitous application which can be used for the purpsose of evaluating their importance in an applications scenario. Even though these brands are not well-known to the general public, university students (especially in technological/management courses) are expected to be familiar with some of the brands in this survey; AutoCAD, MYOB and UBS Payroll, Tally and SmarttPapers are brands which are well-recognised in educational institutions for their global presence.
The survey questions asked in this field of applications were later utilised for confirming various attributes of brand management discussed in our literature review: brand personality, brand identity, brand image and finally, their combined application to ascertain brand loyalty of the products being concerned. For the sake of simplicity, Tally was chosen to represent 5 Singaporean brands in measuring some of the brand attributes discussed in next chapter. Hence, where it is not mentioned – it would be suffice to assume that the data sample represents Tally software instead of other brands. Let us now take a closer look into each and every survey question as depicted in Appendix I.
- Questions 17-20 consist of demographics surveys which are a summation of age, nationality and other such attributes. The purpose of these demographics was to arrive at a realistic brand value estimation based on other variables.
- Question 4 “If brand were important factor in the purchase of IT products, what type of personality would you associate with the brand?” is a direct question related to ascertaining Jennifer Aaker’s Brand Personality framework (see section 2.3). Different dimensions are not explored separately because of Singapore’s Westernisation image which makes it same as Anglo-Saxon countries (refer figure 2).
- Question 5 is related to Brand attribute association matrix as depicted in Fig.4. All brands have been compared to one another (AutoCAD, MYOB, UBS Payroll, Tally and Smarttpapers). Each brand association gives final brand image as required.
- All remaining questions (1-3, 6-16) give brand identity matrix shown in Fig. 4. Also, information is gathered for brand loyalty creation.
Even though double sampling and randomised control would have been the correct procedure in going ahead with this survey, it is remarkable to note that each survey questionnaire as mentioned above gave a full and meaningful perspective in terms of experiment control data. The experiment trials are well within sample size specifications and have enormous consequence in different aspects of final output (discussed in Conclusion chapter).
Methodology and Design
The questionnaire as above was directed using a chain email survey towards a number of respondents who were asked various questions pertaining to the brands outlined in this survey –AutoCAD, UBS Payroll, Tally, MYOB and Smarttpapers. The purpose of this survey was to understand and evaluate the development of brand management attributes such as brand personality, brand identity, brand image and brand loyalty as discussed in literature review.
Choice of method
The only reason a chain email survey was used (instead of a regular survey) because it gives swift and easy responses to the questions outlined in Appendix. The design is both qualitative and quantitative in nature and involves a sample size of 100 (which was broken down from a much larger sample of chain emails). The respondents mostly included university students at Singapore’s different educational institutions. It’s an observed fact most of them have good familiarity with the subject content of the survey (e.g. Tally is a common business application software used by students enrolled in various Bachelor’s and Master’s programmes). Qualitative surveys were mostly related to general-purpose evaluation of data (questions 4 and 5). Quantitative surveys have been further explained using statistical methods.
Structure and design of questionnaire
The questionnaires are framed in a simple multiple-choice, close-ended format with the aim of understanding the correct brand associations for the sample of students selected in the survey. Since, most of the brands chosen in selection are well-known (also Tally, which was used as representation for other brands in cases involving research study), the key aim of research was to achieve the categorisation of various questions on the theoretical divisions of literature related to various facets of brand management: brand personality, brand identity, brand image and brand loyalty.
Data collection and Analysis
Most data was collected from direct analysis of email responses for respondents to the Series of questions asked. Each and every question consists of self-administered responses with due control over quality of respondents’ feedback. It has to be mentioned here the author does not have enough control over the authenticity of responses generated.
When in doubt (or in cases where respondents choose not to answer any specific questions), the data generated was extrapolated using “neutral” response variables such as “neither” or “other”. Clearly, development of information from a stream of unrelated data is an uphill task and requires seamless integration of statistical/analytical concepts.
Sample size and selection
This research has invoked the use of randomised non-controlled sampling techniques which were based on random chain emails sent to respondents who I believed, were true representatives of the questions pertaining to the given sample. Approximately 700 emauil recipients were sent with requests for survey of which only 153 responded. Of this 153, about 100 respondents were short-listed for various forms of data analysis used in this research study. In no clear and ambiguous terms, the research points out to the obvious contradictions in terms of what the respondents actually feel versus their true feelings on this subject (more on limitations).
There are various modes of presenting survey questions: telephonic, one-on-one interviews, online (discussed in this dissertation), focus groups and randomised surveys which consist of random survey questions asked to respondents living in different parts of the world (Gustafsson & Johnson, 2000).
Online surveys, of late, are growing in numbers and importance as the population of web surfers (especially in high-tech cultures like Singapore) is more or less representative of the entire general population (Gustafsson & Johnson, 2000). Online surveys offer realistic advantages in that data can be transferred, collected and analysed right in front of one’s computer (without secondary viewpoint). Web surveys also offer the advantage of privacy, anonymity and deeper involvement for respondents who wouldn’t normally speak their mind in person (Gustafsson & Johnson, 2000). Online surveys, as Kotler (1998) defined are “brutally honest” in their handling of various customer survey data.
Sampling is the most important process for any brand loyalty survey in which respondents are chosen from a select proportion of the population (on the internet, it’s done using chain mail surveys as was performed in this dissertation) and market segmentation scheme is meant to decide the course of the survey. Three important types of sampling techniques are: census sampling, judgment sampling and statistical sampling (Gustafsson & Johnson, 2000). Statistical sampling techniques rely on the concept of probability to ensure steady stream of data in the given survey (Gustafsson & Johnson, 2000). Chain mail surveys as described in this dissertation rely on statistical sampling techniques.
Once, the sampling techniques are properly established, it is important to measure the performance and importance of attributes and benefits from the chosen survey (Gustafsson & Johnson, 2000).This is done by calculating performance measures for the list of data:
Brand satisfaction and loyalty are defined as performance measures for product and service offerings common to abstract constructs involved in the survey (Gustafsson & Johnson, 2000). Customer satisfaction is the first step towards transition of marketing activities into “brand establishment” and consequently, brand loyalty. These benefits cannot be observed or measured directly without using single item surveys and scales (Gustafsson & Johnson, 2000). The best way to measure these random variables is to use multiple proxies which use latent variables to be later extrapolated for weighted averages to indicate brand loyalty ratings which is our final output (Gustafsson & Johnson, 2000).
Limitations in Research
The research methodology as suggested in this chapter is met with the following contradictions and limitations:
- The email respondents may not have expressed their true feelings and thoughts on various brands examined in the survey. This problem is mostly due to “uncontrolled” randomisation which is on the other hand, obviated by the lack of negativity generally associated with software brands.
- In most cases, it can be argued that the respondents may not have “personally tried” the brands used in this research. This is not the case with AutoCAD and Tally which happen to be well-known brands popular with university students, especially in field of engineering, management and finance.
- The sample of respondents cannot be used to achieve a correct fit in the view of generating regression plots or advanced statistical output.
Despite obvious limitations in study, this research aims to provide a representative and factual assessment of various questionnaires pointed out in the survey.
Ethical issues in Research
It has to be mentioned that this research was free and fair and compliant with “guidelines and procedures for students undertaking graduate study”. Every effort has been made to make the responses generated unbiased and non-judgmental. Responses generated conform with standard procedures and guidelines for present study.
Chapter Summary
This chapter provides elaboration on the common methodologies used in analysis chapter. Brand management tools are best analysed using questionnaires picked from non-randomised samples of respondents. It’s consumer feedback which is the main guiding for firms which try to understand subtle dynamics associated with their brand tool.
Findings
Jennifer Aaker’s Brand Personality framework
As Tally has been chosen as the preferred brand for development of Aaker’s brand personality framework (refer fig.1), here are a few important points about Tally which merit our consideration. Since, around 1986, Tally has developed advanced features for usability, scalability and business applications (Tally, 2008). Some of its user-friendly features include exporting of data generated in the software into Microsoft Excel format (a preferred spreadsheet). The product has great speed, power and reliability which makes it indispensable for number-crunching problems. This is the reason Tally has been used for equity (stock) analysis in a variety of business situations.
If brand were important factor in the purchase of IT products, what type of personality would you associate with the brand called Tally?
Out of 100 sample respondents in our survey, a majority answered in the affirmative when it came to common responses for survey questions asked in Section 4. The general trend of the sample survey was to give good ratings on the following attributes as shown in following table
Fig 4.1: Brand personality response to Tally features.
This is what has been measured as far as brand personality attributes are concerned:
- Sincerity: Customers found the brand honest with good value-for-money on average. Overall, the brand has a positive reputation among the sample of respondents chosen (in other cases, this would translate into massive positive imagery for the product in miscellaneous circumstances.
- Excitement: Close on the heels of sincerity, Tally received a high rating on innovation and imagination – facets which were confirmed by good customer surveys on the Internet.
- Competence – On all three parameters/facets, Tally received a high score: reliability, intelligence and success. This gave the product a slight competitive edge in terms of customer reception in the market. Tally is today the market leader in accounting inventory software.
- Sophistication: The product has been held as sophisticated by all counts including methods/ways in which the attributes of glamour and exclusiveness are identified.
- Ruggedness – Considering the huge reliability of the product for different use conditions (and its surprisingly high number-crunching ability), Tally has been given high consideration for toughness and durability.
Summarising above information from the chosen sample, we can form the Aaker Brand Personality framework as shown below:
Fig 4.2: Aaker’s Brand Personality Framework for brand named Tally showcasing the common brand personality attributes which a majority of respondents in the sample size of 100 agreed with.
Brand Attribute Association Matrix for all Selected Brands
As has been mentioned in previous chapter, the following brands have been chosen for their IT development connections with Singapore, and consequently, any brand attribute association for concerned subject scenarios: AutoCAD 2009 3D CAD, MYOB, UBS Payroll, Tally and SmarttPapers.
Which is your preferred brand and name its best characteristics?
The following results were tabulated from above response data:
Fig 4.3: Brand image response to common brands attribute.
Each of these brands has been given a unique coding score in the brand attribute matrix which is subsequently, used to plot the brand attribute association matrix for all selected brands. A perusal of each and every association matrix parameter enables us to choose the values for our study in this field.
Fig 4.4: Brand Attribute Association Matrix for all given brands showcasing the common brand image attributes which a majority of respondents in the sample size of 100 agreed with.
Brand Identity
With respect to survey variables outlined in the questionnaire, the following raw data was observed from questions pertaining to brand identity. Each and every value can be further described in terms of brand identity matrix parameters (visual identity, verbal identity, experimental identity and positioning identity). The core constituents can be further described in terms sub-aspects.
Which of the following statement best describes a “brand”?
Most respondents chose the company’s “values” and “perception” as important attribute. This is far ahead of logo, symbol or other visual aspects. This observation, therefore, falls under experimental identity and verbal identity respectively.
Fig 4.5: Brand description (Brand identity).
Which of these statements best describe the brand performance/attribute you would prefer?
Most respondents chose “functionality” and “value for money”. It should be kept in mind Tally is a business application and not luxury product.
Fig 4.6: Brand performance attributes (Brand identity).
What do you perceive to be the following top three factors that contribute towards a strong brand?
High product quality and high brand recognition were selected for brand identity purposes. This automatically gives the survey categorisation under “positioning” and “experimental identity” respectively.
Fig 4.7: Strong Brand Quality (Brand Identity).
What do you consider to be the top three factors that determine a brand’s image in the minds of consumers?
Most respondents chose “distinctive brand logo” and “distinctive product attribute” as their chosen criteria. Both fall under “visual identity”.
Fig 4.8: Brand image factors (Brand identity).
Which of the following factors would discourage brand loyalty?
Most respondents chose “unfavourable brand reviews”. It should be understood online brand selection wholly depends on customer reviews one will find in internet forums and product description manuals. Also, “substitute product” was another factor found to discourage brand loyalty. Both these attributes fall under experimental and positioning identity.
Fig 4.9: Brand disloyalty factors (Brand identity).
Which of the following criteria have influenced your selection of Tally brand?
Most respondents chose “user-friendliness” and “trusted brand”
Fig 4.10: Brand influence criteria (Brand identity).
After getting sample responses for above data, it is possible to form Brand identity matrix as shown in the given figure 4.11:
Fig 4.11: Brand identity matrix for survey on Tally brand (Refer Appendix I).
Brand loyalty
In this section, we shall implement findings in previous sections to achieve statistical output for brand loyalty as described in literature review (section 2.6).
Step 1: Identifying the preliminaries: It remains to be seen that customer satisfaction was at the top of our quests for achieving meaningful solutions to brand loyalty questions asked in the questionnaire. Questions 10-12 have attributes which qualify preliminaries for this order e.g. methodologies which are categorised as follows: Very Likely, Likely, Neither, Unlikely, Very Unlikely
How satisfied are you with your Tally solutions?
Most respondents were satisfied with the product/brand (with a sizeable portion not being enthusiastic because they may not have used the product directly).
Fig 4.12: Tally use satisfaction rating (Brand Loyalty).
Will you continue to use Tally Solutions?
Most respondents expressed a desire to continue with the product/brand beyond enthusiastic responses.
Fig4.13: Tally use satisfaction rating-II (Brand Loyalty).
Would you consider another brand if Tally Solutions were not immediately available at your convenience?
Fig 4.14: Tally use satisfaction rating- III (Brand Loyalty).
Step 2: Segment Survey respondents: The market segmentation of present survey has been identified for questions 14-16 outlined in this essay. Most responses in the range of “likely” and “very likely” have been ascribed into positive performance metrics. In the same vein, any responses to the contrary have been ascribed in negative performance metrics. It is with this purpose in mind we shall study common uniform features of the brand. The responses have been put together in the following performance metrics.
How likely would you take a risk with a new brand or new substitute for Tally offering an innovative but unfamiliar product?
Most respondents chose to replace the product if a new substitute is available. This indicates not disloyalty towards the brand but the sheer choice of products available online.
Fig 4.15: Brand risk on Tally (Brand Loyalty).
How likely are you to switch between two or more brands of generic products that have the same product attributes, performance and price?
Most respondents gave similar responses as per earlier chart so both have been approximated for similar description.
Fig 4.16: Brand risk on Tally-II (Brand Loyalty).
How likely would you be motivated by advertising and promotional information to switch between brands?
Step 3: Consolidating the survey: The following results have been achieved from the given sample survey.
Fig 4.17: Survey response for Tally –sample 10.
The above results can be statistically combined to achieve degree of brand loyalty for given product (shown in Fig.4.18): Brand loyalty charts as depicted in above figure illustrate the synergies between various aspects of brand loyalty as per our earlier literature review discussions.
Brief discussion of Results
- Software products are valued for a personality framework which consists of numerous attributes such as value-for-money, reliability, easy substitution and user-friendliness.
- Out of the 5 brands chosen, Tally had the highest brand management attribute considered by personality, identity and image. Also, it had more than 50% of respondents showing high brand loyalty value as attributed by Brand Loyalty chart (Fig.25).
- According to Aaker’s Brand Personality framework (Fig.9) –the top attributes applicable to the brand being discussed here are as follows: honesty, value-for-money, innovation and creativity, reliability, intelligence, success, class, glamour, exclusivity, durability and rough use. This corresponds with earlier literature review discussions on how the Brand personality framework can help Brand managers achieve true recognition of their brand’s potential.
- According to Brand Attribute Association Matrix for all brands featured in research study (Fig.11), AutoCAD and Tally were identified as the most recognizable brands from the sample of brands chosen thus. This corresponds with earlier literature review discussions on how the Brand image can help Brand managers achieve true recognition of their brand’s potential. The Brand Attribute Association Matrix was formed from a diversity of survey questions which features important aspects of the brand in survey.
- According to Brand identity Matrix breakdown (Fig.18), the following brand features were found useful and popular with survey respondents chosen for the task of developing brand identity: visual (distinctive product logo, distinctive product attributes), verbal (perception, functionality, high value for money), positional (high brand recognition, trusted brand, user-friendliness) and experimental (Value for money, product functionality, high product quality).
It is suffice to take note that research findings derived from survey responses confirm and validate literature evidence brought forth regarding various components of brand management: brand personality, brand image, brand identity and brand loyalty
Chapter Summary
This chapter provides detailed analysis of survey (questionnaire) results identified in Chapter 3, Methodology. Each and every response to findings help in the creation of various brand equity results discussed in the literature review. Some of the common methodologies/outputs discussed in literature review have been derived from questionnaire data. The concepts of brand personality, brand identity, brand image and brand loyalty have been derived using the step-by-step procedures outlined in literature review.
Conclusion and Recommendations
Conclusion and major highlights
In this dissertation study, the author has embarked on an ambitious exercise to understand branding in the Information and Communication Tehcnology (ICT) industry of Singapore. 5 popular Singapore-based brands were chosen to answer pertinent questions related to various aspects of brand management: brand personality, brand identity, brand image and the application of these concepts towards understanding brand loyalty. This research has been based on secondary literature evidence which offers consensus on the following study findings:
- Jennifer Aaker’s Brand Personality framework which consists of 5 core dimensions and an endless possibilities of sub-dimensions. These 5 core dimensions are sincerity, excitement, competence, sophistication and ruggedness. The framework gives a bird’s-eye view of important brand personality attributes which must be studied in advance before a brand is to be promoted using advertising. In our dissertation survey (comprising a sample size of 100), we have achieved the Aaker’s Brand Personality framework for sample brand Tally, as depicted by Fig.9. Various sub-dimensions of main core dimensions have been as easily identified.
- Brand Attribute Distribution Matrix – which consists of a matrix-like arrangement of various brand qualities (for all brands together) and a rating score based on customer feedback. This chart is a very effective planning tool for organisations which wish to ascertain the strengths and weaknesses of diverse brands under their portfolio. In this dissertation study, the 5 brands chosen were: AutoCAD, Tally, MYOB, UBS Payroll and Smarttpapers. The final Chart, as depicted by Fig.11 established two of the five brands as established in customer mindset.
- Brand identity breakdown – It has been pointed out in secondary literature evidence that any company in the process of marketing its products, should be capable of breaking down brand identities for the purpose of evaluation on what a brand stands for. Brand identity consists of the following sub-identity features: visual, verbal, positional (marketing) and experimental. Each sub-identity feature comprises of facts and ideas which emerge from such a survey. In this dissertation, the author has attempted a Brand identity breakdown of Tally (as a representative of other Singapore-based software brands chosen in the sample) and achieved a brand identity breakdown as depicted by Fig.18.
- Brand Loyalty – Brand Loyalty is a measurable quantity and the following “systems approach” laid down by (Gustafsson & Johnson, 2000) was used to proceed with a systematic procedure which ensures brand loyalty is measured properly. We have utilised survey questions (10-12 and 14-16) to achieve brand loyalty for the product/brand Tally used in this dissertation. The research aims/objectives outlined in section 1.1 met with the following results:
- Identifying major brand equity concepts: The four major brand management concepts identified were: Brand personality, brand identity, brand image, brand loyalty. Each of these concepts were examined in detail in literature review.
- Application of brand equity concepts: In all, 5 major brands operating from Singapore’s ICT sector were identified for subsequent primary research using a questionnaire. Results of the data tabulated are similar to guidelines in literature review. The brands identified were: Tally, AutoCAD, MYOB, UBS Payroll and Smattpapers.
Study Limitations
The following study limitations have been observed from our present dissertation research:
- Not enough data to prepare statistical analysis as mandated by Brand Loyalty requirements (see section 2.6 and Fig.8). It wasn’t possible to achieve regression analysis because of the nature of data that could be acquired through chain emails.
- The research does not cover enough ground on brands unique to Singapore. This is because most brands discussed in this research (including Tally) originate in a country outside Singapore. Tally is a brand which originated from India and currently, “further modifications” of the branded product are being developed in Singapore. All other brands including AutoCAD, MYOB, UBS and Smarttpapers originate outside Singapore – at least the conceptualisation. It has been very difficult to find a brand which is uniquely Singaporean.
Study recommendation in future
Future study recommendations should consist of randomised “controlled” qualitative surveys which are guaranteed to give more authentic responses because the sample size will be highly selected. This would enable the application of more sophisticated statistics e.g. regression analysis and t-square tests. This translates into better knowledge and understanding of various attributes of brand management.
References
Aaker, J., (1997), Dimensions of Brand Personality, Journal of Marketing Research, 34. Reprinted in a book of readings, in Decisions Marketing, April 1999, and Journal of Brand Management.
Association of Thai Software Industry, (2003), Human Resource Requirements in Software Industries.
Brace, I., (2004), Questionnaire Design: How to Plan, Structure and Write Survey Material, Kogan Page Publishers.
BSA Survey, (2007), BSA survey results show 83 percent of IT professionals in Singapore recognize importance of developing the domestic software industry. BSA Online, Web.
Carr, R.A., (1996), A Stochastic Multidimensional Unfolding Approach for Representing Brands, Journal of Consumer Research, University of Chicago Press, Vol. 7 Issue 9
Coomber, S., (2007), Branding, John Wiley & Sons, NY.
Gelder, S.V., (2003), Global Brand Strategy: Unlocking Brand Potential Across Countries, Kogan Page Publishers, NY.
Gustafsson, A. & Johnson, M.D., (2000), Improving Customer Satisfaction, Loyalty and Profit: an Integrated Measurement and Management System, Jossey-Bass.
Electronics Week, (2007), Singapore’s Software Industry. EW Publications. Vol.21, Issue 4.
Jacoby, J. & Chestnut, R.W., (1978), Brand Loyalty: Measurement and Management, John Wiley and Sons Pvt. Ltd.
Hallberg, G., (1995), All Consumers are Not Created Equal: The Differential Marketing Strategy, John Wiley and Sons Pvt. Ltd.
Keiningham, T.L., Perkins-Munn, T., Aksoy, L. & Estrin, D., (2005), Does Customer Satisfaction Lead to Profitability, Journal of Managing Service Quality, Vol.15, Issue 2.
Keller, K.L., (1998), Strategic Brand Management: Building, Measuring and Managing Brand Equity, Prentice Hall, New Jersey.
Kotler, P., (2005), Principles of Marketing, Prentice-Hall, NY.
Kotler, P., Pfoertsch, W. & Michi, I., (2006), B2B Brand Management, Springer Publications, NY.
Lannon, J.M., (1993), Business Communications, Springer Publications, NY.
Mason, T., (2002), Good Causes Deliver for Brands, Marketing, Vol.12 Issue 1.
Murphy, J.M., (1987), Branding: A Key Marketing Tool, Mc-Graw Hill, Rochester, NY.
Perry, A. & Wisnom, D., (2002), Before the Brand: Creating the Unique DNA of an enduring Brand Identity, Mc-Graw Hill Professional.
Randall, G., (2000), Branding: A Practical Guide to Planning Your Strategy, Kogan Page Publishers.
Richard, O., (1999), Whence Customer Loyalty, Journal of Marketing, 63 (3), 33-44.
Roberts, J. & Nedungadi, P., Studying Consideration in the Consumer Decision Process: Progress and Challenges, International Journal of Research in Marketing, Vol.12, Issue 1.
Scalise, C.T., (1990), Intellectual Property Protection Reform, NUS Press (Singapore).
Schulz, D.E. & Schulz, H.F., (2003), IMC: The Next Generation – Five Steps for Delivering Value, Mc-Graw Hill Professional, Hamburg.
Tally Solutuons, (2008), The Advantages of Tally, Web.
Tradelink Singapore, (2008), List of Singapore-based Businesses and Trade Practices as applied to ICT industry, Web.
Value-based Management, (2007), Brand Personality Dimensions of Jennifer Aaker, Web.
Yong, M.C. & Rao, V.B., (1995), Singapore-India Relations: A Primer, National University of Singapore (Centre for Advanced Studies).
Yue, C.S., (2000), Singapore and the IT Revolution. Asia Forum Seminar (2000).
Zhu, Y., Chu, Y.P., & Hill, H., (2006), The East Asian High Tech Drive, Edward Elgar Publishing.
Appendix
Please circle BOLD the number on the right for your corresponding answer. You may choose more than one answer per question unless otherwise instructed. Thank You.
- Which of the following statement best describes a “brand”?
- The identity/name of the product
- The logo/symbol to identify the product2
- The identity & values of the company behind the product 3
- A set if beliefs held by consumers4
- Which of these statements best describe the brand performance/attribute you would prefer?
- The brand guarantees the functionality of the product 1
- The brand symbolizes an image I associate with2
- The brand make me feel good when I use its products 3
- The brand helps improve my social-status4
- The brand offers ‘value-for-money’5
- Is brand important in the purchase of IT products such as business software such as Tally 9.0 which is used for financial/inventory analysis? (Please choose only one answer)
- Yes
- No2
- (If your answer is No please proceed to question 17.)
- If brand were important factor in the purchase of IT products, what type of personality would you associate with the brand?
- Sincerity (honest, wholesome, value-for-money)
- Excitement (daring, innovative, imaginative)2
- Competent (reliable, intelligent, successful)3
- Sophisticated (high class, glamorous, exclusive)4
- Ruggedness (durable, tough)5
- Which is your preferred brandf and name its best characteristics?
- AutoCAD
- UBS Payroll
- MYOB
- Tally
- SmarttPapers
- What do you perceive to be the following top three factors that contribute towards a strong brand? (Please rank among ONLY three answers from 1,2 & 3, with 1 being the most important factor)
- Top of Form
- High product quality
- High Brand recognition/acceptance
- Innovative designs
- Credibility/ warranty
- Nationality/country of origin of the brand
- Which of the following brands would consider as a strong brand?
- AutoCAD
- UBS Payroll
- MYOB
- Tally
- SmarttPapers
- What do you consider to be the top three factors that determine a brand’s image in the minds of consumers? (Please rank among ONLY three answers from 1, 2, & 3, with 1 being the most important factor)
- A memorable brand advertisement
- Distinctive product attribute
- Celebrity endorsements
- Brand history
- Distinctive brand logo
- Which of the following factors would discourage brand loyalty? (You may choose more than one factor).
- Poor product quality and service
- Difficulty in purchase the brand2
- Unfavourable brand reviews3
- Inconsistent brand advertisement/awareness4
- Availability of substitute from competitors5
- How satisfied are you with your Tally solutions? (Please choose only one answer)
- Very Satisfied
- Satisfied 2
- Neither3
- Unsatisfied4
- Very unsatisfied5
- How likely are you to continue using your current Tally Solutions?
- Very likely
- Likely2
- Neither3
- Unlikely4
- Very unlikely5
- Would you consider another brand if Tally Solutions were not immediately available at your convenience?
- Yes
- No2
- (If your answer is No please proceed to question 17.)
- Which of the following criteria have influenced your selection?
- Conveniently available
- Cheap/value-for-money2
- User-friendliness3
- It’s a trusted brand/long history4
- No particular preference5
- How likely would you take a risk with a new brand or new substitute for Tally offering an innovative but unfamiliar product? (Please choose only one answer)
- Very likely
- Likely2
- Neither3
- Unlikely4
- Very unlikely5
- How likely are you to switch between two or more brands of generic products that have the same product attributes, performance and price? (Please choose only one answer)
- Very likely (I constantly try new brands)
- Likely (I am willing to try new brands)2
- Neither (no option)3
- Unlikely (I won’t unless there is good reason)4
- Very unlikely(I always use the same brand)5
- How likely would you be motivated by advertising and promotional information to switch between brands? (Please choose only one answer)
- Very likely
- Likely2
- Neither3
- Unlikely4
- Very unlikely5
- Demographics
- Please select indicate your gender group:
- Male
- Female2
- Please select indicate your age group
- Below 30 years old
- 31 – 45 years old2
- 46 – 55 years old3
- Above 55 years old4
- Please select indicate your occupation type:
- Student
- Administration/clerical/secretarial2
- Executives / Manager3
- Professionals / CEO4
- Others_________________________________________________
Bottom of Form.