Introduction
The academic performance of students is central in an education system because it indicates the outcome of teaching and learning processes in schools and colleges. Yearly, teachers and parents strive to equip students with the necessary knowledge and skills so that they can perform well in their exams. Despite the efforts of parents and teachers, disproportionate performance occurs among students. The academic performance of students varies from one school to another, depending on the availability of learning resources, the nature of teaching methods, and social factors that are present in the learning environment.
Moreover, disproportionate academic performance occurs within a school due to the existence of demographic factors, which influence how students perform in schools. For example, male students are good in certain subjects, while female students are good in certain subjects. Academic performance among students also varies according to their racial backgrounds. The gendered and racial academic performances show that learning among students follows different patterns and processes, which require theories and models to elucidate.
Education experts have cited many factors that influence learning among students and thus they have come up with learning theories, which are applicable in teaching. In essence, myriad factors mediate academic performance and learning among students in various schools. Therefore, the research paper compares the academic performance of students in terms of mathematics scores, science scores, and scholastic assessment test (SAT) scores, and establishes their relationships with gender and race.
Problem Statement
Poor academic performance is an issue that an education system, teachers, parents, and students struggle to eliminate in learning institutions. The education systems across the world spend billions of dollars in developing appropriate curricula and implementing them effectively to achieve desired goals. In the same manner, teachers are putting extra effort into their teaching programs so that students could perform well in their exams and pursue careers of interest. As parents bear the burden of parenting and schooling, they closely monitor the academic progress of their children with a view of guiding them on how to build their careers.
Likewise, students attend their classes daily and spend ample time reading to gain appropriate knowledge and skills, which would enable them to identify their talents and build their careers, and thus become successful people in society. Evidently, academic performance is a parameter, which measures outcomes of teaching and learning in schools.
In American schools and colleges, academic performance has been a significant issue in the recent past due to poor performance among students. Among 12th graders, mathematics, and sciences are the subjects in which students perform disproportionately. Moreover, SAT exams, which are essential in assessing the reading, writing, and numerical capacities of students, have caused the disproportionate entry of students into colleges.
The disproportionate academic performance in mathematics, science and SAT exams among 12th graders begs many questions. Comparative analysis of the relationships that exist among mathematics scores, science scores, and SAT scores provides insights into the factors that influence academic performance among students. Therefore, there is an urgent need to establish the relationships that exist among mathematics scores, science scores, and SAT scores in relation to gender and race.
Objective of Research
- To find out if science scores and SAT scores vary significantly between male and female students.
- To establish if mathematics scores, science scores, and SAT scores vary significantly among White American, African American, Hispanic, and Latino students.
- To find the nature of correlation that exists between mathematics scores and SAT scores.
Hypotheses
The Null Hypotheses
- H0: The performance of male and female students does not differ significantly in mathematics, science, and SAT exams.
- H0: The White American, African American, Hispanic, and Latino students do not exhibit significant differences in mathematics scores, science scores, and SAT scores.
- H0: Positive correlation does not exist between mathematics scores and SAT scores.
The Alternative Hypotheses
- H1: The performance of male and female students differs significantly in mathematics, science, and SAT exams.
- H1: The White American, African American, Hispanic, and Latino students exhibit significant differences in mathematics scores, science scores, and SAT scores.
- H1: Positive correlation exists between mathematics scores and SAT scores.
Variables of the Study
As the study examines the academic performance of students, its variables are gender, race, mathematics scores, science scores, and SAT scores. Gender and race are independent variables of the study, while mathematics scores, science scores, and SAT scores are dependent variables. Gender is a demographic variable in the study, which is important in testing the existence of gendered performance. The race is a pertinent independent variable that helps in establishing the existence of disproportionate performance of students owing to their races. In this view, the study examines White American, African American, Hispanic, and Latino students with the objective of finding out if their academic performances differ significantly. Thus, gender and race are two independent variables that represent demographic variables, which influence academic performance among students in schools and colleges.
Mathematics scores, which form a dependent variable, are the scores of the 12th graders. The study collected mathematics scores from students, who completed their 12th-grade exams. Moreover, the study collected data on science scores from students, who completed their 12th-grade exams. Science scores form an integral dependent variable that indicates the performance of students in the 12th grade. Given that SAT scores relate to the 12th-grade exams, they are applicable in establishing the correlation relationships. Correlation analysis of mathematics and SAT scores is necessary for the study. The correlation value would indicate if mathematics scores determine SAT scores, and thus form the basis of using SAT in various colleges as an aptitude test for placement of students.
Factitious Data
The table below summarizes data collected from 40 students (N =40) with equal representation of gender (Male = 20, Female = 20). The study also balanced the participants in terms of their racial backgrounds because the White Americans, African Americans, Hispanics, and Latinos were represented by eight students (n = 8).
Table 1.
Data Analysis
Descriptive Statistics
The table below shows the descriptive statistics of mathematics scores, science scores, and SAT scores of the 12th graders. The descriptive statistics provide measures of central tendency and measures of dispersion and thus summarize the data for further analysis.
Table 2.
The measures of central tendency that the descriptive table depicts are mean, mode, and median. For mathematics scores, the mean, mode, and median are 71.73, 75, and 74 respectively. The measures of central tendency of science scores are 74.64, 56, and 75 for mean, mode, and median respectively. Likewise, the mean, mode, and median for SAT scores are 627.03, 520, and 653 respectively. From the descriptive statistics, it is evident that measures of central tendency for mathematics scores and science scores are closer to the central measures than SAT scores. Hence, measures of central tendency are important because they depict the distribution of data, which form the basis of making inferential statistics.
Measures of dispersion are important descriptive statistics as they provide the extent to which a given data disperse from a certain central measure (Kirk, 2006). In the descriptive table, the measures of dispersion are range, variance, and standard deviation. For mathematics scores the range, variance, and standard deviation are 44, 194.41, and13.943 are respectively. Similarly, the range, variance, and standard deviation for science scores are 44, 176.07, and 13.27 respectively. The measures of dispersion for SAT scores are 400, 9742.86, and 98.71 for the range, variance, and standard deviation correspondingly. These descriptive statistics indicate that mathematics scores and science scores have similar dispersion, while SAT scores exhibit the highest degree of dispersion.
Analysis of descriptive statistics requires examination of measures of central tendency and measures of dispersion for they are inseparable in making inferences. Kirk (2006) states that the combination of a measure of central tendencies such as standard deviation and a measure of dispersion like mean provides a clear view of how descriptive statistics summarize data. For mathematics, the scores have a small variation from the mean (M = 71.3, SD = 13.943).
Likewise, sciences have small variation from the mean (M = 74.64, SD = 13.27). However, the variation in the SAT scores is huge as indicated by the standard deviation (M = 627.03, SD = 98.71). In this view, descriptive statistics are essential as they summarize data, and therefore, they provide the basis for making inferential statistics and performing further statistical analyses.
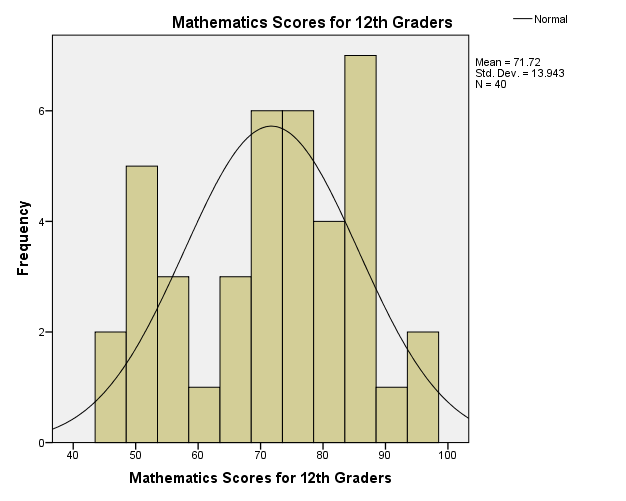
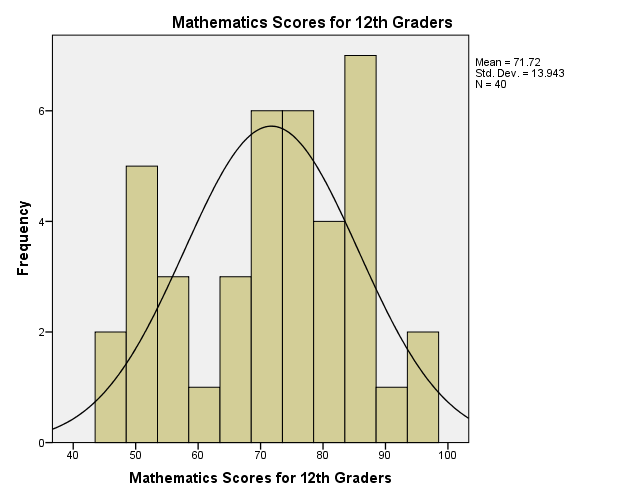
The histogram in figure 1 shows the distribution of mathematics scores among the 12th graders. The distribution is close to the normal distribution because most scores are close to the mean, mode, and median. Skewness and kurtosis are two statistical tests that researchers apply to determine the distribution of data. According to Ott and Longnecker (2008), skewness depicts symmetry of the distribution curve, while kurtosis shows the peakedness of the distribution curve.
The distribution curve of the mathematics scores has a negative skew of 0.301, which means the scores have a slight skew of distribution towards the right when compared to the normal distribution. Regarding kurtosis, the mathematics scores have a negative kurtosis of 1.013, which implies that they have a flatter peak than the normal distribution. Thus, the skewness and kurtosis of the mathematics scores do not deviate significantly from the normal distribution. In this view, the data meets the assumption of the normal distribution, which various statistical tests require.

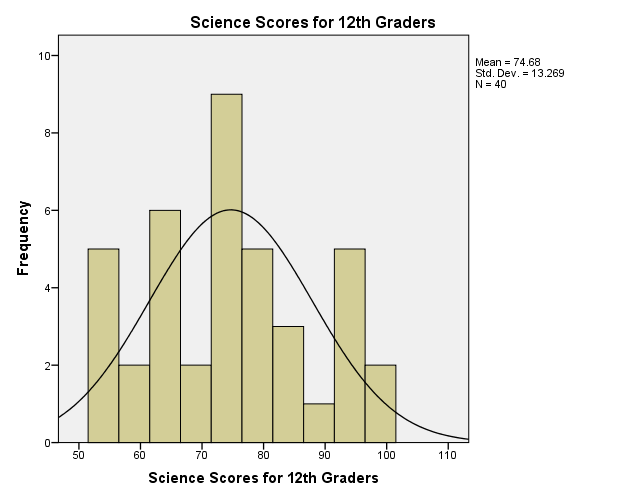
Figure 2 is a histogram, which exhibits the distribution of science scores among the 12th-grade students. Ott and Longnecker (2008) state the values of skewness and kurtosis are zero in a normal distribution curve. The skewness of the distribution is positive 0.149, which means that its distribution skews towards the left. Since the skewness value of the distribution is close to zero, it follows that of the normal distribution curve. Moreover, the distribution curve has a negative kurtosis of 1.004. The negative kurtosis implies that the peakedness of science scores is below that of the normal distribution. Given that the skewness and kurtosis values are within the close range of the normal distribution curve, the science scores follow the normal distribution and thus meet the assumptions of the tests like correlation, analysis of variance, t-test, and chi-square test amongst others.
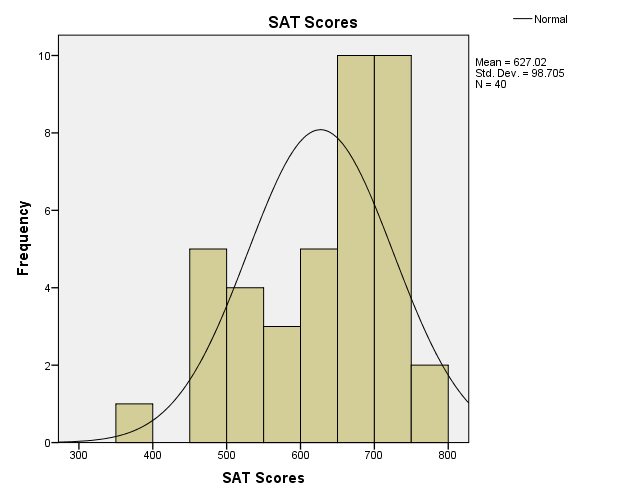
Figure 3 shows the distribution table of SAT scores of students. Examination of skewness and kurtosis of the distribution indicates how the distribution curve varies from the normal distribution curve. Apparently, the distribution curve has a negative skew because it skews towards the right side. Ott and Longnecker (2008) state that the distribution curve that skews towards the right side is negative, while the one that skews towards the left is positive. From the descriptive table, the skewness is negative 0.721. The skewness value is very high as it depicts that over half of students have scored the highest scores. Concerning the kurtosis, the distribution table has a positive value of 0.733. This value of kurtosis indicates that the peakedness of the distribution curve is greater than that of a normal curve.
Hypothesis Testing: Statistical Tests
The First Hypothesis
H0: The performance of male and female students does not differ significantly in mathematics, science, and SAT exams.
The data for testing this hypothesis fit that of one-way ANOVA. The data for the analysis of one-way ANOVA meet the following assumptions.
- The dependent variables, which are mathematics scores, science scores, and SAT scores, are in a continuous form.
- The independent variable, which is gender, comprises two categories, male and female students.
- The scores of mathematics, science and SAT are quite independent of each other and gender.
- The scores of mathematics, science and SAT have no significant outliers.
- The distribution of scores for mathematics, science, and SAT is close to normal distribution.
Gender and Mathematics Performance
Table 3.
From the ANOVA table, it is evident that the performance of male and female students in mathematics does not differ significantly at the significance level of p<0.05, [F (1, 38) = 0.192, p = 0.664]. In this view, the test fails to reject the null hypothesis, which holds that gender does not influence the performance of students in mathematics.
Gender and Science Performance
Table 4.
The ANOVA table shows that the science scores do not differ significantly between male and female students at a significance level of p<0.05 [F (1, 38) = 0.308, p = 0.582]. This test fails to reject the null hypothesis, and thus the null hypothesis still holds that gender does not influence the performance of students in science.
Gender and SAT Performance
Table 5.
The ANOVA table shows that gender does not have a significant influence on SAT scores among students at the significance level of p<0.05 [F (1, 38) = 0.382, p = 0.540]. Since the p-value is insignificant, it implies that the null hypothesis, which states that the performance of students in terms of SAT scores does not differ significantly between male and female students, still holds.
Combined Analysis
Table 6.
Decision
Based on the ANOVA table, the test fails to reject the null hypothesis because the p-value is greater than the significance level of 0.05. Jackson (2011) states that the p-value must be less than 0.05 or a specific significance level for it to be significant. Thus, the performance of male and female students does not differ significantly in mathematics, science, and SAT exams because the test values are [F (1, 38) = 0.192, p = 0.664], [F (1, 38) = 0.308, p = 0.582], and [(F (1, 38) = 0.382, p = 0.540] respectively. Therefore, the hypothesis test shows that the performance of students in mathematics, science, and SAT does not vary according to the gender of the students
The Second Hypothesis
H0: The White American, African American, Hispanic, and Latino students do not exhibit significant differences in mathematics, science, and SAT scores.
The appropriate tests of this hypothesis are one-way ANOVA and post hoc analysis. These tests are appropriate because the data meet the following assumptions.
- The dependent variables, which are mathematics scores, science scores, and Sat scores, are in a continuous form.
- The independent variable, which is race, comprises four categories.
- The scores of mathematics, science and SAT are quite independent of each other and race.
- The scores of mathematics, science and SAT have no significant outliers.
- The distribution of scores for mathematics, science, and SAT follows the normal distribution.
- The independent variable, race, has more than two categories, and thus requires post hoc analysis.
Race and Mathematics Performance
Table 7.
The ANOVA table indicates that White American, African American, Hispanic, and Latino students exhibit a significant difference in mathematics scores at a significance level of 0.05 [F (4, 35) = 13.527, p = 0.000]. Thus, the test rejects the null hypothesis, which holds that mathematics performance does not vary according to the race of students.
Since there are four independent variables, comparative analysis of two variables exhibits some internal variations. Post hoc analysis shows that mathematics scores significantly vary among students of all races except for Hispanic and White American students and Hispanic and African Americans because their p-values are 0.379 and 0.102 respectively, which are insignificant.
Table 8.
Race and Science Performance
Table 9.
From the ANOVA table, it is evident that there are significant differences in math scores among students according to their races at a significant level of 0.05 [F (4, 35) = 50.571, p = 0.000]. This test, therefore, rejects the null hypothesis and accepts the alternative one, which holds that science scores vary according to different races.
Post hoc analysis shows that significant differences exist between scores of two races except for the White and Hispanic students, which do not have significant differences because the p-value is greater than the significance value.
Table 10.
Race and SAT Performance
Table 11.
According to the ANOVA tables, at a significant level of 0.05, students exhibit significant differences in SAT scores according to their races [F (4, 35) = 50.345, p = 0.000]. Hence, the test rejects the null hypothesis and accepts the alternative one, which supports that SAT scores differ significantly among students from different races.
Post hoc analysis shows that significant interracial variation exists in the SAT scores except between the White American and Hispanic students. The p-value of the variation between African American and Hispanic students is 0.311, which is quite insignificant.
Table 12.
Decision
The ANOVA test and post hoc analysis indicates that variation is mathematics score, science scores, and SAT scores differ significantly across students of different races. Since the p-value is less than 0.05, the test, therefore, rejects the null hypothesis and accepts the alternative one, which states that the White American, African American, Hispanic, and Latino students do exhibit significant differences in mathematics, science, and SAT scores.
The Third Hypothesis
H0: Positive correlation does not exist between mathematics scores and SAT scores.
The data meet the assumptions of correlation analysis because mathematics scores and SAT scores are continuous variables, the linear relationships, and they do not have significant outliers.
Table 13.
The correlation table shows that a significant correlation exists between mathematics scores and SAT scores, r(38) = 0.726, p<0.05. According to Weinberg and Abramowitz (2008), a strong and positive correlation ranges from 0.7 to 1.0. Hence, since the correlation value is 0.726, it is very strong and positive, while the p-value is 0.000, which is very significant. In this view, the Pearson correlation test rejects the null hypothesis because the correlation value is very significant.
Decision
Therefore, the correlation test rejects the null hypothesis and accepts the alternative one, which states that a positive correlation exists between mathematics scores and SAT scores.
Conclusion
The comparative analysis of mathematics scores, science scores, and SAT scores in relation to gender and race provides invaluable information about the performance of students. The ANOVA analysis of different scores for mathematics, science, and SAT in relation to gender indicates that they have no significant differences. In contrast, analysis of mathematics scores, science scores, and SAT scores in relation to race depicts that the scores significantly vary according to the race of students. Moreover, correlation analysis shows that mathematics scores and SAT scores have a significant correlation.
Thus, the ANOVA results indicate that male and female students have similar performances in mathematics, science, and SAT. However, the ANOVA results show that students from various races have exhibited different performances in mathematics, science, and SAT. This implies that education experts need to identify factors that contribute to racial performance. Regarding correlation, the findings show that mathematics scores correlate with SAT scores, and hence, as mathematics precedes SAT scores, it influences SAT scores among students.
References
Jackson, S. (2011). Research Methods and Statistics: A Critical Thinking Approach. New York: Cengage Learning.
Kirk, R. (2006). Statistics: An introduction. New York: Cengage Learning.
Ott, R., & Longnecker, M. (2008). An Introduction to Statistical Methods and Data Analysis. New York: Cengage Learning.
Weinberg, S., & Abramowitz, S. (2008). Statistics Using SPSS: An Integrative Approach. Cambridge: Cambridge University Press.
Appendices
SPSS Output Analyses
Frequencies
Frequency Table
Histogram