Abstract
The Middle East is one of the fastest growing economic regions in the world. Trade commissions from ‘first world’ countries are encouraging their nation’s businesses to seize the opportunities that exist in the Middle East’s low penetration rates and immature, but cash-rich, market. It can be argued, therefore, that the Middle East has ‘green field’ potential for eCommerce. Not all technologists are convinced of the viability of eCommerce within the Middle East. Writing about Dubai, for example, El-Kady (2005), stated that ‘online shopping in Dubai may never match the explosive success it has enjoyed in countries such as the United States’. Nonetheless, it is imperative that the trends of eCommerce are identified so that current and future eCommerce companies can draw on this information to their own commercial advantage.
The main objective of this study is to understand the enabling and inhibiting factors that influence the consumer adoption of eCommerce within Dubai, an Emirate within the United Arab Emirates (UAE). Dubai was chosen for this study due to its rapid expansion and development over the past ten years, making Dubai one of the pivotal commercial centres within the Middle East. In analysing the aforementioned factors, consideration were given to some of the broader theories and models that have been hypothesised about behavioural traits and constraints. These include the Diffusion of Innovation Theory (Rogers 1962), Theory of Reasoned Action (Ajzen and Fishbein 1975), Technology Acceptance Model, (Davis 1989) and Unified Theory of Acceptance and Use of Technology (Venkatesh et al. 2003). It was anticipated that an application of these various theories and models will help provide a clearer and deeper understanding of the individual, societal and cultural influences that are specific to the world of eCommerce in Dubai.
It is important for academia, government and existing and potential eCommerce businesses to understand the effects that a number of factors could have on the successful consumer adoption of their product/solution within Dubai, before they can successfully affect their own relative adoption strategies.
Introduction
Background
The era of the Internet has bequeathed considerably more capabilities and challenges to the way that commercial organisations and governments transact business, both between themselves and with the end consumer. We now live in an age where practically anyone with a home computer and a product or service to sell has the ability to become a player on the international stage of electronic commerce or ‘eCommerce’. eCommerce can be described as the participation of governments, companies and/or individuals in business communication and transactions over the Internet via disparate computers networks.
This thesis focuses on Dubai, which is part of the United Arab Emirates (UAE), a federation of seven Emirates which was formed on December 2 1971. There are seven Emirates which make up the UAE; these are Abu Dhabi (the capital), Dubai, Sharjah, Ajman, Umm Al Qaiwain, Fujairah, and Ras Al Khaimah. Each individual Emirate is ruled by its own ruler who predominantly rules their Emirate with a majority of autonomy, despite there being a federal political system in place. The president of the UAE is chosen by the Federal Supreme Council, which is composed of the rulers of the seven Emirates. The current president of the UAE is His Highness Sheikh Khalifa bin Zayed Al Nahyan.
Al-Maktoum (2008) states that the UAE’s population reached 5.6 million in 2007, of which, the population of Dubai currently makes up approximately 1.45 million of which more than 85 percent are expatriates. According to the records of the Dubai Statistics Centre (2007), the population of increased to 1.422 million in 2006, an increase of nearly 300,000 people since the same reported period in 2005. Sengupta (2008) estimates that the population of Dubai increases by 24,333 people every month, or approximately 800 people daily. In terms of gender, the UAE Interact Statistics site (2007) states that 75.5 percent of Dubai’s population are male and 24.5 percent are female.
El-Kady (2005) states that ‘online shopping in Dubai may never match the explosive success it has enjoyed in countries such as the United States’. This statement was highlighted to the researcher when he lectured to MSc mature aged students at a university based in Dubai earlier this year. The MSc course major was ‘eCommerce’. After the lecture, the researcher asked how many of the students, who were all full-time workers, had used eCommerce services before. Out of a class of approximately thirty (30) students, only three had used eCommerce previously and only one more than twice. This led the researcher to ask the question, ‘who are the users of eCommerce within Dubai?’ The researcher believes that eCommerce and eBanking are strong within Dubai, but as this report will show, the trends surrounding eCommerce usage are quite distinct.
Statement of the Research Problem
Within North America and Europe it has been widely acknowledged that the growth of eCommerce has been significant and analysts estimate that eCommerce revenue will reach just over US$457 billion in 2008 and doubling to over US$920 billion by 2012 (‘Favier 2007’, ‘Mulpura et al. 2008’).
With certain elements of Dubai’s inhabitants portraying a ‘souq mentality’, where it is typically necessary for the consumer to adhere to a philosophy of “touch before you buy”, these individuals also have a tendency to associate commerce with a need to achieve some level of social stimulation which one received of bargaining down to the best price for the goods or services that one requires. This approach to shopping is possibly one of the inhibitors which is holding back the full potential of eCommerce (El-Kady 2005). According to Rahimi (2008) who stipulates that despite an estimated 20 percent a year growth rate in internet users to a current 33.5 million in the Middle East and that in 2007 eConsumers within the Middle East spent US1.5 billion on eCommerce products and services, but Middle Eastern eCommerce adoption trails that of Europe and North America.
This slow adoption of eCommerce can possibly be attributed to two main derailment factors, these being:
- The stage of social and economic development within the region, encompassing the classification of this developing society;
- The impact of Internet security issues that have plagued the Middle East for the past several years.
When an eCommerce enterprise is looking towards Dubai to enhance their market share, it is important for their business strategy to take into account that communications and thought processes differ from region to region, country to country, and culture to culture. A prime example within Middle Eastern culture is when considerable negotiation takes place leading into the ‘settlement’, signified by shaking hands (Hofstede 1991). Yet, in the Middle East the shaking of hands does not actually signify the end of negotiations but, in reality, identifies that the negotiations have just become more serious in nature and the real negotiation has just been set in motion. Hofstede (1994) further summerises a number of recognisable cultural traits that could quite easily be applied to the current societal attitudes in Dubai. These include:
- ‘Collectivist culture’ – which can be described as a tight social framework where loyalty is given to the clan, relatives and organisations. This is further reflected within the decision making processes; organisational structure and business conduct that is built on a perceived trust basis;
- ‘Power distance’ – where society accepts the fact that power within institutions and organisations is distributed unequally;
- ‘Uncertainty avoidance’ – which is when the society excepts and demonstrates strong characteristics such as aggressive behaviour, the showing of emotions is permissible; a strong belief is placed in the knowledge of recognised experts; and ordinary citizens are perceived as incompetent compared with the authorities.
Many researchers have also argued about the important influences of cultural shifts from one ‘age’ of society to another. These theories also resonate in Dubai. Reigeluth and Garfunkle (1994), for example, classified societal development into three ages – ‘the agrarian age, industrial age, and the information age’. Table 1 provides a simple outline of the differentiation between these three ages.
Table 1 – Major Paradigm Shifts in Society
The business environment in the Middle East is heavily influenced by ‘Sharia’ or Islamic law. Read (2004) stated that Sharia is the building block that governs both the public and private lives of those living within an Islamic community, and governs many aspects of day-to-day life: politics, economics, banking, business law, contract law, and social issues. However, despite being an Islamic country, the culture of Dubai reflects an apparently more liberal lifestyle than other Middle Eastern countries. From an outsider’s point of view Dubai seems to be considerably westernised. Nonetheless, there is still a tendency for nationals to portray traits similar to those found in a fatalistic and masculine dominated society, described by Kluckholn and Strodtbeck (1961) as a ‘subjugation culture’, that is a society whose attitudes are typically accepting and where life is seen primarily as pre-ordained.
Today’s Middle Eastern business temperament and landscape has been shaped and defined by several catalytic events. Oil exploration within the region has obviously been the primary catalyst for fast-tracking society from an agricultural society (agrarian age) to an industrially focused society (industrial age). The discovery of the Dubai oil reserves in 1965 prompted the frantic rush towards modernisation and country wide infrastructure development programs. These programs were prominent between the mid 1960s and early 1970s, stalling in the late 1970s until the mid 1980s. This was mainly due to the collapsing of the commodity and oil prices.
The first Gulf War in 1991 caused oil prices to increase substantially, just as Dubai realised that they had only thirty five to forty years of oil reserves remaining. This revelation lead to His Highness Sheikh Mohammed bin Rashid Al Maktoum, UAE Vice President, Prime Minister and Ruler of Dubai, to embark on the rapid modernisation of Dubai (Al-Maktoum 2008). HH Sheik Mohammed bin Rashid Al Maktoum is determined to establish and build other successful pillars of industry such as tourism, technology, logistics and financial services. Based upon Reigeluth’s model, shown in Table 1, it appears that several countries within the Middle East are moving from the agrarian age, fast tracking through the industrial age, directly to the information age and, like Dubai, strive to become knowledge and technology based economies.
Although important, the cultural aspect surrounding the acceptance of eCommerce within the Middle East and, in particular, Dubai is not the only factor that has the potential to adversely affect the consumer adoption of eCommerce. Another important factor is the user’s perception of the level of security surrounding eCommerce and, more pointedly, the security of personal information. Internet security is an important enabler for the consumer adoption of eCommerce. Bank fraud is growing at an enormous rate. In the context of the United States, as reported recently:
‘Nearly 2 million Americans have had their checking accounts raided by criminals in the past 12 months, according to a soon-to-be released questionnaire by market research group Gartner. Consumers reported an average loss per incident of $1,200, pushing total losses higher than $2 billion for the year (Sullivan 2004 )’.
One of the most recent security phenomena increasing the propensity of eBanking fraud is ‘phishing’. Phishing can be described as a fraudulent act in which the potential hacker sends an email to an consumer with the representation that the email originated from a legitimate establishment, such as a bank. The objective of the hacker, however, is to gather personal information from the consumer with the intention of using it for fraudulent purposes. A phishing attack can only succeed if the user clicks on the supplied URL and updates their personal and banking details as instructed. One of the reasons why phishing has been so successful is that the user will see that the site they have been redirected to ‘looks and feels’ like their normal eBanking site, but in reality this site is a facsimile. This is achieved by the hacker interchanging letters from a different character set for the legitimate character in the site name.
Although phishing is seemingly a recent occurrence in eBanking, it has already reached disquieting proportions. Litan (2005) stated that by June 2004 phishing and identity theft had already exceeded an estimated US$2 billion, with the finance industry becoming anxious that this could be just the tip of the iceberg. This has been proven with new statistics recently published by McCall (2007), an analyist from Gartner Inc, where he states that phishing attacks in North America have escelated exponentially in 2007 being estimated as high as $3.2 billion. McCall (2007) also found that approximately 3.6 million North American adults lost money in phishing schemes in the 12 months ending in 2007, as compared with the 2.3 million who did so during the same period in 2006.
‘Dubai is not immune to cyber crime’, as reported by Kaul (2003:np), ‘in the UAE alone, hacking in the first six months of 2003 grew 300 percent over the last six months of 2002. Just one hacking incident of ATM fraud, caused the UAE to lose between US$2 billion and US$3 billion’. Although the percentage of actual hacking attacks have been considerably lower than the rest of the world, the profile, complexity and sheer fiscal loss within Dubai has been severe. This has given Dubai and the Middle East a reputation of lacking the necessary regulatory controls within its financial services industry to abate such crime, particularly when compared to the financial controls and legislation implemented within the past five years throughout Europe and North America. This is evident when trying to use a credit card issued from a ‘non-approved’ country, such as Dubai. The credit card often fails to qualify under the latest stringent standards imposed from online financial institutes such as PayPal.
Very little is known about the actual amount of computer crime that has been perpetrated to date. Thibodeau (2001:np) stated that, ‘Government officials in North America estimate that only 20 percent of computer crime incidents are being reported because the agencies either don’t have the technical sophistication to discover the crimes or they want to keep bad news quiet’. Thibodeau also states that ‘this attitude is destined to change in the near future, especially with the Federal Deposit Insurance Corporation (FDIC), the Board of Governors of the Federal Reserve System, the Office of the Controller of the Currency, and the Office of Thrift Supervision’s recent interpretation of the Graham-Leach-Bliley Act’. Governments and regulatory boards will start to pressure the banking and finance industry to be more forthright about its ‘cyber and personal data infractions’.
TechWeb News (2005) reported that the aforementioned US government agencies informed the banks that they it was mandatory to implement a response program which would warn eConsumers of potential issues when information has been accessed inappropriately and that this access could result in substantial harm or inconvenience to the customer. The consequences of this landmark interpretation are bound to have a substantial impact on the way the banking and finance sector looks at both its internal and external data policies and IT security.
From an individual perspective, not everyone who uses the Internet is security conscious. The vast majority of Internet users may not even have a firewall implemented within their home or work IT environment. It is therefore understandable why security could be a major hurdle for potential Dubai eConsumers engaging in eCommerce.
The Purpose of this Study
This study was undertaken to obtain a greater understanding of the enablers and inhibitors needed to create a model that would outline eCommerce adoption within Dubai. Although there has been considerable literature published which investigates the adoption of technology within various societies there has been little literature that identifies the adoption of technology within a society rapidly moving from one social order to another, as is currently being experienced by Dubai.
Sampler and Eigner (2003) indicate that Dubai, in the early 1960’s, showed traits of being an Agrarian society, some of these traits are identified within Table 1Table 1; where in 2005 the ruling government to acknowledge that they are now striving to have Dubai become a information age based society. (Al-Maktoum 2005). Although there have been various studies which identify technicality adoption trends within the developing world such as ‘Chong, 2006’, ‘Davis, 1989’, ‘Nguyen and Johanson, 2008’, ‘Smith et al, 2008’, ‘Venkatesh, Morris, Davis, Davis, 2003’ there have been limited studies completed on such a rapidly changing society such as Dubai.
This project strived to create a model which would outline eCommerce adoption within Dubai.
To be able to develop this model various government organisations, business and tertiary educational establishments were targeted in the investigative phase of this study. These organisations were chosen due to their predisposition in allowing researchers to approach their employees, students or membership, through authorised channels for the purpose of research.
The structure of this report
This report has been logically structured to take the reader on a journey of discovery. It has been divided into seven distinct components, as follows:
- Introduction
- Literature review
- Theoretical model
- Research methodology
- eCommerce analysis within Dubai
- Evaluation
- Conclusions and observations
It is the intention of the researcher to provide a solid grounding in relation to the history and trends of eCommerce and eBanking worldwide. This will ensure that the trends surrounding eCommerce adoption within Dubai, which are been identified within the section 2 – ‘Literature review’, can be benchmarked correctly.
Literature Review
The new age economy incorporates both traditional ‘bricks and mortar’ firms and ‘e’ firms built on Information and Communication Technology (ICT). ICT also serves as the bridge or the gateway that enables the traditional and the ‘e’ economies to interoperate effectively. Within this new economy, there is a diffusion of norms, cultures and the manner in which business is conducted in the new age. While in some cultures a handshake between business associates still seals a deal, it now needs to be supported and augmented by a massive exchange of information. This can only be enabled by an effective ICT strategy. But, ICT cannot exist on its own; it must serve and be accepted by people and business. The business community of Dubai seems to have realised the enormous potential that ICT offers as a means to build strategic networks across Africa, Asia, the Arab world and India.
An ICT infrastructure cannot grow overnight and it cannot be transplanted and forced into a culture that is unwilling or unable to accept it. In today’s modern society we speak of a clash of concepts rather than a clash of culture. The ever widening digital divide continues to separate the ‘haves’ from the ‘have nots’ of the world. What is required for ICT to grow and flourish, within both developed and developing countries, is awareness. If a nation is to rise up the “needs hierarchy”, as identified by Maslow, it must have sufficient support by the government and most important, a population that is ready to embrace technology. eServices is a manifestation of ICT along with Business to Business – B2B and Internet Banking and so on. It touches housewives, students, professionals as well as businesses and it gets personal with peoples’ lives, touching them in more ways than one. As an example, while B2B would allow a company such as Wal-Mart to source its products from South America through the supply chain and distribute it in Dubai, it would be eCommerce that would help a person sitting at home to browse thousands of items, select the required one, order it and pay for it. One of the most important facts of eCommerce is the ability to level the playing field between multi-national companies and the local corner store. eCommerce provides the opportunity for unprecedented access to markets never before seen in history. For the sake of this study all forms of eCommerce will be referred to as eServices.
Table 2. Types of eServices
For eCommerce to develop, take root and have a large penetration base of adopters, a stable and viable economy is required, plus the right cultural traits and the right cultural norms to allow new and emerging technology to be adopted. This chapter outlines an extensive review of these areas and also reviews the perspective of global eServices and the existing eServices in Dubai. The main goals of the chapter are to assess the economy and culture of Dubai; understand different models of technology adoption in developing countries; and the extent of eServices available in Dubai.
Dubai – History, Demographics and State Profile
Dubai is one of the seven Emirates that form the United Arab Emirates (UAE). It is the largest Emirate of the seven.
Ancient Stone Age nomadic people settled in the mangrove swamps along the coastline where modern day Dubai is situated. The remains of their settlements have been dated to 7000 BC. Civilisations of Byzantine and Sassanian empires controlled the gulf areas and the people worshipped the god Bajir. After the Prophet Mohammed extended the teachings of Islam from Mecca, the people in the surrounding regions embraced Islam and the Caliph of Umayyad drove out the Sassanians and assumed control it. Around 1050 AD, Dubai was known for its pearl industry and this fact is mentioned by Abu Abdullah al-Bakri, the Arabic geographer of the 10th century. For many centuries, the city served as a port and centre of trade for the Arabic region because of its strategic location, sufficient backbays and calm waters. This allowed ships to be outfitted while they berthed. The state came under British control in 1892 and gradually developed to acquire importance in the region (UNISA, 2005).
With the discovery of oil in 1967, the state underwent astronomic changes in its economy and with the influx of petro dollars, the region became the centre of ‘geo-oil’ politics with all the Western nations developing a keen interest in helping the region to develop and exploit the oil resources. Unlike other petroleum economies, such as Nigeria or Venezuela where oil revenues have been squandered and a majority of the people live in poverty, Dubai and other Arab oil producing countries have a remarkable leadership with the great foresight to use oil revenues to develop their nations and invest in the future. The leaders of these regions have now begun to plan for the future, recognising that at some stage oil resources will be depleted. Plans have thus been implemented to generate revenues and employment through trade and financial investments (Dubai eGovernment, 2008).
While the UAE has based its GDP predominately on petroleum economies, Dubai has transformed itself into the commercial hub of the Middle Eastern region. It has moved out of the petroleum driven growth, into a business and investment centre. For the year ending 2005, Dubai had a GDP of 37 billion USD and there are plans to achieve a year on year growth of 11 percent to achieve an expediential growth of their GDP to 108 billion USD by 2015. The main revenue earners are from new pillars of industry. These include tourism, real estate, construction, financial services and re-export; while petroleum and natural gas will have contributed an estimate of less than 6 percent to the GDP (Reuters, 2007).
Demographics
By 2007 end, UAE had an estimated population of 4.48 million. With further economic developments the population is forecast to grow by 6.12 percent in 2008 and by 6.31 percent in 2009, to reach a figure of 5.06 million. Dubai had a population of 1.42 million as per the 2006 census and the number of females was 349,000 and males was 1,073,000 – a skewed ratio of 1:3 for women to men. The population is expected to rise to 1.59 million by 2009. The population is made up of 42.3 percent Indian; 17 percent Emirati; 13.3 percent Pakistani; 7.5 percent Bangladeshi; 9.1 percent Arab and 10.8 percent others. Islam is the official religion and Dubai is an Islamic state with all laws and legislation following the Islamic tenets. The state allows practice of other religious practices and building of places of worship, subject to some restrictions (Kawach, 2008).
Building the ICT sector in Dubai
The Information and Communication Technology (ICT) sector has greatly improved in Dubai and the government has invested heavily in the infrastructure to allow IT and Internet Technology Enabled Services -ITeS companies to evolve. While IT companies develop and market software products, ITeS companies provide help desk and support services using the Internet and software applications. Some of the areas that have been exclusively developed for promoting ICT includes Dubai Internet City – DIC, Dubai Media City – DMC, Knowledge Village – KV and Ras Al Khaimah IT Park. These are special free trade zones that are 100 percent tax free and allow 100 percent foreign ownership. ICT has a number of IT majors, such as Microsoft, Oracle, Cisco, and Siemens, with a total employee strength of 5500 and the plan to provide software development services, back office support to clients from Africa, India and the Arab nations. The infrastructure is very impressive but the city relies on foreign workers rather than Emirate citizens to run the operations. DMC offers media organisations to set up a base and offers facilities for different TV companies, Internet media services, online magazines and other forms of media (DIC, 2007).
Pohjola (2003) has pointed out that ICT is perceived as one of the important drivers of economic growth in developed and developing countries. Access or denial to ICT is often one of the main reasons for differences in revenues between countries. The author speaks of the digital divide or the information poverty that exists between countries and points out that early adopter often have a sustainable advantage over other countries.
When one considers that developing countries such as India have invested in IT at a very early stage and many Indian IT companies are regarded as some of the best IT companies in the world, Dubai would wish to develop similar competence in the IT related field.. The state has built all of the required infrastructure and many IT companies have set up offices in Dubai. ICT is gaining mass use.
The following table provides statistics on increase in use of different technologies in the UAE.
Table 3. Technology Adoption in UAE
As seen in the above table, the number of subscribers for Internet, dial-up Internet and Broadband internet has risen by almost 80 percent in 2006 when compared with 2005.
According to Pohjola (Pohjola, 2003), developing countries typically spend about 7.1 percent of the GDP on ICT infrastructure. The breakup is IT hardware 1.1 percent; Office equipment 0.1 percent; Software 0.5 percent, IT Services 0.9 percent; Internal Spending 0.9 percent; Total IT 3.6 percent, Telecommunication 3.7 percent and total ICT is 7.3 percent of the GDP. The figures do not speak of the expenses in construction, land costs, power and other cost heads. According to reports from World of Information Technology and Services Alliance- WITSA (WITSA, 2008), Dubai spent about 3.58 percent of the GDP on ICT in 2006. It is evident that there is a lot of potential for ICT growth in Dubai and consequently for eCommerce. ICT applications represent a huge market in Dubai. This may be one of the reasons for multinational IT companies to be investing in Dubai.
A more detailed review of ICT spending trends in Dubai is provided in Section 2.4.
Foreign investment
FDI in 2006 has shown an increase of 13.4 percent over 2005 and while in 2005, it was 37.4 billion Dirhams, FDI in 2006 was 42 billion Dirhams. FDI has been made in various sectors such as mining and manufacturing. The following table provides statistics about sectors in which FDI has increased or decreased.
Table 4. Dubai FDI Inflows in million AED
As seen in Table 6, the largest percent rise in FDI was in the Hotels and Restaurant sector, with a FDI of 38 million Dirhams in 2006. However, the Financial Intermediation & Insurance sector had the largest value of 15,025 million Dirhams, while the construction sector had a FDI of 14,652 million Dirhams. The Manufacturing sector has shown an increase of 43.9 percent with a FDI of 1,061 million Dirhams. The table indicates that foreign investors have gained sufficient confidence to increase investment in Dubai.
Table 6. Origin of FDI in million AED
The above table shows that countries from Europe have provided the largest FDI of 19,047 million Dirhams with non-Arab Asia Countries investing 17,569 million Dirhams. North and South America invested 3,034 million Dirhams, representing a decrease of 29 percent over the 2005 values. Arab countries have invested 565 million Dirhams, Gulf Cooperation Council (GCC) countries 1,208 and Oceania investing 911 million Dirhams.
The Competitiveness Policy Framework is illustrated in Figure 1. Competitiveness Policy Framework. The framework is used to asses the competitiveness of a country by comparing key indicators with other countries. Specifically it would indicate where a country stands with reference to other countries in the areas of investor friendly government policies, infrastructure, economic performance and business efficiency.
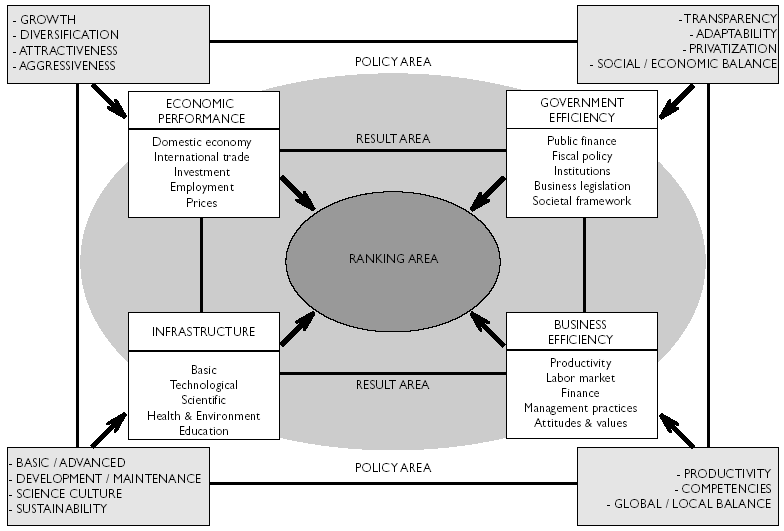
“According to the Internatonal Media Dubai IMDreport of 2005 ‘”The central ‘Ranking Area’ depicts the consolidated rankings of Dubai in World Competitiveness while the ‘Result Area’ indicates the four “chapters of competitiveness” that explain these rankings and they are Economic Performance, Government Efficiency, Business Efficiency and Infrastructure. Each chapter has a number of individual criteria, which are ranked and consolidated into 5 sub-factors”. Dubai ranks 17 in the competiveness among other countries while USA has the first rank, Hong Kong 2nd, India 40th and Venezuela 60th rank. With a rank at 17th, Dubai is certainly successful at attracting FDIs and this trend is expected to continue (IMD, 2005).
Broadening the economic base
The government of Dubai is planning for the future by expanding the economic base and entering into other areas of trade and commerce. It is prepared for the fact that hydrocarbon reserves will be depleted in a few decades. UAE and Dubai governments have entered into eight bilateral trade agreements with the GCC and the European Union (EU) to expand trade in products other than hydrocarbons. There are plans to remove trade barriers. While in the earlier era trade agreements covered goods and products, the current agreements would also include investment and services and investment by GCC. There are efforts to increase the economic base by expanding into areas such as trading, investment, financial services, telecommunication and tourism. Though Dubai and UAE have industries such as Aluminium smelting, they are manned mainly by high wage foreign workers and it remains to be seen to what extent Dubai can be cost competitive with low wage countries such as China. One of the main advantages that Dubai can obtain is that it can invest in other countries and this is one way to ensure that the oil revenues appreciate (Franco, 2007).
Dubai actually represents a very huge market for items such as food, seafood, automobiles and automobile parts, cement, apparel, toys, dairy products, meat and poultry. The state imported about 89 billion USD of goods in 2006 while exporting non oil goods worth 137 billion USD. While these figure may appear very attractive, the fact is that most of the exports are termed as ‘Re-Exports’ where Dubai imports products and then re-exports them to other countries, mostly other states of UAE. The profit margin is much less in such ventures. It would be very probable that in the future, other Arab states may decide to import items directly from the countries of origins, at lesser costs and this would place Dubai in a huge trade deficit (HKTDC, 2007). So the very nature of trade is under scrutiny and this needs to be examined very closely as to how long it can be sustained.
UAE and Dubai has immense oil revenues but as of March 2008, the foreign exchange reserves are about 296.20 billion USD and in terms of Forex reserves, UAE is ranked 40 in the world. China, ranked 1st in the world, has 7.52 billion USD and India has 3.13 billion USD and is ranked 4th (SWF, 2008). Given this, the government of Dubai is not well placed to squander Forex reserves.
Perhaps, in foresight, money managers in the government have decided to invite foreign participation by providing lavish world class infrastructure and facilities in the form of construction, housing, public infrastructure and in ICT. Dubai has also developed infrastructure such as the Dubai Industrial City – DIC where foreign companies would be setting up industrial units. The government should encourage companies to use these facilities to either manufacture the items or import them as complete knock down kits (CKD) and assemble them for domestic consumption and also re-exports.
While it is expected that foreign companies would be investing in these free economic zones, the government should rethink its strategy of offering 100 percent tax exemption as the present economic model would become unviable in the future. Dubai uses a model in which the government spends huge sums of money to develop infrastructure, charges a nominal rent for lease of these properties or places rent control acts to prevent rents from rising, then extends 100 percent tax rebate to investing companies besides providing them with subsidised power and other utility. These companies hire foreign, low cost workers and then manufacture goods for export that are again free of customs duty.
Dubai Trade
Dubai as a trading hub takes up import, export and re-export of a wide variety of products. In 2006, Dubai imported products worth 59,910,428 USD, exports were valued at 4,975,057 USD and re-exports were valued at 21,337,583 USD. Please refer to ‘Table 2.1.5. Non Oil Dubai External Trade Statistics 2006’ that gives values in USD of import, export and re-export of different product categories for 2006.
Table 2.1.5. Non Oil Dubai External Trade Statistics 2006 in USD ‘000
As seen in Table 2.1.5., items such as maximum value of imports were machinery and mechanical appliances and natural or cultured pearls along with precious and semi precious metals and stones. There is a trade deficit between imports, exports and re-exports of the value of 33,597,788 thousand USD USD.
The table below provides details about the top twenty import country origins for 2006. These are the countries from which Dubai imports the most goods.
Table 2.1.6. Dubai top twenty Import Origins 2006
As seen in Table 2.1.6., Dubai imported the most items from China, India and USA.
The following table provides details of countries to which Dubai exported the most non-oil goods.
Table 2.1.7. Dubai top twenty Export Destinations 2006
New pillars of industry
In developing the new program for increasing the economic base, the government of Dubai has constructed many world class facilities and provided infrastructure regarded as ‘pillars of the industry’. These are designed to reinforce the image and message that UAE and Dubai are looking beyond crude oil and want to attract foreign investors. The next sections briefly discuss some key projects that have been developed. These pillars of the industry include ports, transportation, airports, Internet City, Free Trade Zones and others.
Ports
Dubai’s ports, such as Jebel Ali and Port Rashid, are designed to handle the large amount of cargo that is exported or imported. Dubai ports are affiliated to Dubai Ports World – DP World, a very large group that operates 45 terminals in the world and is a part of Dubai Holding. By interlinking the entire sister terminals, information access and sharing becomes very easy and delays in clearance and customs are avoided.
The Jebel Ali port is the largest man-made harbour in the world and it is the largest port in the Middle East. The port area is about 52 square miles and 67 large container ships can berth at the same time. With excellent loading and unloading facilities, the time spent at the docks for the ships to load or unload is very much reduced. What makes the port more important than just the massive harbour or the berthing facilities is the service it provides. This includes handling of container cargo, general and bulk cargo; a Roll On – Roll Off (Ro/Ro) facility with large parking lots for cars imported for local use or for re-export; livestock vessel berthing; reefer facilities; commercial trucking for on-road delivery of containers and other cargo; ferry and cruise terminals; a tanker facility for two multi-user berths for tankers and storage tanks for bunkering and storage of crude for transport; container repair; sea to air cargo facility; cold storage facility; long-term vessel lay-by facility for repair of ships or those waiting for cargo. In addition, the port is adequately supported by eServices. This offers a computerised system covering all aspects of shipping, such as booking, accessing the required forms, understanding the documentation required, knowing the status of the cargo and so on. This computerised facility reduces delays, brings efficiency and makes the whole process transparent. It removes the problems that importers and exporters face while sending their consignments.
Port Rashid is somewhat smaller and is linked to Port Jebel Ali and together they form the Dubai Ports Authority (Jebel Ali, 2008).
These two ports form the main pillars of Dubai trade and economy. Transport by sea is still the most cost efficient form for long distance logistics. By investing in these ports, the government has provided the means for exporters and importers and industries to send or bring in consignments. In many developing countries, ports are a big bottleneck and delays in the congested ports run into weeks. The two Dubai ports allow industries to build on the economies of scale so that the market prices can be maintained at the required level and costly delays are avoided.
Jebel Ali Free zone
The Jebel Ali Free Economic Zone (FEZ) is an area where foreign companies can operate with 100 percent equity holdings. Outside the free zone and in other areas of Dubai and UAE, companies have to enter into a 51:49 percent partnership with a local company that would hold the majority stake in the venture. But in the free zone areas, foreign companies can have 100 percent ownership and undertake any or all activities such as import of raw materials and goods, processing, re-export, re-manufacture or re-process, without having to pay any import or excise duty. Only standard criminal and civil laws of Dubai are applied to these companies and they are free to operate to the best of their means. Investments in the zone rose to 12 billion USD in 2007. (Jafza, 2008).
The main advantage of the free zone is that bureaucracy is reduced, as is the number of statutory rules and regulations to be followed. In addition, workers can be employed at very low cost. Manufacturing companies gain cost competitiveness when they import CKDs, assemble them in these zones and export the completed products to other markets. In addition, the companies are allowed to repatriate 100 percent of the profits or capital, with no minimum amount of investment and no restrictions on currency. Corporate and personal income tax is also not levied and goods can be directly exported from this region to other destinations. If the goods are sold into the local UAE market, then the standard import duties are levied. These free zones are provided with excellent support services, IT networks, infrastructure, utility and other features. Many US and Asian companies such as Sony, GM, Hyundai, Grundig, IBM, Samsung and other companies have set up huge plants and distribution warehouses. These companies use the free zones to assemble electronic devices and engineering goods and export them to Africa and parts of Asia (Jafza, 2008).
Advent of Free Zones
The free zones that have become a vital part of Dubai’s strategic plans seem to be based on the cluster theory, as suggested by Porter (1998). He defined clusters as “groups of interconnected firms, suppliers, related industries and specialized institutions in particular fields that are present in particular locations”. According to Porter, competitive advantage for a company is produced by the value that a firm is able to create for its buyer and this can be diagnosed through the supply value chain. He has further argued that innovation, improvement and change are critical in forming a competitive advantage by applying better methods to compete in an industry. Firms that operate in a cluster will manage to gain advantage over the national and international competitors if they can find new and better methods of production, building an economical supply chain, design, linking elements of the value chain and permit knowledge spill over. For industries in a cluster to thrive, they need to manage and administer the whole supply value chain made of vendors, buyers, suppliers, distribution and sales channels and the employees.
Kuah (2002), while prescribing to the cluster theory, points out that this theory is not new. Since biblical times, certain regions have carved a name for themselves. Citing examples of the ship building industry of Glasgow to the IT sector of Silicon Valley of US, steel instruments from Sheffield UK, the Indian IT industry and others, the author argues that certain regions became famous clusters because of the availability of natural resources or because the climate favoured growth of items such as tea, precious metals, crops and so on. But the fact remains that clusters enjoy a tremendous advantage in the form of a pool of skilled personnel, higher influx of technology, scale of economies and when managed properly, clusters do help a particular industry, community or group of people to grow.
With the present concept of global economy, Garelli (1997) suggests that that the ‘economy of globality and proximity would tend to be a major force in a market’. By being global, the production mechanisms can be situated in one continent and the end users in another and with improvements in communications and transportation, the world has become a global village and physical distance is no longer a barrier to international business relations. Multi-national corporations thrive on tapping international resources such as cheaper labour, raw material and location advantage for added competitive advantage.
It can be deducted from the above discussions that the key factors for a cluster to be successful are: enhanced supply chain, disbursing benefits to members in the community and a willingness to adopt new technology and ideas and to firmly believe in innovation. The most important element for a cluster to be successful is a sustainable supply chain. When these observations are considered, it is evident that free zones such as the Jebel Ali are promoting clusters and there is a rising concentration of industries such as textiles and apparel manufacturing, engineering goods, electronic items and other such products. By developing the free zones, Dubai is developing the strategic cluster theory and it is expected that in due course of time, sufficient mass would be developed in the area so that certain specialised set of services and product offerings would emerge
Dubai World Central
Dubai World Central (DWC) is the umbrella organisation that has planned a number of mega construction projects in Dubai. These projects are part of the new economic development plans that the government has initiated. They are forward-looking and visionary and are being planned in phases. There are currently six projects that are managed by DWC: Dubai World Central Residential City, Dubai World Central Logistics City, Dubai World Central Enterprise Park, Dubai World Central Commercial City, Dubai World Central International Airport and Dubai World Central Golf Resort. It is estimated that a total of about 125 billion USD is invested in these projects. In a region known for the lavish and grand construction, the six projects are designed to place Dubai as the preferred location for residents, professionals, trading businesses and various industries and service organisations (DWC, 2008).
Dubai World Central Residential City is a high profile and exclusive residential city that would will provide housing for the thousands of professionals who would be working in the different business areas. With 7.16 million square metre of real estate, more than 50,000 professionals could be housed in this area. In addition to modern amenities, the area will have extensive utilities, power, water supplies, schools, recreation, hospitals, shopping malls and other facilities (DWC, 2008).
Dubai World Central Logistics City is designed to provide supply chain logistics for the immense trade and business activities that evolve in Dubai and the free economic zones. The City will have modern office buildings and free hold plots for trading companies, industrial businesses, logistics service providers, distributors, and forwarders. It will also provide shared facilities, such as air-side cargo handling facilities, air to air or air to sea support along with warehouses for storing in transit goods. Air freight of 12 million tons per annum could be handled through the 22 air cargo terminals. There are plans to have a dedicated aviation area that would provide direct apron access. There are also plans to provide accommodation for 40,000 employees who would be working in the area (DWC, 2008).
Dubai World Central Enterprise Park is designed to provide a special environment for companies that would be using alternative products, advanced materials and special technologies. A modern university is also being planned for 4,000 students, who would be taught to link research and industrial applications (DWC, 2008).
Dubai World Central Commercial City is designed to be the financial hub for Dubai and about 130,000 people would be working in more than 850 skyscrapers and towers. There would also be luxury villas, very expensive homes, hotels, shopping malls and avenues for entertainment (DWC, 2008).
The Dubai World Central International Airport is planned to be the heart of the Dubai World Central projects and when completed, it would be the largest airport in the world in terms of cargo handling and passengers. The complex would serve as a transit point for Pan America and Asia travellers and also serve as the hub for the large amount of cargo that is expected in the future. When fully completed, it will be able to handle about 12 million tons of cargo. It will also have 6 parallel runways and will be able to handle the largest commercial aircrafts (DWC, 2008).
Something of an anomaly in a desert region, the Dubai World Central Golf Resort will have two 18-hole golf courses, complete with fully landscaped lawns and garden, high income residential buildings along the periphery, hotels and boutiques. The golf course will cater to the local demand and is also expected to be a part of the PGS tour in the future (DWC, 2008).
Air hub
Dubai has a high volume of trade and while the ports provide shipping for bulk products and engineering goods, the air ports provide a very vital link between the different business districts, consumers, organisations, shopping malls and other entities. (Dubai Airports, 2008).
The existing Dubai International Airport is the 6th largest aviation hub in the world and handles more cargo and passengers than the Changi International Airport of Singapore. In the first quarter of 2008, the airport saw 9.34 million passengers and more than 124 airlines from 207 destinations across the world use the airport. There are plans to achieve 40 million passengers by the end of 2008. Freight handled in the first quarter of 2008 was around 399,718 tons, a 10 percent increase over the same period in the previous year. In the future, this airport will serve as a feeder to the Dubai World Central International Airport, which is expected to be about 3 times the size of the current airport. (UAE Interact, 2008).
With the advent of low cost carriers that operate for relatively shorter distances, Dubai offers a central hub for transit passengers. To meet the requirements of such passengers, Dubai has been committed to providing them with the best in shopping and eating experiences. There are a number of duty free shops that offer branded products, available in the best boutiques around the world. The airport also serves as a cargo hub for transhipments to other Middle East countries and Africa, in which western aircraft do not have many routes.
Dubai Gold and Commodities Exchange
The Dubai Gold and Commodities Exchange (DGCX) was set up on November 22, 2005 and is a fully automated exchange that offers a market for online currency exchange and commodities. The exchange offers forward contracts on British Pounds, oil futures, gold, Euro, silver and Japanese Yen. Within a short span of four years, the exchange has made an impact on the financial centres of the world. With hectic trading in commodities, the centre recorded 930,000 futures contracts in the first quarter of 2008, worth about 48 billion USD. With stock markets crashing around the world, gold seems to be a safe haven for investors and Dubai, which has traditionally been an exporter of gold, has seen very high trading volumes (DGCX, 2008).
Dubai International Financial Exchange
The Dubai International Financial Exchange was set up on September 26, 2005 and lists Sukuk, equities, structured products, conventional bonds, derivatives and funds. The exchange is located in Dubai’s International Financial Centre and while the volume of trading is still low, the exchange will soon mature and serve as one of the major bourses of the world (DIFX, 2008).
Tourism
The hospitality industry and tourism in Dubai has experienced a growth of 22.78 percent in revenues and the 6.5 million guests contributed 10.83 billion Dirhams. With 40,862 hotel rooms and suites in 2006, Dubai was running out of hotels and there was a steady period of high occupancy rates of 75 percent. By 2012, the tourism industry is expected to increase to 11.2 million visitors and there is expected to be a 40 percent rise in the number of tourists who would be visiting various states of Dubai (DDTCM, 2008). As seen in the table below, hotel revenues have shown a rise in revenues of between 20 to 22 percent.
Table 2.1.7. Dubai Hotel Revenues Dirhams ‘000
Tourists in Dubai can sample the traditional as well as the modern delights that the city offers. Some of the buildings worth seeing include Al Fahidi Fort, H.E. Sheikh Saeed Al-Maktoum’s house , the Burj-al-Arab Hotel, Jumeirah Beach Hotel, Emirates Towers, World Trade Centre and many more exquisite buildings. Dubai waterfront areas include the beautiful beaches where facilities for jet skiing, snorkelling, swimming, scuba diving and surfing are available. There are also artificial islands such as the Map of the World and the Palms. Many visitors visit Dubai for the shopping experience and virtually all types of electronic goods, apparel, household and domestic appliances, luxury and life style items, carpets, textiles, gold and jewellery, traditional Arab handicrafts and other items are available. Dubai also offers the best cuisine and a very wide variety of dishes such as Western, continental, Chinese, Italian, Mexican and other types are available in the hundreds of hotels and restaurants. People come to Dubai to unwind, relax and usually have a good time (DDTCM, 2008).
Construction
Construction activity has picked up very well in Dubai. In 2004, construction contributed 13,977 million AED. Some world famous structures include the Burj Dubai tower that will cost about 4.1 billion USD and be the tallest man-made structure ever made with a height of 3000 feet. The construction is expected to be completed by 2009 and the lower level of floors is already fetching prices of about 43,000 USD per square metre. Construction sectors employ more than 50,000 people and the sector currently has projects worth more than 125 billion USD. Some other famous buildings are the Rotating Tower, The World Islands, Palm Islands, Dubai light rail transport and many other towers, buildings, housing societies, commercial and residential complexes (DDTCM, 2008).
Dubai wishes to show to the world that it has enough revenues and funds to take up such huge investments. These measures are taken to encourage foreign investors and workers who are expected to come in ever larger numbers.
Water, Power and Energy
Fresh drinking water has been a problem in UAE and Dubai and the government spends increasing amounts on desalination and water harvesting. Interestingly, Dubai has a good agricultural base and has achieved self-sufficiency by growing fruits and vegetables. But the government is asking itself if the vast quantity of water used for agriculture is really worth the expense. Sector-wise consumption of water in 2006 was Agriculture 58 percent, amenities 7 percent, industry 1.5 percent, domestic 15.5 percent and forestry 18 percent. The agriculture sector is heavily subsidised by the government and the number of private farms that have been established has increased by 26 percent. But the government insists that valuable fresh water can be used for other sources since the ground water level has reduced to an alarming extent. Drinking water will remain a constant challenge for Dubai.
Dubai consumed 24,756 gigawatts of power in 2007 and the yearly increase is 15 percent. Most of the energy is obtained by thermal power stations. The state is exploring alternate energy forms such as solar and wind turbines. With the massive growth planned for the future, Dubai will need to provide a large amount of power for the industrial zones and other areas that are planned for the future. This will present certain issues since thermal power stations would increase pollution and consuming diesel for power generation would prove expensive. UAE is exploring harnessing nuclear power to provide power for future needs but considering the dangerous nature of nuclear power and the geographical proximity of the zone to terrorist areas, the proposal would require intense lobbying (Zawya, 2008).
Business incubators
In addition to creating infrastructure for foreign investors, Dubai also has many programs to finance and develop small and medium enterprises (SMEs). Funds such as the Khalifa Fund are designed to help small entrepreneurs with zero interest finance up to 1 million AED and low interest loans for projects more than 1 million AED, subject to a maximum of 3 million AED. In addition to providing loans, the fund also provides training, business consultancy to the applicant. The funds are meant for nationals of the Emirates who may be fresh graduates or those who have worked for some time and wish to venture out on their own. These measures would also help to lessen the workforce in public sector units that are largely overstaffed.
About 115 SMEs have been financed by these schemes and the strategy is to develop a set of entrepreneurs who would one day be able to utilise the large infrastructure projects that are planned (UAE Interact (b), 2008).
Sports City
The Dubai Sports City is estimated to cost 4 billion USD and offers facilities for indoor and outdoor stadiums that would seat about 100,000 spectators. The complex is to help the Dubai government in its bid for the 2016 Olympics. The complex will offer a place for sports academies that would provide training, sports rehabilitation and accommodation for a variety of athletic and other sports such as cricket, football, basketball, golf, rugby, and hockey. The centre is built to conform to Olympic standards and has swimming pools, gymnasiums, tracks of different types and would also serve as a centre for large events. In addition, the area would also be provided with residential spaces, hotels, shopping malls and other venues for entertainment and shopping (DSC, 25 September 2008).
Leveraging key assets
The previous sections have extensively dealt with the infrastructure that Dubai has planned and is in the process of implementing. The activities would have to be analysed with reference to SWOT analysis and Porter’s National Diamond Model of the Competitive Advantage of Nations (Porter, 1990). Use of these tools provides a better analysis of the economic and business conditions and helps to bring the existing conditions to the fore.
Dubai SWOT Analysis
A top view analysis of the strengths, weaknesses, opportunities and threats (SWOT) to Dubai in relation to the economy and business potential is given below. The objective of using the SWOT tool is to assess the competitive advantage of Dubai and to assist in understanding the potential for eCommerce. The observations are derived from the “Dubai in World Competitiveness 2005” repository and chapters used include ‘competitiveness policy framework for Dubai’ and ‘Dubai in world competitiveness’ (IMD, 2005).
The main points that have emerged from the SWOT analysis are that Dubai has excellent infrastructure for trade and investment and the GDP is expected to grow at 12 percent. However, there is a high import level that consumes earnings and there is a danger that, with a very high level of foreign workers who send their money home, the economy could slide deeper into the negative.
More detail relating to the SWOT analysis is provided below:
Strength
- Dubai has moved away from dependence on oil. Contributions to the GDP from other sectors are: services sector 65 percent, Industry 34 percent and agriculture 1 percent. Services sector include areas such as trading, transport, financial and non-financial services, real estate and business services, government services, construction, restaurants and hotels. The non-financial sector contributes 83.1 percent, financial 9.7 percent, the government and households’ sector 7.2 percent and construction 13 percent.
- There is a consistent GDP growth of 12 percent over the previous five years and GDP per capita is 28,125 USD. This indicates a stable and growing economy.
- Foreign Direct Investments (FDIs) are increasing and, with 2 billion USD or 7.7 percent of the GDP, this indicate that foreign countries find Dubai attractive. Investor-friendly policies and lower corporate taxes have encouraged multinationals to set up offices.
- Tourism has increased and contributed 4.8 billion USD in 2004. A number of free trade zones and ports are available.
- Low unemployment rate of less than 1.7 percent.
Weakness
- Current Account Balance as a percentage of GDP has a deficit of 9.9 billion USD and the current account deficit is about 33 percent of the GDP. This is mainly because of the huge influx of foreign workers who send money back to their native countries.
- Balance of Trade deficit is 6.3 billion USD and this is 114 percent of the GDP. This is a very unhealthy situation as the country relies very heavily on imports and is subjected to global inflation with rising prices in local markets.
- Dubai still subscribes to the Islamic laws and in some areas, alcohol consumption is prohibited and women face restrictions in how they dress. This deters Western tourists.
- The government sector has a high number of local employees and is considered as inefficient. Steps to privatise these enterprises have been discussed
- Native Arabs have not earned a reputation for efficiency and innovation. The state depends mainly on foreign workers to manage business.
- There are no companies that manufacture cars or textile industries and only trading is done. There are no plants such as steel, cement and other infrastructure plants.
- Dubai is investing very heavily for the future. The large scale of construction and the Dubai World projects would cause a massive drain on the GDP. Its present growth model is based on future expectancies that may not be realised. If the future economy moves to another zone, such as China or even Africa, then Dubai would have thousands of square meters of deserted cities.
Opportunities
- Dubai is making use of its strategic location to serve as a hub for the Arab world. It can act as a gateway to the Arab world when the supply of oil is exhausted.
- Local population can be educated and trained to assume technical skills
Threats
- Dubai would face competition from other states such as Kuwait, Abu Dhabi and Sharjah.
- Other cities such as Tripoli are developing very fast and their countries have oil resources that are controlled by Western countries.
- The construction activity is funded by debt and trade and re exports of goods manufactured in other regions. Once these other regions and countries start exporting, re-export would hit barriers.
- With a high level of imports, the GDP would be increasingly used to feed the population and with earnings being sent outside by foreign workers, the cash reserves would one day go into the negative.
Porters Diamond Framework
The framework attempts to analyse the competitive advantage of nations based on four factors, shown below, and would project the extent of competition that a nation can withstand when it enters the international market as a seller and producer of goods. The figure below illustrates the framework. According to Porter, understanding these factors would help Dubai to know where it stands in the world, who the competitors are and thee strategy that can be used to leverage its assets (Porter, 1990). The four factors are factor conditions, firm structure and rivalry, demand conditions and related and supporting industries. Please refer to Figure 2.1.2. Porter’s National Diamond Framework that illustrates the framework.
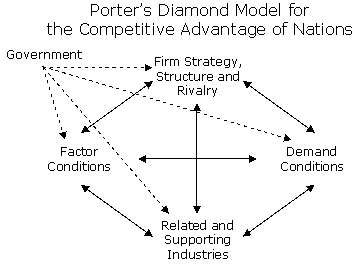
The framework is built on four main components and these are in turn driven by government policies. The four components are analysed as below.
Government: The Dubai government has adopted very pro-development policies with reference to promoting growth in the non oil sector. It has constructed many FEZ and introduced many schemes that reduce the tax burden and fixed costs for industries by providing them with incentives and tax concessions. So the score is positive in this factor.
Factor Conditions: Porter has pointed out that there are two factors, home grown resources and highly specialised resources. Home grown resources are items such as natural resources, raw materials and semi skilled resources and these can be acquired with the right amount of effort. Natural resources are globally acquired from developing or underdeveloped countries and some examples are minerals, crude oil, and timber. Availability of these resources in regions does not lead to competitive advantage as this factor can be replicated. As an example Japan is at the forefront of technology, yet it imports almost all its raw materials. The factor of highly specialised resources is important and this refers to the skilled labour, capital and infrastructure and intellectual property. While Dubai has ample capital, it lacks home grown or native talent. The skilled labour and intellectual property can be acquired by allowing an influx of foreign workers who would be willing to make Dubai their second home, provided the right kind of inducements were given. UAE has a long history of using foreign workers to run its infrastructure and industries but an issue remains in that much of those workers’ earnings do not remain in Dubai. This is an issue that Dubai has to accept in the short term. So the score is positive in this factor.
Related and Supporting industries: This factor refers to the setting up of clusters of supporting industry that act as feeder mechanisms for a mother industry. For example, an automobile manufacturing company such as Ford would require the support of hundreds of vendors and ancillaries. But with globalisation, this factor becomes diluted since components manufactured in one continent are assembled in a car plant in another country. But with the development of FEZs and structuring them according to the needs of the core industries, this factor can be accommodated. So the score is positive in this factor.
Firm Strategy, Structure and Rivalry: This is a very important factor when it comes to analysing Dubai. While the other factors analyse the strength of a nation with the market demands, this factor analyses the strength of the business rivals. Considering Dubai as a firm, its main rivals are China, Taiwan, Korea, India and other countries that use low cost labour to mass produce products such as textiles, apparel, small and big electronic items and other low cost-high volume products. If Dubai were allowed to be successful, the market share would essentially be derived from what these countries are producing. Given this, countries such as China and India would have to essentially remain stagnant and allow Dubai to eat into their business and market share. This does not seem likely. Moreover with imported and expensive labour, absence of natural resources, the cost factor would eventually become high for operators in the FEZ. Dubai presents a big market so the score is negative in this factor.
However, considering that the Dubai Government has set a mission to become the trading hub for the Middle East, the state has to leverage its key assets and prepare for the time when it would run out of oil revenues. The key assets of Dubai are its strategic geographic location that allows it access to the vast middle east and African markets, an experience in using skilled and unskilled foreign workers, a capacity to invest massive funds, backing of the powerful Arab community and the good will and positive image it has nurtured through the years.
The next section focuses on cultural traits of Dubai that encourage the growth of trade. It also analyses technology adoption theories and methodologies that explain the patterns of adoption in the developing world and the use of eServices across the globe. Finally, it analyses how eServices can be used in Dubai.
This next section provides an extensive review of cultural traits in Dubai and the UAE, and examines how that culture accepts change, new technology and the inhibitors and accelerators that exist for accepting change agents. The concept of systemic change along with a discussion on the movement and behaviour of social groups from the agrarian age to the industrial age and then to the information age has also been presented. Some case studies of how developing countries have fared with ICT adoption are discussed and the lessons learned from each case have been presented. Finally, a mapping of the lessons learned against Dubai’s development strategy is presented in order to assess Dubai’s readiness for adoption of ICT and other changes
Dubai Cultural Traits
Hofstede (2002) defines culture as “the collective programming of the mind which distinguishes the members of one human group from others”. The psychologist argues that culture cannot be termed as the personal baggage of an individual but belongs to groups. In many countries, cultural boundaries often are the same as the geographical boundaries and people from a nation would be stereotyped by their culture. Walsham (2002) speaks of culture as a “dynamic entity that is all inclusive and it is impossible to freeze in order to analyse it”. Ho Chi Minh, the father of Vietnam had defined culture as “for survival and for the purpose of life, mankind created and invented languages, script, ethics, laws, science, religion, literature, art, daily tools for clothing, dwelling and made use of the. All of those creations and inventions constitute culture” (Pham, 2003). Culture is seen as something that a person is born with and carries until the end. It is culture that plays a very significant role in determining how a nation or a social group behaves. A forward-looking culture means one that the culture is ready to accept new challenges and opportunities along with the risk factors. A traditional culture means one that is more risk averse and not ready to accept changes.
Hosftead (1991, 1994), Jan Trompenaars (2002), Kluckhohn (1962) have published considerable works on culture and how traditional commerce has been instigated and engaged by culture. Kluckholn (1962) points out that there are three typical ages: Agrarian, Industrial and Knowledge. It could be argued that HH Sheik Mohammed wishes to take his country straight through to the information age in a far shorter time frame than was enjoyed by Europe or the USA.
Hofstede’s Cultural Dimensions of UAE
Hofstede (2003) has created a framework to assess different natural cultures and the framework can be used to understand and predict the behaviour of cultures over a time period. The cultural framework has been used by industries and organisations over the world to understand how people from different cultures are expected to behave. Hofstede conducted research among a large number of IBM employees and the study covered about 70 countries. He identified five primary dimensions Power Distance – PDI, Masculinity – MAS, Individualism – IDV, Uncertainty Avoidance – UAI and Long-Term Orientation – LTO and each dimension was given an index value on a 1 to 100 scale. The indices can be used to assess and predict the national culture and behaviour, but not to assess an individual. A brief analysis of the dimensions and Hofstede’s scores are explained below.
Dubai has become a cosmopolitan city with about 80% of the population from other countries who form the workforce. Including these groups in the analysis would create disparity since people from India or UK would have different culture and a different rating for the indices., Only natural Arab citizens of UAE were considered for Hofstede’s analysis. This analysis is very important when creating a framework for the cultural aspects of Dubai and it would have an impact on the thesis objectives (Hofstede, 1991).
Power Distance Index – PDI
This index gives importance to the degree of inequality or equality among different strata of a nation. The index for UAE is 80 and the high value indicates that there is a high prevalence of inequality of wealth and power in the Emirates. The USA has a score of 40 (Hofstede, 2003). When the index is high then it means that there are various groupings in the country based on the caste system and wealth and power is distributed among a few elite. Upward mobility of the lower classes is hindered and strict laws, rules and a strict authority that specifies what is allowed and what is not, govern the society. Such societies have a leader who is prone to be isolated and distant. He would not be mixing with people, fearing that his image would be diluted. Dubai has a monarch that is the supreme leader of the state and his word is law. Consequently, the population obeys any declarations and edicts issued explicitly (Hofstede, 1994).
Individualism Index – IDV
This index gives importance to the relationship that is reinforced by society collectively or by individuals. The UAE has a low score of 38 while the USA has an index of 92. The UAE can be regarded as a collective society (Hofstede, 2003). In a collective society, the culture creates strong bonds among different classes of society and for people with IDV at 38, it means the word ‘us’, ‘we’ ‘our’ acquires more importance than ‘I’ and ‘mine’. Such cultures typically have joint and extended families that live together and unquestioning loyalty to the group is expected and given. The groups formed are very cohesive with strong bonds. There would be senior members in the household, such as grandparents, who would be regarded as honoured members and command a lot of discipline and obedience from the younger generation.
Collective society was the accepted way of life in all societies of the world from the ancient civilisations to the pre-modern world. Given the uncertainties of life in ancient times, people felt more comfortable with people of their own group who they could trust and with whom they could hunt, trade and live peacefully. This also gave rise to clans. Elderly members of a family with the knowledge gained from their long life were always around to offer worldly advice to their children and grand children (Hofstede, 1991).
But with industrial revolution, the societal norms were changed and in Britain and other countries, the young and the fit that could work in factories, left their villages and settled in the industrial towns. Theirs was a life of hardship with meagre food and un healthy living conditions. The old and the elderly were left in the villages and the settlements in cities were filled with nuclear families with single or two parents and their children (O’Brien, 1993). This is an important aspect when analysing the culture of Dubai where the UAE nationals did not have to go to other cities and countries in search of work. So, in effect, the nuclear family’s concept cannot be applied to Dubai as most citizens have lived their whole life in one of the Emirates with their parents and grandparents. As such, these people have very strong and traditional values and cultures and bindings to their social group, hence the low score of 38 for IDV (Hofstede, 1994).
Masculinity Index – MAS
This index focuses on the role and power of women in a society and how they are treated. UAE has a score of 52 while the average scores for all countries covered in the Hofstede ratings are 50 and the USA has a sore of 72 (Hofstede, 2003). This score can be interpreted as indicating that women in UAE share equal power with men. As such, the culture of Dubai is neither feminine (caring), or masculine (harsh) as traditionally, women have been regarded as more compassionate and caring than men. The analysis refers to the perception of women in society and while women may not be represented in positions of power in the government, the score indicates that there is not much gender differentiation. The conventional image, as depicted in the media, is that the Arab nations and the UAE dominate and subjugate women. The score of 52 indicates otherwise. As a corollary, the score indicates that women are not aggressive or eager to emulate men. The USA, where discrimination on grounds of gender, race or religion is not allowed, surprisingly has a score of 72. This indicates that gender differentiators are very strong and women increasingly aspire for positions of power in that society (Hofstede, 1991).
Uncertainty Avoidance Index – UAI
This index gives importance to the amount of tolerance that a society shows for ambiguity and uncertainty. The UAE had a score of 68 while the USA has a score of 46 (Hofstede, 2003). The index indicates that UAE culture does not like uncertainty in their life and there is a strong dislike for ambiguity. People from such cultures would feel more comfortable if they are subjected to rules, regulations and laws that specify what is acceptable and what is not. The score also shows that the culture and society has strong governance that ensures that the people have a steady and stable life. Such societies are not willing to change, avoids risks and there are inherent barriers to any new concepts of life and technology. Changes are regarded with trepidation. The low score of 46 for the USA indicates that their society is ready to accept changes and would undertake risks (Hofstede, 1994).
But there is a positive side when UAI is compared with PDI. The combination indicates that while UAE people are risk averse and not ready to accept changes and new technology, they are ready to accept rules and changes in technology if the government and the monarchy shows its support. This is exactly what is happening in Dubai as presented in Section 2.2, where the government has invested in the future by setting up FEZs, ICT infrastructure and other development projects (Hofstede, 1991). There is the question of foreign workers that have come to Dubai and these people have come with the main intention of earning high wages and making use of the opportunities that the government would provide/ They have come of their free will and it is expected that they will certainly adopt the new technology.
Joint analysis of the indices
When all the indices are considered together, it can be seen that UAE and Dubai has a collectivist culture that is separated by discrete social classes, is risk averse, avoids change and new technology, the people like to obey authority and rules and accept what the government says. There is a great dependence on the monarchy, which remains isolated and does not mix with the people and that has formed a controlled society. Barriers to adopting changes and technology exist but they would disappear if the government endorsed these changes.
Understanding Systemic Change
Bronowoski (1974), in the BBC series and book, ‘The ascent of man’ has very strikingly depicted the evolution of man from being a nomad hunter to the farmer, the city builder and technology creator. He speaks of change as the driving force in which man, animals and plants had to adapt and accept or face extinction. In many instances, change was forced on living things in the form of ice ages or climate change. Human civilisations changed due to the activities of raiders or depletion of resources. One point that the author reinforces is that “change is inevitable, one has to adapt to changes or perish and it is a survival of the fittest”. Toffler (1970) speaks of how society has changed and is undergoing a great level of structural change, evolving from being an industrial society to a super industrial society. The changes that come in will overwhelm cultures and people and those who cannot accept them would be subjected to future shock. In short, the storm of change would not be short-lived but is continuous and there is no place to hide and weather the storm. Kuhn (1962) first used the term paradigm shift to denote “a change in basic assumptions within the ruling theory of science, which is a revolutionary science or implication of technology”.
These authors wrote their works in the early 1960’s and 1970’s when the concept of change and development was limited to agricultural and industrialisation ages and they could not foresee the Internet, which did not exist in those days. With the Internet, a new paradigm has evolved to create the Information age.
Reigeluth (1997) differentiates changes into piecemeal change and systemic change. Piecemeal change is tinkering with a technology to modify it and it is essentially the same technology with some parts modified for extra functionality. Systemic change on the other hand involves system wide changes in which a technology is totally changed or a new one is developed. This is the paradigm shift that Kuhn spoke of more than three decades earlier. Systemic change creates its own market space, often uprooting existing technology. It offers products that never existed before. For example, the invention of gun powder ‘that allowed projectiles to be fired to great distance, many furlongs farther than a man could cast a spear’; the internal combustion engine that powered automobiles, the airplane that allowed us to fly; the space ships that allowed us to enter deep space created huge systemic change. The Internet is the latest example of such change.
Movement from Agrarian to Industrial society
The movement from the agrarian age to the industrial through to the information age, as outlined in this and the following section identify how societies have moved from different ages such as the agrarian age, industrial age and to the information age. As the discussion would show, the movement has not always been without trauma and there is a great learning that people have undergone. While it took other countries thousands of years to move from one age to another, Dubai would attempt this leap in a couple of decades and this could be best done by understanding how people coped with change. The two sections would also have a bearing on technology adoption that is discussed in section 2.3.
Ashton (1998) has written about the paradigm shifts in England where the industrial revolution uprooted the British culture and norms and in a short span of 50 years, centuries of the Agrarian society was changed into an industrial one. While changes in society have occurred since ancient times, the changes were gradual and took centuries to impact the farmer in a rural farm. But the industrial revolution ‘had a great urgency and allowed no time for people to adapt to the changed circumstance’ and for many families this was very traumatic. “Overnight, farmhands left their homes and left the old and the sick and abandoned the fields and moved to the great city slums to work in fetid and unhealthy factories where the only certainty was death, either by overwork, by accident, by starvation or by disease”. Yet people came in ever-larger number because the decades before the industrial revolution had been very severe and people wanted to escape the grinding poverty and moved to the cities. The British government in their greed or short sight only collaborated with the factory owners and no succour was extended to the factory worker. This is the paradigm shift from agriculture to the industrial society. But this happened more than two centuries back and it would be expected that new paradigm shifts would be better managed in the modern world. But this is really not the case.
China being a communist country, it is expected that this would be a workers paradise and collective bargaining with extreme powers given to labour unions would be the norm. The problem with China’s labour is that there is a twin parallel economy, the organised sector and the unorganised sector. The organised sector is what the west sees and the workers here are better paid than others, have acceptable working conditions and all other such facilities that western countries and companies demand. When western countries source their products, they place demands about the condition of the factory, safe working environment and processes that have lesser pollution and emissions and factory owners set up what are called as ‘front offices’. But if the Chinese factory were to obey these conditions then his profit margins would drop, as the increased costs would mean lesser profits. So to get over this problem, these factory owners operate what are termed as ‘shadow factories’. These are units that often operate illegally in squalid and unhygienic conditions and where workers are treated worse than animals. These sweat shops provide the maximum output for the factory owner who then claim that the production was actually from the approved workplaces. Such practices are never accounted for and estimates of workers employed in these shadow factories is many times more than the neatly uniformed workers who work in the front offices and the plight of the workers in the shadow offices is very bad. Those working with hazardous chemicals often work without protective shoes and gloves and often stand or wade through toxic chemicals that eat away the skin and cause ulcers and sores. Workers who toil in the thousands of apparel factories are made to sit in tight and airless factories and suffer from constant respiratory problems. But the level of skills required here are often minimal and the workers are often immigrants who have left their farms in search of work in the cities. Since they are illiterate and do not know their way around or are even aware of workers rights, they make the perfect and willing victims of the growing Chinese economy. These workers often work for more than 18 hours per day, even on weekends and it is only disease or accidents that would make them stop from working (Liu, October 2004).
The previous paragraphs have attempted to highlight the differences and paradigm shifts and systemic changes from the Agrarian society to the industrial society. In both the events discussed, existing social norms were broken down and people adopted a new culture. The next section will discuss the movement into the information age.
Movement to Information Age – The Paradigm Shift
The information age brought a new paradigm shift in the way that people worked, interacted and lived and terms such as networking, knowledge society, digital divide and others came into common use. Friedman (2005), speaks of 10 events or forces in the post modern era of the 1980s that have triggered wide spread changes in the way companies and economies operated and prospered. These forces served to flatten the world and this means that the forces served to remove barriers to technology and knowledge and connected the whole world, effectively bridging the chasm that divided countries and people. The connected world that exists now was unthinkable a few years back.
The 10 forces that brought these changes, Friedman argues, were: 1. Fall of the Berlin Wall; 2. Netscape goes public, 3. Work Flow Software that allowed collaborative sharing of online documents; 4. Open-Sourcing where free open source code applications were available; 5. Outsourcing where an organisations business functions and processes were outsourced; 6. Off shoring where companies from one country set up development cells in another country to better serve the customers; 7. Supply Chaining, where efficient and lean supply chains moved goods produced in one continent to another; 8. In sourcing where external agencies worked inside an organisation to look after its work processes, 9. In-forming, where people loaded vast content and information on the Internet and 10. The Steroids, where applications such as Internet Telephony, VoIP, IRC Chat and Messenger applications that have reduced the cost and speed of one to one communication and have served to flatten the world further.
The term ‘Information Society’ was first coined by Machlup (1962) who stated that “knowledge is a large and an increasing component in US economic activity and that this knowledge affects the productivity of the factors of production and that the effects of such knowledge can be identified and measured by analysing the appropriate industries and occupation”. The author identified five sectors of knowledge: research and development; information services; education; information technologies; and mass media. Machlup outlined these traditional kernels of knowledge and argued that a paradigm shift occurs when information is made available to all those who seek it, not just the elite few. When Machlup wrote his work, print media was the main mode of disseminating knowledge. Now the Internet has become the main source of information.
Castells (2004), writes of the Internet as a technology that removes the barriers to information flow between individuals, the state, financial information, entertainment, and commerce at the personal and organisation level. Organisations, cultures and entities that do not include themselves in this flow ‘miss the boat’ and are left out of the mainstream.
Fuchs (2008) looks at the phenomenon of information and knowledge as ‘information capitalism’ and knowledge and information as a tradable community. Creation, transfer and application of knowledge occur around certain information network nodes and the pace at which these nodes are created, stagnate or disappear is increasing rapidly.
This has given rise to a new sector of companies that deal only with helping organisations to build the information networks. These are called ICT companies. These companies can be set up very fast, can order the required computers and computer applications almost instantly, set up the networks by just plugging into the broadband network and what is most important, begin to function within hours and relocate at the same rate. If today, Ford or Toyota were to set up a plant in a new location, the activity would take months if not years. But if Microsoft were to set up an office and development centre in the same place, it can do so in hours.
Kadapa (2006) has written about the IT industry in India and the manner in which Indian IT companies manage their knowledge. He points out that with a vast global workforce that operates around the clock, servicing clients in different countries, understanding, managing and dissemination of knowledge within the organisation becomes a challenge. The Indian IT companies have set up knowledge management practices that function to gather the collective learnings of employees who work in different projects and this represents the vital intellectual capital of the company. The collective knowledge includes source codes, case studies, trouble-shooting tips, business proposals and many other artefacts. When this knowledge is documented and hosted on the knowledge management website, it can be made available to other employees. The result is a considerable shortening of the learning curve and new employees are able to learn from others, very quickly. This is the paradigm shift that ICT has achieved: portability; speed; and re-application of knowledge.
Womack (1990) traces the unique practices that Toyota initiated after the Second World War to increase productivity. These practices represent the first instances of knowledge management in Japanese companies. The Toyota pattern has been repeated in a number of Japanese companies. So what has made Japanese companies so successful in a wide variety of industries ranging from automotive to electronics? What is the secret to the competitive advantage that these companies have? Drucker (1981, 1999) tried to provide answers to these questions first by discarding the concepts of oriental philosophy and Zen that were supposed to explain the Japanese resilience. The author suggested that the main secret lay in sharing best practices in the form of implicit and tacit knowledge and information among the employees and diffusing it to the people who need it. A rigorous mindset, good knowledge of mechanical and electrical engineering that existed from the pre war days and the insight to apply it effectively helped the country to go forward. By extensively reading the works of the author, it is obvious that he is explaining a culture where knowledge is continuously being recycled and redistributed.
The previous paragraphs have underlined the societal changes and changes in the manner in which people interacted, from the agrarian society to the industrial society and now to the information society. The following table represents the paradigm shift in society.
Table 2.2.1. Paradigm Shifts in Society
As seen in the above table, the shifts in agrarian, industrial and information society have been shown for indicators of transportation, family, business and education. The previous discussion in paradigm shifts in society has also highlighted some changes between the industrial and information age and these are given in the following table.
Table 2.2.2. Changes in the industrial and information age
As seen in the above table, the industrial age comprised bureaucratic and autocratic leadership and used a top down pyramid structure. It was focussed on one-way communication that used centralised control and autocracy with representative democracy and expected compliance while producing mass-produced goods. The information age on the other hand is flat and networked, offers autonomy with accountability, believes in team play, and practices diversity with shared leadership and building cooperative relationships while offering customised products. A point to be noted is that information age practices are not only used by ICT companies but also by ‘bricks and mortar’ companies such as Toyota, Lufthansa, and British Petroleum.
Implications for Dubai
The previous section has discussed the concept of paradigm shift and examined the important features of societal changed from the agrarian age through to the industrial age to the information age. There are certain major implications for Dubai here, as the government is attempting to move the country from the industrial age directly to the information age. As discussed in Section 2.1.8, the government has planned massive infrastructure projects and there are plans for overall development of industries, financial sectors and the ICT sector. The people of Dubai have been put on a high-speed bus on the ICT expressway, with no stops. People have to either get on the bus and enter the new information age or be left out and remain in the industrial age. The government is planning a change strategy in a manner that is inclusive and one that would be less traumatic. The younger generation of Emirate citizens need to embrace the strategy, use the acquired knowledge of the Internet to shorten the learning curve and prepare themselves to become part of a vast information society.
Adaptation and Adoption of technology in developing countries
While ICT is an accepted way of life in developed countries, it acquires a different meaning in developing countries of Asia, Africa and South America. Before beginning this section it is important to note that although Dubai and the UAE are classified as developing, they are not ‘poor developing’ countries like Bangladesh or Botswana. Dubai has a GDP growth of 12% over the previous five years and GDP per capita is 28,125 USD. But in spite of the high GDP, Dubai is not regarded as developed or advanced mainly because their revenues depend on crude oil export and the distribution of wealth is disproportionate. As per the International Monetary Fund country groupings, UAE and Dubai are regarded as “other Emerging Market and Developing Countries” (IMF, April 2007).
The next sections will discuss the role of ICT and economic growth. It will also examine a few case studies on ICT and its impact in developing countries.
ICT and Economic Growth
Unsworth (2003) equates poverty and backwardness with lack of access to information and posits “the poor remain poor not because they have chosen to be like this but because they lack education and information that would help them to learn new skills or make use of their existing skills”.
ICT is regarded as a driver for growth with potential to combat poverty and encourage sustainable development. SMEs in many developing countries have stagnated because of lack of growth opportunities. This is essentially because they have very poor access to knowledge and information, reducing the capacity of these firms to compete with the international players. With poor information, SMEs have no way to understand the market potential and needs beyond their immediate society. Year after year, the poor farmer would be forced to buy at exorbitant interest rates and prices from the same seller and sell at cheap rates to the same buyer, who is often the same entity. In addition, in developing countries, the SME is forced to use the services of a middleman who gets his own percentage from every deal and regulates all information flow and opportunities. Such incidents lead to an information black hole from which the poor are not able to crawl out. Globalisation often has a minimal impact at the regional level in developing countries. These societies do not have the ability or capability to harness the opportunities and processes that come up as they are not in the mainstream of development. As a result, weaker and less economically developed countries, particularly with no natural resources such as minerals or crude oil, are often not able to enter into negotiations with international parties. When information flow is poor and outdated, there is no advance knowledge of the services, rights and opportunities and all too often, the aid that trickles down is further diluted by corruption and misappropriation of funds. When the poor marginal farmer who lives on micro land holdings does not have information about new crop varieties, new techniques of farming, new markets that would be willing to buy the products, new pesticides and livestock farming methods, then the farmer would be doing what his ancestors did and he would never get out of the debt trap (McNamara, 2003).
Tambo (2003) speaks of the importance of using ICT as a strategic tool to combat poverty and backwardness. However, he cautions against the mindset that ICT is a magic wand and can remove poverty of a nation. It has the potential to address the problems of poor communication and gives the opportunity to breach the barriers created by inefficient government machinery. Even if people are not immediately able to make use of the available information, the very fact of its availability is a initial trigger point and their awareness rises accordingly.
The impact of ICT and the long term effects it has on developing countries has received much debate. There have been failures as well success in the anticipated results of ICT. There are also questions about the ICT beneficiaries; whether new economies have increased the divide and provided cover to only the social elite while the socially and economically backward still remain where they are. The next sections provide some case studies of ICT applications in developing countries.
ICT Development in Vietnam
Nguyen (2008) has recently presented a case study on ICT development in Vietnam. His study gives special reference to the cultural barriers of accepting a new technology and the desire of the government to transform the country into a knowledge society. Nguyen conducted research using a three-phase study in which an empirical study with interviews conducted with 132 official interviewees and a model for development of a model for a knowledge society was developed.
The author argues that for a society to be termed a knowledge society, it needs to have two main characteristics: critical body knowledge and body mass with adequate knowledge repositories; and an ICT structure that can leverage the assets. A knowledge society is more than an information society; it is a society built on shared knowledge. The whole nation has to benefit from the advantages that a knowledge society can give.
On the surface Vietnamese culture appears to be homogenous, yet there is a vast ethnic, geographic and religious diversity. The country has a very strong agriculture base, providing employment to 75% of the people and since prehistoric times, the society has been agrarian. Vietnamese culture gives a lot of importance to ancestors and the elderly and, in this context, it is similar to Dubai and the UAE where elders are held in great respect. After a series of wars almost polarised the country, Vietnam has embraced globalisation with the Doi Moi process. There are now a number of changes observed in government policies and strategies for development, improved agricultural methods. The economy has changed for the better with agriculture showing a growth of 5.5 percent annual growth (Nguyen, 2008).
The interviews conducted by Nguyen suggest that there is a clash of cultural values with modern development. He states that there is a ‘maelstrom of uncertainty and conflicting behaviours in Vietnam where tradition often confronts risk and change’. The author points out that the clash and uncertainty has been mainly because of rapid urbanisation; variances in the external markets that created and destroyed wealth; increase numbers of rural poor who are kept out of the development projects; adoption of new values that threaten the old cultural values; outdated education methods and avoidance of law (Nguyen, 2008).
A few incidents are presented by Nguyen to illustrate the distrust surrounding ICT and globalisation in Vietnam. This case is important when the factor of technology adoption is concerned. As discussed in Section 2.2.1.4. Uncertainty Avoidance Index, UAE has a score of 46, almost the same as Veitnam that has an index of 47. There are similarities in the cutlure with reference to changes that technology adoption would bring in. These changes could deal with the culture. Business outlook and the society. Since Vietnam experienced certain traumatic effects due to globalisation, the cases is discussed here as it would help us in learning what impacts technology and globalisation would have. In 2002, the country exported large amounts of shrimp and catfish to the USA and these products were preferred by US consumers over the local US products. This created a large backlash as US producers protested that Vietnam farmers were lowering their prices because of the subsidies given to them by their governments. US producers lobbied to impose an import tariff of 64% on products from Vietnam. This resulted in a huge drop in demand for products from Vietnam and threatened the livelihood of more than 100,000 catfish farmers, many of whom had borrowed heavily to finance their produce. The inputs for the Vietnam farmers came from implementation of ICT infrastructure that showed them the opportunities and methods to achieve growth. But the end result was not anticipated and the farmers were left with a huge loss of opportunity and market. It must also be pointed out that Asian countries often use excessive pesticides and fertilisers to make the plants yield more. In many cases, the toxic substances find their way into aquaculture, fruits or flowers that are to be sold. The US and European markets enforce very strict levels for the amount of toxic substances allowed in food products. There is a very good chance that if after repeated detection of toxic contents beyond the permissible level, imports would be banned. The introduction of ICT and urbanisation has created a huge requirement for land and the only land available is often fertile land traditionally used for farming. Farmers often give up their traditional farmland and obtain some compensation before going to live in urban dwellings. While their living standard has undergone a huge change, they do not have any education or training that would enable them to make a living. This phenomenon has created a huge problem with millions of farmers rendered without a living and the government has not made any plans to rehabilitate them. The knowledge economy has created sharp and steep divide between the knowledge workers that have a lot of new found wealth and flaunt it; and the poor in the mountain regions where about 90% of the people live on less than a dollar a day. To make ends meet, the poor have taken up anti social activities such as smuggling, drug running, pornography, sex and prostitution and other such ill effects along with corruption and these developments threaten the moral and cultural fabric of Vietnam. (Nguyen, 2008).
Lessons Learned:
- ICT implementation along with globalisation should cover all sections of the society
- When poor farmers and SMEs attempt to enter the global market for trade and export, it should be made clear to them that the global market is open, vicious and subject to sudden upheavals.
- When farming land is used for ICT development there should be a strategy to rehabilitate and train the poor whose lands and farms have been taken up.
ICT Development in Thailand
Sanzogni (2008) recently presented a case study on ICT implementation problems faced by the Bangkok Investment Corporation (BIC) while implementing ICT in Thailand. The case highlights the grass-root problems that organisations and countries face when they attempt to bring in new technologies and concepts without adequate training of the workforce. According to the author, there are five issues that impacted the implementation of ICT, in this case, CRM applications. These are:
- Unreliable telecommunication infrastructure and technology
- Unreliable services and technical support;
- Inadequate technical knowledge and lesser level of skills among the workforce;
- Communication barriers between the local contractors and employees and the foreign managers
- The national culture that tends to influence these factors.
The education system in Thailand, according to the author does not impart any critical thinking skills. The ICT sector depends mainly on foreign workers who may not reveal all they know to the local workers. This ‘creates a spiral of perpetual dependence’. Almost 90% of BIC staff members are from western countries and the customers services staff are also foreigners. Almost the same conditions exist in Dubai.
The business model required very heavy use of the Internet and over the years as the number of staff and business grew, the company expanded to multi location units. Connectivity between the units, as well as with the external network, thus became a primary business need. The business faced problems due to five main causes and these are:
- Inadequate telephone line maintenance and administration that leads to frequent downtime of the Internet;
- Local ISP providers do not have any inclination to honour the service level agreements they make with their customers and they often resort to false and misleading advertisements;
- Lack of education, skill sets and knowledge among the local employees who do not understand the importance of the organisation’s business model and goals
- lack of a sufficient pool of skilled local talent that could be absorbed into the company;
- Lack of English skills that made it difficult for the local workers to understand the guides, books and documentation provided by the company
- Different communication styles between the locals and the foreign workers (Sanzogni, 2008).
The above points are specific issues that the company faced while earlier, a general mention of broad issues were mentioned. As a result of the five issues, the company had to scale back its expansion operations. As a consequence, they suffered loss of business and opportunities and potential customers were attracted to competing organisations based in other countries.
The following lessons emerge from the case:
- There should be adequate support for ICT in the form of infrastructure, Internet connectivity, and the availability of bandwidth assured on a 24×7 basis.
- If locals are to be hired, then they should be sufficiently trained with both on-the-job training and theoretical training. The extent and depth of orientation would depend on the nature of the work expected from the employees.
- If ICT implementation and development is taken as a national strategy of growth, then there should be training and education at the grass-root level. This should be the responsibility of the government.
- Contractors and vendors should be made aware of the importance of adhering to contracts and service level agreements. They should be made aware that non-compliance or misguiding customers is an offence punishable by law.
- English remains the most common language for businesses and government should undertake programs to ensure that children are taught sufficient English language skills.
- Foreign companies that want to set up offices in developing countries should give sufficient attention to local cultures, customs and ‘backwardness’ of the local people who may not be as advanced as expected.
ICT and Electronic Commerce in India
Tarafdar (2004) has written about ICT and eCommerce adoption in India and the great success that Indian IT companies have achieved. The study analysed 18 Indian companies from 11 industries that adopted eCommerce. It examined different factors related to the environmental and strategic imperatives. About 100 employees in these companies were interviewed to determine their perceptions and views about computer adoption. cCommerce activity in the country had grown to about 275 million USD by 2002 and it is estimated that by 2010, the Indian IT industry would be worth about 100 billion USD.
The study points out three important conditions dimensions that can accelerate adoption of eCommerce. These are: external environment: organisational performance: and compulsions that the internal management faced. Compulsions refer to the internal pressure exerted by the top management to introduce computers. The author reports that economic liberalisation started in the 1990s when many foreign companies were allowed to open their units and a number of foreign-owned assembly and manufacturing plants were established. These companies brought in the best practices and the latest business models that were built using current IT systems. Indian companies became aware of the advantages that adoption of IT systems would give them.
Although India has achieved the status of having some of the best IT companies, the country is still developing. Approximately 70 percent of India’s poor live in rural areas and the disorganised agriculture sector gives employment to about 67 percent of the people. Tarafdar’s study high-lighted the three dimensions mentioned earlier that lead tofor the huge growth of ICT and these are illustrated in the following figure.
As seen in the figure, Dimension 1 is made up of a number of drivers that have lead to the adoption of ICT. Dimension 2 explains the change imperatives in the firms that were created by the drivers of Dimension 1. While Dimension 3 identifies the implications when ICT and eCommerce were adopted. An important point to note is that an organisation can be a company that has taken up business activities. It can also be a country or region that is involved in business activities for profit or for social growth of its people. The dimensions are briefly explained below.
Dimension 1: According to Tarafdar (2004), there are three drivers that make an organisation to take up ICT and eCommerce. Driver 1 relates to changes in the external environment, including political, economic, customer preferences, technological. These would invariably undermine the competitive advantage and position of the organisation. Driver 2 is related to the organisational performance, including severe changes in the market share, profits, revenues and other business imperatives. Driver 3 is related to the internal factors, such as the proactive organisation initiatives that are designed to make the business successful.
Dimension 1 refers then to the changes that the company must face to survive. If the company does not accept these drivers, then there is a possibility that the business may become nonviable and be forced to shut down. While many public sector organisations that function under the protection of the government may choose to ignore these drivers at their own peril, private organisations do not have this luxury.
Dimension 2: As pointed out by Tarafdar (2004), the drivers from Dimension 1 force a number of change imperatives in the organisation and these are shown in Dimension 2. The impact of the drivers could lead to enhancing activities of individuals by either re-engineering the internal process or through restructuring the organisation. Some organisations may even take up development of new products to face the changes brought by the competitive position. The new product is designed to enhance the value proposition. The change imperative may also include product innovation or setting up new trends in process development, adopting best practices and innovative technologies to meet the goals of business strategies. To a certain extent, these change imperatives are voluntary and a company can either take up the new recommendations or ignore them. By taking up a strategic change management program, the firm is able to enter the flow of the new economy. By ignoring the changes, it would remain stranded in its place and ultimately collapse. These imperatives are in line with what has been discussed in the earlier sections about how changes forced man and living things to evolve.
Indian IT companies have mastered the skill of managing change. Wipro is regarded as one of the leading IT companies in India and the world. Initially selling cooking and edible oil, it later made Dot Matrix printers and computer hardware. Recognising the changes taking place in the world, the company ventured into developing IT solutions and is now one of the leading global IT services providers. Incidentally, sister units of Wipro still sell cooking oil and some units still sell Dot Matrix printers.
Dimension 3: Tarafdar (2004) has described a number of instances of ICT and eCommerce adoption and different types of functional areas and processes. These adoption incidents would essentially happen after the company has accepted the drivers from Dimension 1 and adopted some of the change imperatives given in Dimension 2. ICT can be adopted for the distribution of products, financial services, engineering and consumer goods, services and other areas. It can also be used for redesign of the customer relationship management process and the product distribution process, as well as linking the products to the organisation and the suppliers to create the supply chain management. It can also lead to giving support for the business innovation strategy that the company may bring in with ICT and eCommerce.
To a large extent, the three dimensions, the change imperatives and the implications for adopting ICT and eCommerce are relevant to an organisation, a country, and the individual. Individuals make up an organisation and the social culture and organisations create the nation. If any group misses out on these concepts, then they would be left out of the mainstream development flow and languish where they are. Barriers of culture and tradition in the adoption of technology and a failure to recognise change agents can only certainly be detrimental to economic growth.
The case study presented by Tarafdar (2004) is very pertinent to the thesis, as the lessons learned would have wide implications for Dubai. In summary:
- Organisations, cultures, countries and individuals, collectively called entities, are faced with a number of drivers over which they have no control. The drivers are related to the external environment, organisational performance and internal factors. These forces would tend to exert and act as change agents and entities have to recognise them, take corrective action or perish.
- Depending on the change drivers, certain change imperatives are forced on the entities and the entities would have to recognise these change imperatives and take the required action. Some of the change imperatives are: strengthening of the individual activities through internal restructuring, developing or modifying new products, changing the value proposition of the products and services offered and adopting innovative business strategies.
- Implications for adoption of ICT and eCommerce practices refer to areas or departments in the organisation that could use ICT and eCommerce. These are in areas of product design, distribution and supply chain management, customer relation management, redesign of the processes, support of product process and business innovation and in the engineering and internal processes.
- The study of Indian companies shows that their value proposition increased along with their competitive position after they adopted ICT and eCommerce. Value proposition refers to the increase in value of am organisation after some changes have been implemented and this may refer to additional capacity, specialised services, reduced throughput time, reduction in rejection, etc.
Measuring the impact of IT implementation benefits in Namibia
Lubbe (2000) has presented an interesting case of measuring the impact of IT implementation in Namibia. The country is regarded as poor and developing and while IT has been implemented in a few areas and industries, there are other priorities for the nation. The question of evaluating benefits of IT are often asked and this case has been considered because it has addressed this issue. The author has quoted a number of sources to indicate that all IT investment decisions are problematic as the IT community is reluctant to submit itself to evaluation of the investments. The unwillingness may be because of the lack of tools and models used for evaluation. Conventional tools used for asset valuation cannot be used here as the costs and benefits associated with computer systems are difficult to quantify. Growth areas are focused on hardware, software, applications, diffusion of IT, increase in end-user development and users and increase in IS managerial practices. There are also a number of factors that encourage the growth of IT and these include relative advantage, competitive pressure, consultant support, managerial time, economic factors and technical factors. The main motivating factor for IT development often comes from the owner who wishes to acquire computers to run and manage the business.
Since understanding the benefits of IT implementation is measured against the cost, a brief discussion is provided to know how cost benefit analysis is carried out. Lubbe (2000) outlines some appraisal methods that can be used for evaluation of IT benefits. These include the cost-benefit analysis, return on investment, payback, internal rate of return and the net present value. But while these give a measure of the accounting indicators, there are lesser chances of measuring the intangible benefits. Lubbe highlights why measuring the impact of IT is so difficult. These include: definition and tracking of IT related costs is too narrow and only limited to the software and hardware costs. Managers are reluctant to include costs such as consumables, power, use of floor space and others and want these costs to be passed on to the end-user department. Tracking of IT expenses is done as per the budgets sanctioned, there are no return on investment (ROI) calculations and there is a tendency to include hardware as an asset expense. This reduces the cost impact of the variable cost. There is also a tendency for departments and managers to acquire computers more as a status symbol rather than as a productive tool. Lubbe argues that when the cost of IT implementation and the tracking systems used for cost benefit analysis is flawed, the cost assessment of impact of IT will be in error.
The above case has highlighted a few important factors to be used to asses the impact of ICT. These are:
- There should be a system that properly tracks the costs of IT implementation. Without reliable cost estimates, it is difficult to judge the cost to benefit analysis results.
- ROI calculations for IT investments may be difficult since it is not always possible to estimate the income obtained from IT investment. There are certain intangible benefits such as the ability to retrieve information as and when needed, share information between different departments and organisations, track the productivity and reduce the time of delivery.
- The IT system has to converge and align with the organisation objectives.
Mapping the Lessons Learned with the Dubai Development Plan
The five case studies that have been analysed above have provided some important learnings. A mapping of these lessons learned has been developed against Dubai’s planned ICT and development infrastructure strategies. This mapping is presented in the table below.
Table 2.2.3. Mapping Lessons Learned to Dubai
The mapping undertaken indicates that Dubai is well-positioned, has the right strategy, as well as the right mix of pro-growth culture and infrastructure development, to face the challenges that ICT adoption and globalisation would offer.
eCommerce analysis within Dubai
Introduction
The objective of the current study was to determine which demographic factors predicted actual internet use, as well as the intent to use the internet in the future. In line with this, the following hypotheses were developed:
- Gender, age, level of education, region where last school was located, region of citizenship, household income, and industry type would be related to actual time spent banking through the internet in 2005.
- Gender, age, level of education, region where last school was located, region of citizenship, household income, and industry type would be related to the intent to use the internet in the year 2005 and beyond.
- Year started internet use, gender, age, level of education, region where last school was located, region of citizenship, household income, and industry type would be related to actual internet use in the year 2008.
- Year started internet use, gender, age, level of education; region where last school was located, region of citizenship, household income, and industry type would be related to actual hours of overall internet use in 2008.
- Year started e-banking use, gender, age, level of education; region where last school was located, region of citizenship, household income, industry type, and start of internet use would be related to the intent to bank through the internet in 2008.
- The relationship between gender, age, level of education, region where last school was located, region of citizenship, household income, and industry type on the one hand, and internet use, on the other, would vary across time, such as between 2005 to 2008.
- The relationship between gender, age, level of education, region where last school was located, region of citizenship, household income, and industry type on the one hand, and intent to shop on the internet in the future, on the other, would vary across time.
To test the hypotheses pertaining to intent as well as the other binary dependent variables, logistic regression procedures were conducted. A significance level of.05 was specified for the Wald statistic. To test the hypotheses relating to time and amount spent on the internet, univariate analysis of variance (ANOVA) procedures were donefollowed. A significance level of.05 was specified for the omnibus model. Tukey’s HSD post-hoc comparisons were done conducted when the omnibus model F was statistically significant.
In the current chapter, the results for the 2005 sample will first be presented, followed by. Following that, the results for the 2008 sample results.will be described. Thereafter, the r Results comparing the two samples will then be detailed.
The Relationship between Demographics and Internet Use in 2005
Descriptive Statistics
The frequencies and percentages for the predictor variables of the study are presented in Table 2. As indicated, slightly more males than females responded to the survey (55.7%). The majority of the respondents fell between the ages of 25 to 44 (69.5%). Half of the sample had a post-graduate degree (50%) while about a third had a Bachelors degree (33.1%). The majority of the respondents were educated in the West (71.7%) and were citizens of Western countries (66.1%). The majority of the respondents had annual household incomes between US$100,000 to US$250,000.
Table 2 – Frequencies and Percentages for Predictor Variables (N = 357)
The frequencies and percentages for the binary criterion variables of the study are presented in Table 3. As can be gleaned from the table, all the respondents reported using the internet to some degree. The majority used the internet to shop (79.8%) and to bank (80.1%). Most of the respondents also indicated that they would use the internet to shop in the future (88.5%) and to bank (83.5%).
The means and standard deviations for the criterion variables measured on an interval scale are presented in Table 4. The findings indicate that skew values for three of the variables were not within the acceptable range of positive and negative 1. Thus, the variables were transformed using a square root transformation. These variables were used in consequent analyses.
Table 3 – Frequencies and Percentages for Binary Criterion Variables (N = 357)
Table 4 – Descriptive Statistics for Criterion Variables (N = 357)
Independent Variable Definitions
The relationships of gender, age, educational level, income, region of last school, region of citizenship, and type of industry on various measures of internet use were assessed. Although age initially had six categories, the first two categories were collapsed into a single cell (because of the low number of respondents per cell). Similarly, the last two categories were grouped together. Thus, the new age variable had four categories. Educational level initially had five categories. The first two categories were collapsed together and the last two categories were also grouped together, thus resulting in three levels. Income level had ten categories. The first four were grouped together; the fifth and sixth levels were combined; the seventh and eighth groups were collapsed into a single cell; and the ninth and tenth were joined together. This yielded four income levels altogether..
Overall Internet Use
The relationship between the seven independent variables and time spent on the internet was assessed using a univariate analysis of variance (ANOVA) procedure. The means and standard deviations for all the variables are presented In Table 5. The findings in Table 6 indicate that gender had a marginally significant relationship with number of hours spent on the internet (F (1,336) = 3.545, p =.061). Males spent significantly more time (M = 8.05) on the internet in comparison to females (M = 6.63).
As can be gleaned from the findings in Table 6, number of hours spent on the internet varied significantly across levels of education (F (3,336) = 3.106, p =.046). Post-hoc comparisons, however, did not yield any statistically significant pairwise comparisons.
Lastly, the findings in Table 6 reveal that region of citizenship was significantly related to number of hours spent on the internet (F (2,336) = 4.855, p =.008). Post-hoc analyses indicate that respondents who were citizens from Asian and African countries spent more time on the internet (M = 9.20) than respondents who were citizens of western countries (M = 6.75, p =.049).
The findings offer partial support for hypothesis 1a. In particular, gender, level of education, and region of citizenship were significantly related to overall internet use in 2005.
Table 5 – Means and Standard Deviations for Number of Hours Spent on the Internet (N = 357)
Table 6 – ANOVA Results for Number of Hours Spent on the Internet
E-Commerce
Purchased goods on the internet
The relationship between the seven independent variables and the purchase or non-purchase of goods on the internet was assessed through logistic regression tests. The overall model statistics are presented in Table 7 while the coefficients and odds ratios for each of the variables are presented in Table 8.
The findings in Table 8 reveal that gender significantly predicted the likelihood of purchasing goods on the internet (Wald = 4.855, p =.028). Males were.45 times more likely than females to purchase goods on the internet. Second, level of education significantly predicted the probability of purchasing goods on the internet (Wald = 10.367, p =.006). In particular, respondents with post-graduate degrees were 4.3 times more likely than respondents with a diploma to purchase goods on the internet (Wald = 6.075, p =.014). Third, region of citizenship was significantly related to purchase of goods on the internet (Wald = 6.087, p =.048). Specifically, citizens from western countries were 3.8 times more likely than citizens from the Middle East to purchase goods on the internet (Wald = 4.928, p =.026). Fourth, type of industry significantly predicted the likelihood of purchasing goods on the internet (Wald = 15.461, p =.004). Respondents who worked in computers and technology were 5.8 times more likely than respondents who were academics or educators to purchase goods on the internet (Wald = 12.259, p =.000).
The findings indicate partial support for hypothesis 1b. In particular, the variables, gender, level of education, region of citizenship, and type of industry, were significantly related to e-Commerce use in 2005.
Table 7 – Logistic Regression Model Summary for e-Commerce Use (N = 354)
Table 8 – Logistic Regression Coefficients and Odds Ratios for e-Commerce Use
Time spent purchasing goods
The relationship between the seven independent variables and time spent purchasing goods on the internet was assessed using a univariate analysis of variance (ANOVA) procedure. The means and standard deviations for all the variables are presented in Table 9. The findings in Table 10 indicate that gender had a significant relationship with number of hours spent purchasing goods on the internet (F (1,295) = 4.809, p =.029). Males spent significantly more time (M = 11.70) purchasing goods on the internet in comparison to females (M = 8.53).
As can be gleaned from the findings in Table 10, number of hours spent purchasing goods on the internet varied significantly across income levels (F (3,295) = 6.159, p =.000). Post-hoc comparisons indicate that the overall significant difference was due to the differences between three income levels. First, respondents who earned below 149,999 spent significantly less time purchasing goods on the internet (M = 7.48) than respondents who earned between 250,000 and 349,999 (M = 12.31; p =.001) and respondents who earned between 350,000 and 400,000 (M = 14.59; p =.000). Second, respondents who earned between 150,000 and 249,999 spent significantly less time purchasing goods on the internet (M = 9.87) than respondents who earned between 350,000 and 400,000 (p =.002).
Lastly, the findings in Table 10 reveal that region of last school attended was significantly related to number of hours spent on the internet (F (2,295) = 3.024, p =.050). Post-hoc analyses, however, did not yield any significant pairwise comparisons.
The findings offer partial support for hypothesis 1c. In particular, gender, income level, and region of last school attended were significantly related to time spent purchasing goods in the internet in 2005.
Table 9 – Means and Standard Deviations for Number of Hours Spent Purchasing Goods on the Internet (N = 315)
Table 10 – ANOVA Results for Number of Hours Spent Purchasing Goods on the Internet
Amount spent purchasing goods
The relationship between the seven independent variables and amount of money spent purchasing goods on the internet was assessed using a univariate analysis of variance (ANOVA) procedure. The means and standard deviations for all the variables are presented in Table 11. The findings in Table 12 indicate that age had a significant relationship with amount of money spent purchasing goods on the internet (F (1,293) = 3.602, p =.014). Post-hoc comparisons, however, did not yield any significant pairwise differences.
As can be gleaned from the findings in Table 12, the amount of money spent purchasing goods on the internet varied significantly across type of industry (F (4,293) = 2.990, p =.019). Again, post hoc comparisons did not yield any significant pairwise differences.
The findings offer partial support for hypothesis 1d. In particular, age and type of industry were significantly related to amount of money spent purchasing goods in the internet in 2005.
Table 11 – Means and Standard Deviations for Amount Spent Purchasing Goods on the Internet (N = 313)
Table 12 – ANOVA Results for Amount Spent Purchasing Goods on the Internet
Inhibitors for e-Commerce
The frequencies and percentages for potential inhibitors of e-Commerce use are described in Table 13. As indicated, respondents believed that security (16%), potential fraud (13.2%), and delivery issues (10.1%) were the primary reasons that inhibited them from purchasing goods on the internet.
Enablers for e-Commerce
The frequencies and percentages for potential enablers of e-Commerce use are described in Table 14. The findings reveal that respondents believed that better security (14.3%), better prices (13.4%), and availability of imported goods (13.2) were the primary reasons that enabled them to purchase goods on the internet.
Table 13 – Frequencies and Percentages for Inhibitors of e-Commerce (N = 357)
Table 14 – Frequencies and Percentages for Enablers of e-Commerce (N = 357)
E-Banking
Bank use
The relationship between the seven independent variables and the use or non-use of banking on the internet was assessed through logistic regression tests. The overall model statistics are presented in Table 14 while the coefficients and odds ratios for each of the variables are presented in Table 16.
The findings in Table 16 reveal that several factors significantly predicted the likelihood of banking on the internet. First, age significantly predicted the likelihood of banking on the internet (Wald = 13.596, p =.004). Respondents between the ages of 17 and 24 were.22 times more likely than respondents between the ages of 45 to 65 to bank on the internet (Wald = 4.656, p =.031). Second, level of education significantly predicted the probability of banking on the internet (Wald = 8.192, p =.017). In particular, respondents with post-graduate degrees were 4.7 times more likely than respondents with a diploma to bank on the internet (Wald = 6.380, p =.012). Third, type of industry was significantly related to banking on the internet (Wald = 11.755, p =.019). Respondents who worked in finance, business, or marketing were 3.86 times more likely than respondents who were academics or educators to bank on the internet (Wald = 5.832, p =.016). Respondents who worked in computers and technology were 5.8 times more likely than respondents who were academics or educators to bank on the internet (Wald = 11.380, p =.001).
The findings indicate partial support for hypothesis 1e. In particular, the variables, age, level of education, and type of industry, were significantly related to e-Banking use in 2005.
Table 15 – Logistic Regression Model Summary for e-Banking Use (N = 354)
Table 16 – Logistic Regression Coefficients and Odds Ratios for e-Banking Use
Time spent banking
The relationship between the seven independent variables and time spent banking on the internet was assessed using a univariate analysis of variance (ANOVA) procedure. The means and standard deviations for all the variables are presented in Table 17. The findings in Table 18 indicate that gender had a significant relationship with number of hours spent banking on the internet (F (1,273) = 3.300, p =.038). Males spent significantly more time (M = 8.79) banking on the internet in comparison to females (M = 6.42).
As can be gleaned from the findings in Table 18, number of hours spent banking on the internet varied significantly across region of citizenship (F (2,273) = 3.300, p =.038). Post-hoc comparisons indicate that respondents who were citizens from countries in the Middle East spent significantly more time banking on the internet (M = 10.07) than respondents who were citizens from countries in Asia and Africa (M = 6.42; p =.011).
The findings offer partial support for hypothesis 1f. In particular, region of citizenship was significantly related to time spent banking on the internet in 2005.
Table 17 – Means and Standard Deviations for Number of Hours Spent Banking on the Internet (N = 291)
Table 18 – ANOVA Results for Number of Hours Spent Banking on the Internet
Inhibitors for e-Banking
The frequencies and percentages for potential inhibitors of e-Banking use are described in Table 19. As can be gleaned from the table, respondents believed that security (13.4%) and potential fraud (12.3%) were the primary reasons that inhibited them from banking on the internet.
Enablers for e-Banking
The frequencies and percentages for potential enablers of e-Banking use are described in Table 20. The findings reveal that respondents believed that better use of time (14.8%), convenience (11.5%), and better security (10.4%) were the primary reasons that enabled them to bank on the internet.
Table 19 – Frequencies and Percentages for Inhibitors of e-Banking (N = 357)
Table 20 – Frequencies and Percentages for Enablers of e-Banking (N = 357)
The Relationship between Demographics and Intent to Use the Internet in the Future (as Specified in the Year 2005)
The frequencies and percentages for the binary criterion variable used to measure intent to shop in the future (as indicated in the year 2005) of the study are presented in Table 21. As can be gleaned from the table, most of the respondents indicated that they would use the internet to shop in the future (88.5%).
Table 21 – Frequencies and Percentages for Intent to Shop in the Future (N = 357)
The relationship between the seven independent variables and the intent to shop on the internet in the future was assessed through logistic regression tests. The overall model statistics are presented in Table 22, while the coefficients and odds ratios for each of the variables are presented in Table 23.
The findings in Table 23 reveal that several factors significantly predicted the likelihood of shopping on the internet in the future. First, level of education significantly predicted the probability of shopping on the internet in the future (Wald = 8.842, p =.012). In particular, respondents with post-graduate degrees were 6.1 times more likely than respondents with a diploma to indicate that they would shop on the internet in the future (Wald = 5.844, p =.016). Second, region of citizenship predicted the likelihood of shopping on the internet in the future (Wald = 16.645, p =.000). Respondents who were citizens from Asian countries were.11 times more likely than respondents who were citizens from countries in the Middle East to indicate that they would shop on the internet in the future (Wald = 4.645, p =.031). Third, type of industry was significantly related to shopping on the internet in the future (Wald = 18.418, p =.001). Respondents who worked in computers and technology were 21.55 times more likely than respondents who were academics or educators to indicate that they would shop on the internet in the future (Wald = 18.418, p =.000). Respondents who worked in other industries were 29.35 times more likely than respondents who were academics or educators to indicate that they would shop on the internet in the future (Wald = 6.131, p =.013).
The findings indicate partial support for hypothesis 2a. In particular, the variables – level of education, region of citizenship, and type of industry – were significantly related to shopping on the internet in the future.
Table 22 – Logistic Regression Model Summary for Shopping on the Internet in the Future (N = 354)
Table 23 – Logistic Regression Coefficients and Odds Ratios for Shopping on the Internet in the Future
The Relationship between Demographics and Internet Use in 2008
Descriptive Statistics
The frequencies and percentages for the predictor variables of the study are presented in Table 24. Slightly more males than females responded to the survey (55.8%). Majority of the respondents fell between the ages of 25 to 44 (66.9%). Almost half of the sample had a post-graduate degree (44.9%) while about a third had a Bachelors degree (34.9%). Majority of the respondents were educated in the West (58.9%) and were citizens of Western countries (49.2%). Half of the sample had annual household incomes between 150,000 and 499,999 (57.3%).
Table 24 – Frequencies and Percentages for Predictor Variables (N = 321)
The frequencies and percentages for the binary criterion variables of the study are presented in Table 25. As can be gleaned from the table, majority used the internet to shop (66.7%), to bank (65.1%), and to network (71%).
The means and standard deviations for the criterion variables measured on an interval scale are presented in Table 26. The findings indicate that skew values for three of the variables were not within the acceptable range of positive and negative 1; as such these variables were transformed using a square root transformation. These variables were used in consequent analyses.
Table 25 – Frequencies and Percentages for Binary Criterion Variables (N = 321)
Table 26 – Descriptive Statistics for Criterion Variables (N = 321)
Independent Variable Definitions
The relationships between the year respondents started internet use, gender, age, educational level, income, region of last school, region of citizenship, and type of industry on various measures of internet use were assessed. Although age initially had six categories, the first two categories were collapsed into a single cell (because of the low number of respondents per cell). Similarly, the last two categories were grouped together. Thus, the new age variable had four categories. Educational level initially had five categories. The first two were collapsed together and the last two categories were also grouped together. This resulted in three categories. Income level initially had ten categories. The first four were grouped together; the fifth and sixth were combined; the seventh and eighth groups were collapsed into a single cell; and the ninth and tenth were joined together. This yielded four income categories altogether.
Overall Internet Use
The relationship between the eight independent variables and time spent on the internet was assessed using a univariate analysis of variance (ANOVA) procedure. The means and standard deviations for all the variables are presented in Table 27. The findings in Table 28 indicate that the year the respondent started using the internet had a significant relationship with overall internet use (F (1,269) = 4.570, p =.033). Separate analyses indicate that the later respondents started using the internet, the more time they spent using the internet.
The findings offer partial support for hypothesis 3a. In particular, the year respondent started using the internet was significantly related to overall internet use in 2008.
Table 27 – Means and Standard Deviations for Number of Hours Spent on the Internet (N = 297)
Table 28 – ANOVA Results for Number of Hours Spent on the Internet
E-Commerce
Purchased goods on the internet
The relationship between the eight independent variables and the purchase or non-purchase of goods on the internet was assessed through logistic regression tests. The overall model statistics are presented in Table 29, while the coefficients and odds ratios for each of the variables are presented in Table 30.
The findings in Table 30 reveal that three factors significantly predicted the likelihood of purchasing goods on the internet. First, the year respondents started using e-Commerce significantly predicted the likelihood of purchasing goods on the internet. For every yearly delay in adopting e-Commerce, the likelihood that respondents would purchase goods on the internet increased by 1.28 (Wald = 12.340, p =.000). Second, age significantly predicted the probability of purchasing goods on the internet (Wald = 11.712, p =.008). Respondents between the ages of 25 and 34 were 6.9 times more likely than respondents between the ages of 17 to 24 to purchase goods on the internet (Wald = 11.491, p =.001). Respondents between the ages of 35 and 44 were 3.8 times more likely than respondents between the ages of 17 to 24 to purchase goods on the internet (Wald = 4.151, p =.042). Third, region of school last attended was significantly related to purchase of goods on the internet (Wald = 8.200, p =.017). Specifically, citizens from western countries were 4.3 times more likely than citizens from the Middle East to purchase goods on the internet (Wald = 5.623, p =.018).
The findings indicate partial support for hypothesis 3b. In particular, the year respondents started using e-Commerce, age, and region of school last attended were significantly related to e-Commerce use in 2005.
Table 29 – Logistic Regression Model Summary for e-Commerce Use (N = 261)
Table 30 – Logistic Regression Coefficients and Odds Ratios for e-Commerce Use
Time spent purchasing goods
The relationship between the eight independent variables and time spent purchasing goods on the internet was assessed using a univariate analysis of variance (ANOVA) procedure. The means and standard deviations for all the variables are presented in Table 31.
As can be gleaned from the findings in Table 32, number of hours spent purchasing goods on the internet varied significantly across levels of education (F (2,191) = 5.379, p =.005). Post-hoc comparisons indicate that respondents with a diploma spent significantly more time purchasing goods on the internet (M = 3.95) than respondents with a bachelors degree (M = 1.89; p =.003) and respondents with a post-graduate degree (M = 2.17; p =.008).
The findings offer partial support for hypothesis 3c. Level of education was significantly related to time spent purchasing goods in the internet in 2008.
Table 31 – Means and Standard Deviations for Number of Hours Spent Purchasing Goods on the Internet (N = 216)
Table 32 – ANOVA Results for Number of Hours Spent Purchasing Goods on the Internet
Amount of money spent purchasing goods
The relationship between the eight independent variables and the amount of money spent purchasing goods on the internet was assessed using a univariate analysis of variance (ANOVA) procedure. The means and standard deviations for all the variables are presented in Table 33. The findings in Table 34 indicate that none of the variables were significantly related to the amount of money spent purchasing goods on the internet. Thus, hypothesis 3d was not supported by the data.
Table 33 – Means and Standard Deviations for Amount Spent Purchasing Goods on the Internet (N = 211)
Table 34 – ANOVA Results for Amount Spent Purchasing Goods on the Internet
Inhibitors for e-Commerce
The means and standard deviations for inhibitors of e-Commerce use are described in Error! Reference source not found.. As can be gleaned from the table, respondents indicated that no desire to use the internet (M = 5.64) and lack of internet access (M = 5.44) inhibit them from purchasing goods on the internet.
Enablers for e-Commerce
The descriptive statistics for enablers of e-Commerce use are presented in Table 35. The findings reveal that respondents felt that having access to the internet at work (M = 3.07) and at home (M = 2.90) would enable them to purchase goods on the internet.
Table 35 – Means and Standard Deviations for Inhibitors of e-Commerce
Table 36 – Means and Standard Deviations for Enablers of e-Commerce
E-Banking
Bank use
The relationship between the eight independent variables and the use or non-use of banking on the internet was assessed through logistic regression tests. The overall model statistics are presented in Table 36, while the coefficients and odds ratios for each of the variables are presented in Table 37.
The findings in Table 37 reveal that the year respondents started using e-Banking significantly predicted the likelihood of banking on the internet. For every yearly delay in adopting e-Banking, the likelihood that respondents would bank on the internet increased by 1.42 (Wald = 16.600, p =.000). The findings indicate partial support for hypothesis 3e. Only the year respondents started to e-Bank was significantly related to e-Banking use in 2008.
Table 37 – Logistic Regression Model Summary for e-Banking Use (N = 242)
Table 38 – Logistic Regression Coefficients and Odds Ratios for e-Banking Use
Time spent banking
The relationship between the eight independent variables and time spent banking on the internet was assessed using a univariate analysis of variance (ANOVA) procedure. The means and standard deviations for all the variables are presented in Table 38. The findings in Table 39 indicate that none of the variables were significantly related to time spent banking on the internet in 2008. Accordingly, hypothesis 3f was not supported by the data.
Table 39 – Means and Standard Deviations for Number of Hours Spent Banking on the Internet (N = 210)
Table 40 – ANOVA Results for Number of Hours Spent Banking on the Internet
Inhibitors for e-Banking
The means and standard deviations for inhibitors of e-Banking use are described in Table 40. As can be gleaned from the table, respondents indicated that no desire to use the internet (M = 5.39) and lack of internet access (M = 5.07) inhibit them from banking on the internet.
Enablers for e-Banking
The descriptive statistics for enablers of e-Banking use are presented in Table 41. The findings reveal that respondents felt that having access to the internet at work (M = 2.96) and at home (M = 2.75) would enable them to bank on the internet.
Table 41 – Means and Standard Deviations for Inhibitors of e-Banking
Table 42 – Means and Standard Deviations for Enablers of e-Banking
Social Networking
Social networking use
The relationship between the seven independent variables and the use or non-use of social networking sites on the internet was assessed through logistic regression tests. The overall model statistics are presented in Table 42 while the coefficients and odds ratios for each of the variables are presented in Table 43.
The findings in Table 43 reveal that age significantly predicted networking through the internet (Wald = 10.612, p =.014). Respondents between the ages of 17 to 24 were.05 times more likely than respondents between the ages of 35 to 44 (Wald = 6.784, p =.099) and.07 times more likely than respondents between the ages of 45 to 65 to network on the internet (Wald = 4.481, p =.034).
Type of industry also significantly predicted social networking through the internet (Wald = 10.702, p =.030). Respondents who were in the academe were 4.56 times less likely than respondents who worked in the finance industry (Wald = 6.397, p =.011) and 4.67 times less likely than respondents who worked in the computer industry (Wald = 8.053, p =.005) to network on the internet.
The findings indicate partial support for hypothesis 3g. Age and type of industry were significantly related to networking on the internet.
Table 43 – Logistic Regression Model Summary for e-Networking Use (N = 285)
Table 44 – Logistic Regression Coefficients and Odds Ratios for e-Networking Use
Time spent banking
The relationship between the seven independent variables and time spent networking on the internet was assessed using a univariate analysis of variance (ANOVA) procedure. The means and standard deviations for all the variables are presented in Table 44. The findings in Table 45 indicate that none of the variables were significantly related to time spent networking on the internet in 2008. Accordingly, hypothesis 3h was not supported by the data.
Table 45 – Means and Standard Deviations for Number of Hours Spent Networking on the Internet (N = 236)
Table 46 – ANOVA Results for Number of Hours Spent Networking on the Internet
The Relationship between Demographics and Intent to Use the Internet in the Future (as Specified in the Year 2008)
The frequencies and percentages for the binary criterion variables used to measure future internet use (as indicated in the year 2008) are presented in Table 46. As can be gleaned from the table, most of the respondents indicated that they would use the internet to shop (72.6%) and bank (73.5%) in the future.
Table 47 – Frequencies and Percentages for Binary Variables Measuring Future Intent of Internet Use
Intent to Shop
The relationship between the eight independent variables and the intent to shop on the internet in the future was assessed through logistic regression tests. The overall model statistics are presented in Table 47 while the coefficients and odds ratios for each of the variables are presented in Table 48.
The findings in Table 48 reveal that several factors significantly predicted the likelihood of banking on the internet. First, the year respondents started using e-Commerce significantly predicted the likelihood of future shopping on the internet (Wald = 6.511, p =.011). For every yearly delay in adopting e-Commerce, the likelihood that respondents would shop on the internet in the future increased by 1.26.
Second, region of last school attended predicted the likelihood of shopping on the internet in the future (Wald = 10.887, p =.004). Respondents who attended school in the west were 12.4 times more likely than respondents who attended school in the Middle East to indicate that they would shop on the internet in the future (Wald = 10.515, p =.001).
The findings indicate partial support for hypothesis 4a. In particular, the year respondents started using e-Commerce and region of last school attended were significantly related to intent to shop on the internet in the future.
Table 48 – Logistic Regression Model Summary for Shopping on the Internet in the Future (N = 256)
Table 49 – Logistic Regression Coefficients and Odds Ratios for Shopping on the Internet in the Future
Intent to Bank
The relationship between the eight independent variables and the intent to bank on the internet in the future was assessed through logistic regression tests. The overall model statistics are presented in Table 49 while the coefficients and odds ratios for each of the variables are presented in Table 50.
The findings in Table 50 reveal that the year respondents started using e-Banking significantly predicted the likelihood of future banking on the internet (Wald = 5.574, p =.018). For every yearly delay in adopting e-Banking, the likelihood that respondents would bank on the internet in the future increased by 1.44. The findings indicate partial support for hypothesis 4b.
Table 50 – Logistic Regression Model Summary for Banking on the Internet in the Future (N = 246)
Table 51 – Logistic Regression Coefficients and Odds Ratios for Banking on the Internet in the Future
Comparison of Demographic Effects on Internet Use across the Years 2005 and 2008
The relationship between the seven independent variables and internet use across time was assessed using univariate analysis of variance (ANOVA) procedures and logistic regression procedures. Specifically, the interaction between year and the seven independent measures was assessed. Accordingly, only the main effect of year and the interaction effects between year and the seven dependent variables will be interpreted.
Overall Internet Use
The univariate ANOVA findings are presented in Table 51. As can be gleaned from the table, the number of hours spent using the internet did not vary significantly across years (F (1,606) =.083). The relationship between gender and number of hours spent using the internet, however, varied significantly across years (F (1,606) = 3.295, p =.038). The findings depicted in Figure 1 suggest that the difference in hours spent on the internet between males and females in 2005 was larger than the difference in hours spent on the internet between males and females in 2008.
The relationship between region of citizenship and number of hours spent using the internet also varied significantly across years (F (1,606) = 3.253, p =.039). The findings in Figure 2 indicate that the difference in hours spent on the internet between respondents who were citizens from Western countries and respondents who were citizens from the Middle East in 2005 was larger than the difference in hours spent on the internet between citizens from the West and from Middle East in 2008.
The findings indicate partial support for hypothesis 5a. The relationship between gender and number of hours spent on the internet, as well as the relationship between region of citizenship and number of hours spent on the internet varied across time.
Table 52 – ANOVA Results for Number of Hours Spent on the Internet
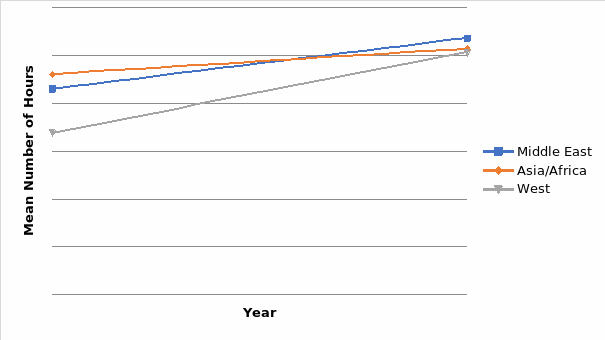
E-Commerce
Purchasing goods on the internet
The overall model statistics are presented in Table 52 while the coefficients and odds ratios for each of the variables are presented in Table 53. The findings in Table 53 indicate that year was not significantly related to purchasing goods on the internet (Wald = 2.164, p =.141). The relationship between level of education and purchasing goods on the internet, however, varied significantly across years (Wald = 6.287, p =.043). In particular, in 2005, respondents with a post-graduate degree were 4.3 times more likely than respondents with a diploma to purchase goods on the internet. In 2008, respondents with a post-graduate degree were only 1.04 times more likely than respondents with a diploma to purchase goods on the internet. Thus, the likelihood differences between these two groups varied across the years 2005 and 2008.
These findings partially support hypothesis 5b. The relationship between level of education and purchase of goods on the internet varied across time.
Table 53 – Logistic Regression Model Summary for Purchasing Goods on the Internet across Time (N = 615)
Table 54 – Logistic Regression Coefficients and Odds Ratios for Purchasing Goods on the Internet across Time
Time spent purchasing goods on the internet
The univariate ANOVA findings are presented in Table 54. As can be gleaned from the table, the number of hours spent purchasing goods on the internet varied significantly across years (F (1,519) = 62.351, p =.000). Respondents spent more time purchasing goods on the internet in 2008 (M = 2.79) in comparison to 2005 (M = 7.69).
These findings do not support hypothesis 5c. None of the relationships between the independent variables and number of hours spent purchasing goods on the internet varied across time.
Table 55 – ANOVA Results for Number of Hours Spent Purchasing Goods on the Internet
E-Banking
Banking on the internet
The overall model statistics are presented in Table 55 while the coefficients and odds ratios for each of the variables are presented in Table 56. The findings in Table 56 indicate that year was not significantly related to banking on the internet (Wald =.116, p =.734). The relationship between level of education and banking on the internet, however, varied marginally across years (Wald = 5.953, p =.051). In particular, in 2005, respondents with a post-graduate degree were 4.7 times more likely than respondents with a diploma to bank on the internet. In 2008, respondents with a post-graduate degree were only 1.9 times more likely than respondents with a diploma to bank on the internet. Thus, the likelihood differences between these two groups varied across the years 2005 and 2008.
These findings partially support hypothesis 5d. The relationship between level of education and banking on the internet varied across time.
Table 56 – Logistic Regression Model Summary for Banking on the Internet across Time (N = 600)
Table 57 – Logistic Regression Coefficients and Odds Ratios for Banking on the Internet across Time
Time spent banking on the internet
The univariate ANOVA findings are presented in Table 57. As can be gleaned from the table, the number of hours spent banking on the internet varied significantly across years (F (1,619) = 25.127, p =.000). Respondents spent more time banking on the internet in 2008 (M = 8.03) in comparison to 2005 (M = 2.99). In addition, the relationship between educational level and time spent banking on the internet varied across time (F (1,619) = 3.763, p =.024). The findings depicted in Figure 3 suggest that the difference in hours spent banking on the internet between respondents with diplomas and those with at least a bachelors degree in 2005 was smaller than the difference in hours spent banking on the internet between respondents with diplomas and those with at least a bachelors degree in 2008.
These findings partially support hypothesis 6a. The relationship between level of education and number of hours spent banking on the internet varied across time.
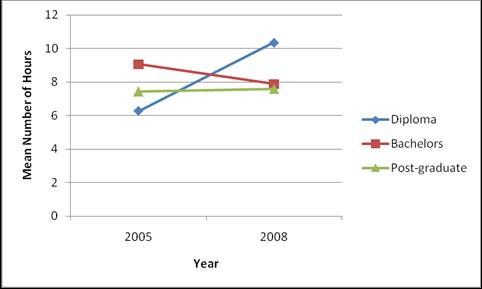
Table 58 – ANOVA Results for Number of Hours Spent Banking on the Internet
Intent to Shop on the Internet in the Future
The overall model statistics are presented in Table 58 while the coefficients and odds ratios for each of the variables are presented in Table 59. The findings in Table 59 indicate that year was marginally related to intent to shop on the internet (Wald = 3.639, p =.056). Respondents who answered the questionnaire in 2008 were 70.26 times more likely than respondents who answered the questionnaire in 2005 to indicate that they would shop on the internet in the future.
In addition, the relationship between region of school last attended and intent to shop on the internet in the future varied significantly across years (Wald = 9.334, p =.009). First, in 2005, respondents whose last school was located in Asia were.96 times more likely than respondents whose last school was located in the Middle East to indicate that they would shop on the internet in the future. In 2008, respondents whose last school was located in Asia were 1.38 times more likely than respondents whose last school was located in the Middle East to indicate that they would shop on the internet in the future (Wald = 7.910, p =.005). Second, in 2005, respondents whose last school was located in the west were.49 times more likely than respondents whose last school was located in the Middle East to indicate that they would shop on the internet in the future. In 2008, respondents whose last school was located in the west were 12.4 times more likely than respondents whose last school was located in the Middle East to indicate that they would shop on the internet in the future (Wald = 4.422, p =.035).
Further, the relationship between region of citizenship and intent to shop on the internet in the future varied significantly across years (Wald = 7.753, p =.035). In 2005, respondents who were citizens of western countries were 4.85 times more likely than respondents who were citizens of Middle Eastern countries to indicate that they would shop on the internet in the future. In 2008, respondents who were citizens of western countries were 1.26 times more likely than respondents who were citizens of Middle Eastern countries to indicate that they would shop on the internet in the future (Wald = 7.743, p =.005).
The relationship between industry type and intent to shop on the internet in the future also varied significantly across years (Wald = 9.758, p =.045). First, in 2005, respondents in the academe were 1.75 times less likely than respondents who were in the finance industry to indicate that they would shop in the internet in the future. In 2008, respondents in the academe were 3.64 times less likely than respondents who were in the finance industry to indicate that they would shop in the internet in the future (Wald = 4.392, p =.036). Second, in 2005, respondents in the academe were 21.55 times less likely than respondents who were in the computer and technology industry to indicate that they would shop in the internet in the future. In 2008, respondents in the academe were 3.25 times less likely than respondents who were in the computer and technology industry to indicate that they would shop in the internet in the future (Wald = 6.737, p =.009). Thus, the likelihood differences between the groups varied across the years 2005 and 2008.
These findings partially support hypothesis 6b. The relationship between region of school last attended, citizenship and industry type, on the one hand, and intent to shop on the internet in the future, varied across time.
Table 59 – Logistic Regression Model Summary for Intent to Shop on the Internet across Time (N = 610)
Table 60 – Logistic Regression Coefficients and Odds Ratios for Shopping on the Internet across Time
Summary of findings
A summary of the findings pertaining to the first and second hypotheses is presented in Table 61. As can be gleaned from the table, the first hypothesis was partially supported. Level of education and region of citizenship were significantly related to hours of overall use. Genders, level of education, region of citizenship, and type of industry were all related to eCommerce use. Gender, income level, and region of last school attended were related to number of hours spent shopping on the internet. Only age and industry type were significantly related to the amount of money spent on eCommerce. Age, level of education, and industry type significantly predicted the likelihood of banking on the internet. Gender and region of citizenship were significantly related to the number of hours spent eBanking.
Similarly, the second hypothesis was partially supported by the data. Level of education, region of citizenship, and industry type significantly predicted the likelihood of using the internet in the future (when respondents were asked in 2005).
Table 61 – Summary of Findings Pertaining to Hypotheses 1 and 2
A summary of the findings pertaining to the third and fourth hypotheses is presented in Table 62. As can be gleaned from the table, the third hypothesis was partially supported. The year the respondents started using the internet was significantly related to hours of overall use. Start year, age, and region of last school attended were related to eCommerce use. Only education was related to the number of hours spent shopping on the internet. Similarly, only start year significantly predicted the likelihood of banking on the internet. Age and industry type were related to eNetworking use.
The fourth hypothesis was partially supported by the data. Start year significantly predicted the likelihood of shopping and banking via the internet in the future (when respondents were asked in 2008).
Table 62 – Summary of Findings Pertaining to Hypotheses 3 and 4
A summary of the findings pertaining to the fifth and sixth hypotheses is presented in Table 63. As can be gleaned from the table, the fifth hypothesis was partially supported. The relationship between overall internet use and region of citizenship varied across years. Similarly the relationship between the likelihood of purchasing goods on the internet and level of education varied across the years. In addition, the relationship between the numbers of hours spent banking on the internet and level of education varied significantly across the years.
The sixth hypothesis was also partially supported by the data. The relationship between intent to shop in the future and region of last school attended, region of citizenship, and industry type varied across the years.
Table 63 – Summary of Findings Pertaining to Hypotheses 5 and 6
Apendices
Ajzen, I., and M. Fishbein. 1975. Belief, Attitude, Intention, and Behaviour: An Introduction to Theory and Research. Reading, MA: Addison-Wesley.
Al-Maktoum, M. B. R. Opening speech at Dubai Men’s College Inauguration. Dubai Men’s College Opening Ceremony, 2005.
Al-Maktoum, M. B. R. 2008. UAE. Web.
Anonymous. 2007. Dubai population makes big surge. Web.
Davis, F. D. 1989. Perceived usefulness, perceived ease of use, and user acceptance of information technology. MIS Quarterly 13 (3): 319-340.
El-Kady, N. 2005. Web shopping may struggle in UAE. 2008. Web.
Favier, J. 2007. Europe’s eCommerce Forecast: 2006 to 2011. Cambridge, MA: Forrester Research Inc.
Hofstede, G. 1991. Cultures and Organizations: Software of the Mind. London, UK: McGraw-Hill UK.
Hofstede, G. 1994. Cultures and Organizations: Intercultural Cooperation and Its Importance for Survival. London: Harper Collins UK.
Kaul, S. 2003. Computer Hacking: Potentially a New Kind of War, The Daily Star. 2008. Web.
Kluckholn, F., and F. L. Strodtbeck. 1961. Variations in Value OrientationsEvanston, IL: Row & Petersen.
Litan, A. 2005. Increased Phishing and online Attacks Cause Dip in Consumer Confidence, . New York, NY: Gartner Inc.
McCall, T. 2007. Phishing Attacks Escalated in 2007. Stamford, CT: Gartner Inc.
Mulpura, S., C. Johnson, B. McGowan, and S. Wright. 2008. US eCommerce Forecast: 2008 to 2012. Cambridge, MA: Forrester Research Inc.
Rahimi, S. 2008. Region behind in e-commerce due to poor marketing. Web.
Read, M. D. 2004. Middle Eastern Democracy and Islamic Tradition: The Application of Sharia in a Modern World. American University International Law Review 19 (3): 485-522.
Reigeluth, C. M., and R. J. Garfunkle. 1994. Systematic Change in Education. Englewood Cliffs, NJ: Educational Technology Publications.
Rogers, E. M. 1962. Diffusion of Innovations. New York, NY: The Free Press.
Sampler, J., and S. Eigner. 2003. Sand to Silicon: Achieving Rapid Growth Lessons from DubaiBungay: Profile Books.
Sengupta, J. 2008. Dubai Metro, on the right track. Web.
Sullivan, B. 2004 2 Million Bank Accounts Robbed. 2008. Web.
Thibodeau, P. 2001. Fed’s math is fuzzy on computer crime. Web.
Venkatesh, V., M. G. Morris, G. B. Davis, and F. D. Davis. 2003. User acceptance of information technology: Toward a unified view. MIS Quarterly 27 (3): 425-478.