Introduction
This paper presents data results as obtained after statistical evaluation of the effect of friendship on intimate relationships. It provides a detailed presentation and discussion of the results in light of the statistical outcomes obtained. It also presents the findings of hypothesis testing in light of the statistical relationship between the variables and the significance of these results. Additionally, it also presents a brief illustration of the effect of variables using correlation.
Data Review
The data used in this evaluation reflect the variables assessed including intimate relationships and friends. All the variables have complete data sets. Before analysis, descriptive statistics were developed to establish the distribution of the data. These included the establishment of the means and corresponding standard deviation. The results obtained show closeness of data as no large standard deviations were recorded.
Hypothesis formulation
This paper tests the relationship between intimacy and friendship. It is premised on the assumption that the level of intimacy between parties is influenced by their level of friendship. Based on this assumption, the following null and alternative hypotheses are developed. They are as follows:
H0: The level of intimacy is dependent on the level of friendship.
The alternative hypothesis is stated as follows;
H1: The level of intimacy is not dependent on the level of friendship.
A statistical equation developed to describe this relationship is described below (Tabachnick & Fidell, 2001):
![]()
![]()
![]()
![]()
![]()
Based on this model, the null hypothesis is expressed as:
![]()
And the alternative hypothesis is given by
![]()
![]()
Where:
k = number of variables
N = sample size
Then it was compared with the critical value F (.05; 2; n-2-1) to determine whether the null is accepted or rejected (Havlicek & Peterson, 1977). In addition, a power analysis examining the probability of having made a Type II error was conducted (Cohen, Cohen, West, & Aiken, 2003). First, the effect size was computed as follows:
![]()
To obtain the power estimates, the effect size was converted to a “non-centrality parameter (Maxwell, 2000)”:
![]()
Other than regression, the correlation of the variables is also computed based on the formula described below:
![]()
These squared partial correlations would have been used to describe the proportion of variance accounted for by these variables in mergers return on equity (ΔR²).
Regression and correlation are important approaches to the statistical evaluation of variable relationships (Maxwell, 2000). Correlation analysis is used to assess linear association closeness between two continuous variables. Correlation values always lie between –1 and +1 (Stevens, 2002). When the returned value is zero, it is concluded that the values evaluated are non-correlated. The level of significance is dependent on the r-value returned as well as the number of observations (n). The larger the value or r is, the stronger is the association between the variables (Wonnacott & Wonnacott, 1990).
Regression analysis on the other hand defines an equation that allows prediction of the effect of a variable(s) on another variable (Venables & Ripley, 1999). The dependent variable is normally plotted in the Y-axis while the independent variable is plotted in the X-axis. Other than predicting variable effects on other variables, it also estimates the dependence relationship (Weisberg, 1985).
Results
Syntax
GET FILE=’D:My WorkIN PROGRESSAssignmentGreenSalkindLesson 31Lesson 31 Data File 1.sav’. REGRESSION
/DESCRIPTIVES MEAN STDDEV CORR SIG N
/MISSING LISTWISE
/STATISTICS COEFF OUTS R ANOVA CHANGE ZPP
/CRITERIA=PIN (.05) POUT (.10)
/NOORIGIN /DEPENDENT intimate
/METHOD=ENTER friend.
The results displayed in this output translate as follows: r (6) =.552, p =.000. Recalling our null hypothesis, r <> 0, we affirm that there is a positive relationship between intimacy and friendship.
The research undertook to evaluate the effect of friendship on the level of intimacy. Friends are treated as the independent variable while intimate relationships represent the dependent variable.
The value of R and adjusted R squared obtained describe a perfect regression line fitting the models taking into consideration the predictor variables. This is affirmed by the + value obtained from regression analysis.
In an analysis of variance, the large F value indicates the significant ability of the model to predict the level of intimate relationships (Weisberg, 1985). By identifying the predictor and fitting the model, its predictive ability has been largely magnified. Additionally, given that the value is greater than 1, then the improvement due to the fitting of the models is largely greater than the model’s inaccuracies.
The output of the table above further illustrates the model’s parameters. The multiple regression models take an equation form containing co-efficient (b) for the predictors highlighted by the fitted model. This shows the relationship between the predictor variable (friends) and intimate relationships. Based on the table findings, the predictor shows a positive relationship between the predictor variable and the dependent variable. This indicates that as the values increase, so does the value of the dependent variable. This is indicated by the positive beta value.
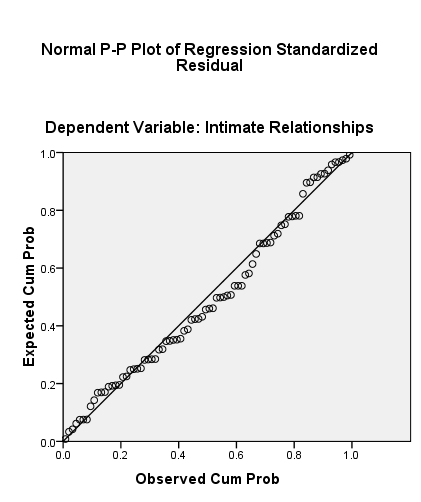
The normal probability plot generated further reveals a strong relationship between the variables evaluated (see fig. below)
Hypothesis Testing
Having gone through an analysis of statistical outputs obtained, this is compared against the earlier stated null hypothesis. The hypothesis was earlier expressed as follows:
![]()
, and the alternative hypothesis represented as
![]() .
.
Considering that the value or r squared obtained is.305, it satisfies the requirements of the null hypothesis, and as such the null hypothesis is accepted resulting in outright rejection of the alternative hypothesis. To further confirm acceptance of this hypothesis, a large positive f value is obtained. The findings are further confirmed by the r values obtained by the correlation output.
Conclusion
This paper utilized regression and correlation analysis to establish the relationship between friendship and intimate relationships. At the onset, it was stated that the null hypothesis would be accepted if the following condition was met:
![]()
If this condition, failed to be met, then the alternative hypothesis based on the following condition was to be upheld.
![]()
From the statistical output obtained, the conditions necessary for acceptance of the null hypothesis were met as the value of r squared obtained was.305. It is therefore concluded that friendship affects the level of intimacy in relationships. Regression and correlation aids in understanding how variables relate to each other. They are used to estimate how able variable(s) is able to predict another variable. As mentioned, correlation helps in establishing the strength of the relationship between the variables evaluated. However, in correlation, no variable is concluded as being able to predict the other. Unlike correlation, regression analysis involves the development of a predictive model where independent variable(s) are able to predict the dependent variable. In this paper, friendship is concluded as being a predicting factor for the level of intimate relationships recorded. It is important to mention that in bother regression and correlation, emphasis was placed on the magnitude. In regression analysis, further emphasis was directed to the regression’s predictive power and the statistical significance of the relationship between the variables. This has been successfully achieved in this paper’s analysis. Not only has a statistically significant relationship been obtained but the analysis has also been able to ascertain a positive relationship between the variables.
References
Cohen, J., Cohen, P., West, S. G., & Aiken, L. S. (2003). Applied multiple regression/correlation analysis for the behavioral sciences, 3rd Ed. Mahwah, NJ: Lawrence Erlbaum Associates.
Havlicek, L., & Peterson, N., (1977). Effects of the violation of assumptions upon significance levels of the Pearson r. Psychological Bulletin, 84, 373-377.
Maxwell, S. E. (2000). Sample size and multiple regression analysis. Psychological Methods, 5(4), 434-458.
Stevens, J. P. (2002). Applied multivariate statistics for the social sciences (4th ed.). Mahwah, NJ: Lawrence Erlbaum Associates.
Tabachnick, B. G., & Fidell, L. S. (2001). Using multivariate statistics (4th ed.). Needham Heights, MA: Allyn & Bacon.
Venables, W. & Ripley, B. (1999). Modern Applied Statistics with S-PLUS (3rd ed.). Springer.
Weisberg, S. (1985). Applied Linear Regression (2nd ed.). New York: Wiley.
Wonnacott, T. & Wonnacott, R. (1990). Introductory Statistics, 5th edition, Chichester: Wiley.