Literature Review

The theory of planned behavior is a model which was developed by Icek Aljzen, being a projection from another renowned theory in psychology, the theory of reasoned action. This theory explains the relationship that exists between attitudes and individuals’ behavior. It is one of the theories of persuasion and has found its application in many areas such as public relations, advertising, and healthcare. According to the theory of reasoned action, the attitude arises from the behavioral values while the subjective norm is the relative perspective by the society and this leads to motivation of the individual which is the intention of performing the task (Bandura 1997). The theory was developed to cover for the limitations of the reasoned action theory since in many situations the intentional behavior of an individual does not always amount to the actual behavior due to circumstantial limitations. This led to the introduction of the perceived behavioral control to cover for the shortcoming and thus boost the accuracy of predicting the actual behavior of an individual from the behavioral intentions. Moreover, the introduction of the perceived behavioral control is meant to enhance the estimation of the individual’s ability to measure up to a given behavior. This is borrowed from the theory of self-efficacy (Armitage & Conner 2001, p. 471).
The key concepts addressed by the theory are; a behavioral belief which can be defined as an individual’s probability towards the achievement of a given behavior and the attitude towards the behavior which can be either negative or positive and gives the measure in which an individual values a given set of behavior or the results emanating from the attributes (Ajzen & Fishbein 2005).
Normative believes are the influences towards behavior by the society which are very significant in the society such as relatives and friends while, on the other hand, subjective norms are those which depend on the pressures of the external environment where an individual is made to behave in a given manner in respect to others (Ajzen 1985). Another worth comparison is between the perceived behavior controls which result from cumulative factors governing the social beliefs and the availability of factors, which inhibit the performance of a given behavioral trait (Ajzen 1991). The willingness of an individual to behave in a given way or practice a given behavioral trait is the behavioral intention while the behavior is the individual’s reaction towards a given environmental factor (Sheppard, Hartwick & Warshaw 1988, p.325). There are three main sets of factors, which influence human behavior in different ways as shown in figure 1. Behavioral beliefs are the mothers of the attitude of an individual towards some practices (Sutton et al. 2000). Subjective believes results from the generally accepted codes in the society also known as norms. Finally, the perceived behavioral traits result from the control belief practices (Conover 1980).
It is the combination of all the above factors, which result in the formation of a behavioral intention. Therefore, a given behavioral facet does not only directly affect the preceding behavioral unit but also indirectly affects the presumed behavioral attitude. The performance of a given individual in some given spheres of behavior is greatly dependent on the strength of the individuals’ attitude towards the practice (Amjad & Wood 2009, p.514).
Sample profile
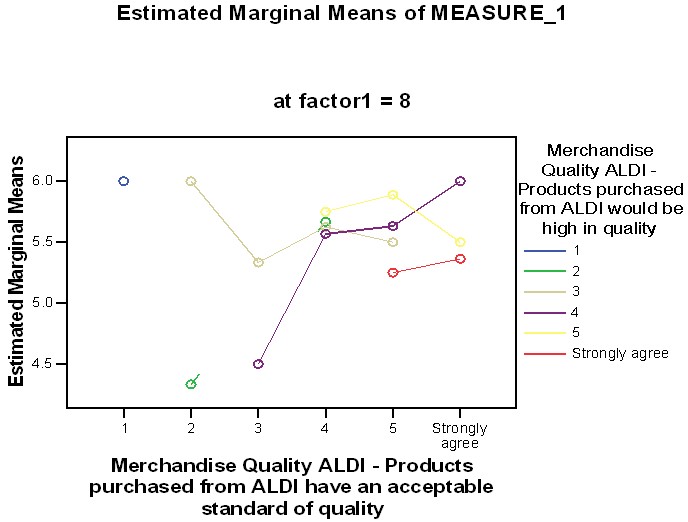
The graph shows the distribution of the data. The implication of the diagram above is that merchandise quality has a strong influence on the behavioral practices of individuals. This is seen by the concentration of the plots towards the most positive regions. This is a single sample of the other results from the ten outputs from the other variables indicating a similar distribution (Norman 1999, p.329).
Comparison of variables
The graph in figures 3, 4, 5, and 6 represents the distribution of the components of the theory of planned behavior across the two countries. The bar graphs are very categorical in describing the level of the influence of the factors in the overall behavior of the individuals in the countries. Figure 3 above shows that in the United Kingdom, the intention of the individual to buy ALDI displays a normal distribution where the maximum recorded rating is at the middle of the curve with a value of between four and six. On the other hand, in Germany, individuals are highly influenced by intention. This is clear from the graph where the highest number of individuals was definite that they will buy the commodity, ALDI (Ognjen 2005, p.1).
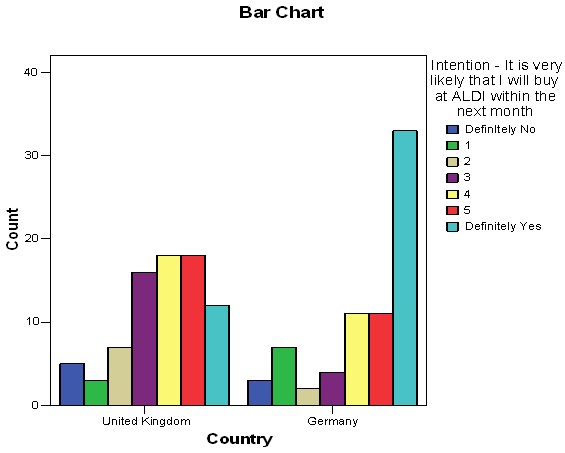
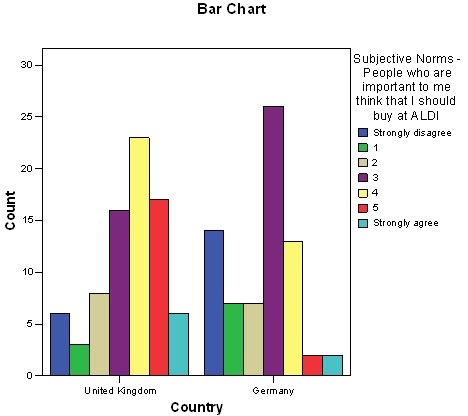
Figure 4 shows the distribution of the subjective norms with respect to the countries under study. The influence of the subjective norm on the individual’s decision to buy ALDI is described as shown above. In Germany, it shows that the highest numbers of individuals are moderately affected by the subjective norms with a maximum value rated at 4. The distribution is the same for the United Kingdom only that the maximum number of people recorded a value of 5. Generally, the effect of subjective norms on individuals’ decisions displays a normal distribution curve (Velicer & Jackson 1990, p.1).
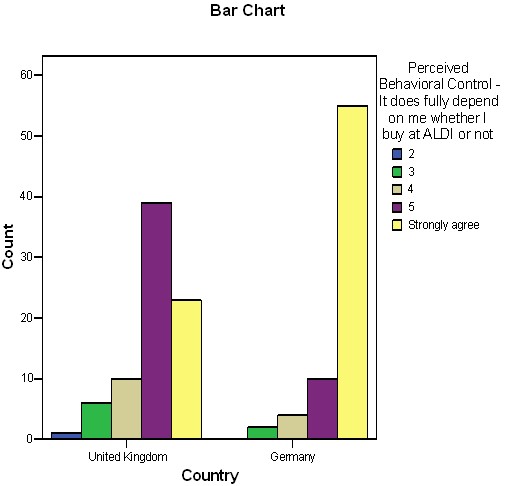
The effect of perceived behavioral factors on the individuals’ decision to buy ALDI is shown above. The distribution shows that the effect of the perceived norms is skewed to the highest level where the individuals strongly agree, it is their perceived behavior, which makes them decide to buy the commodity as compared to the other components of the theory of planned behavior (Cornell & Mulrow 1999).
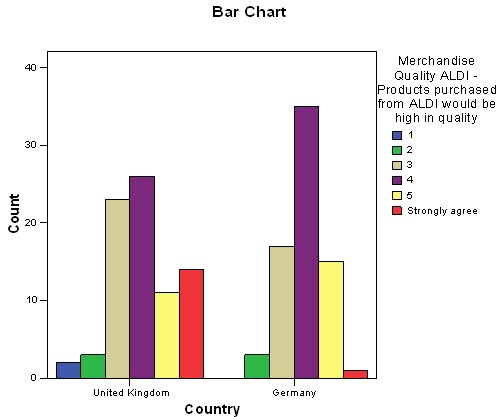
Merchandise quality is also a factor that influences the students’ behavior to purchase the commodity in the two countries as shown in figure 6 above. The distribution in the two countries shows a similar distribution with the maximum value of the influence rated at four in both cases. It shows that there is a substantial influence by the quality of the merchandise on the behavior of the individuals to buy the commodity (Cooper & Hedges 1994).
Regression studies

The above diagram shows the regression analysis on the components of the theory of planned behavior in the two countries. The analysis shows that there is a normal distribution with a mean of 8.15E-17 and a standard deviation of 0.99. The implication of the above distribution is that the influences of the individual’s behavior are at their peak at the middle of the value of the rating. This is typical data showing that there are fewer individuals that are certain of purchasing the commodity due to the factors of planned behavior. This is also similar to those who are not sure of making that decision (Stocking & Lord 1983, p. 201).
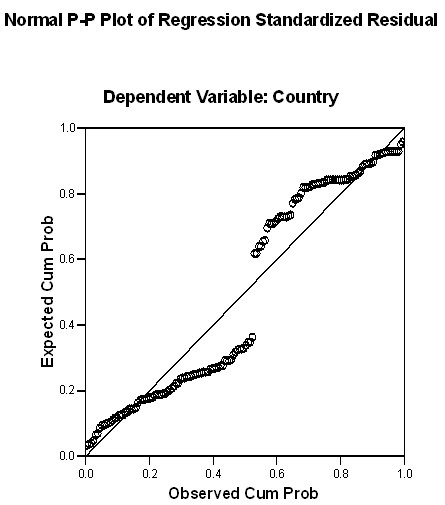
Figure 8 above is a linear distribution of the effects of the components of TPB in the two countries. It is clear from the above distribution; the data follows the regression model as shown by the line of best fit. At the beginning of the curve is the data for the distribution in the United Kingdom while towards the end is the data distribution of Germany (McCullough & Vinod 1999, p.633).
Effect of merchandise quality and Service quality on TPB
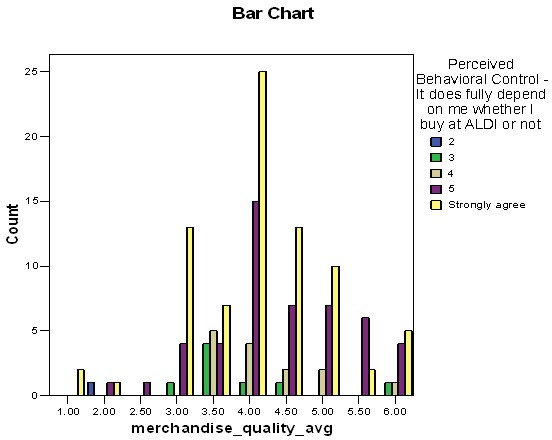
The above graph shows the effects of the merchandise quality on the TPB model. It is clear that the effects are in such a way that they follow a normal curve. At a level four of the rating is where there is the highest influence while it is the lowest at the peripheries (Stills 1989).
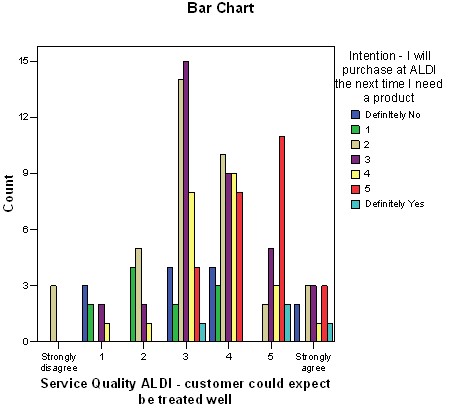
The effect of service quality on the TPB is shown in figure 10. The curve shows that the distribution is also on a normal curve where the highest influence is at the middle and reduces towards the two ends. This, however, is not as smooth as the effects of the merchandise on the TPB (Haebara 1980, p.144).
Discussion
The theory of planned behavior is one of the best models, which can be used to gauge an individual’s actions depending on their response to a number of factors. The innate factors are the most influential factors that dictate the behavioral actions. This is seen by the effects of the intention, one of the components of TBP, of the individuals surveyed on the decision of buying a given commodity. Indeed it is evident from the model in figure 1 that it has direct effects on the final behavior of the individual (Koger & Deborah 2010).
The perceived behavioral control has direct influence on both the final behavior and the intention of the individual. |From the result above it is evident that the individual’s behavior is influenced by the perception of the individual. The attitude and the subjective norm have direct influence on the attitude of the individuals which in turn affect the overall behavior (Stern 2005, p.10785).
The components of TPB are not the only factors which affect the behavior of a person, owing to the fact that there are other considerations, which have influence on the final behavior. The merchandise and the service quality are the other factors which are not in the TPB model yet they have influence on the individual’s behavior towards the purchase of the commodity (Kim & Kolen 2007, p.371). Generally, most of the factors have moderate influence on the behavior of the individuals, and that is why a larger number of the members on a scale of 1 to 6 lies between 3 and 5 in their response to the TPB factors as far as their behaviors are concerned (Sheppard 1996, p.49).
The effects of merchandise quality and the service quality though not direct on the behavior of the individual’s have been studied. From the results, it shows that the influence at each level of the TPB features along the measurement scale is significant (Sternberg 1990).
Indeed a behavior is not a discrete component which can be definitely determined, and therefore, it can only be approximated by considering all the factors both innate and the external factors which surround the individual. The factors shown on the graphs show normal distribution, which is the most common distribution as far as human performance is concerned and therefore, can be adopted as typical results. Moreover, the results from the behavioral changes in both Germany and United Kingdom show great similarities, and thus it can be generalized to other parts of the world (Gorsuch 1983).
Conclusion
The manifestation of the response of an individual observed in relation to given target results in behavior. The observations can be made over a span of time and extended to cover a number of contexts in order to give a generality of the behavior by giving some tangible comparisons and trends. “The theory of planned behavior is one of the theories, which are a function of the perceptions and compatible intentions as well as the control facets of behavior” (Sniehotta 2009, p.257). In a nutshell, the perceived behavioral control is a moderating feature to the behavioral intentions which in turn yield to a given behavior depending on the strength of the intentions of the individual. From the above study, it can be concluded that the TBP model has been clearly portrayed by the results gathered and the graphical representations. Practically, the intentions and the perceptions of the individuals in the society directly influence the behavior of a person, however the two factors do not interact with each other at all in a significant manner.
The study above has yielded a result which clearly supports the theory, and therefore, it can be used by the individuals who are in marketing to capture and estimate the behavior of a population and in the process use it as a marketing tool to influence their behavior. The marketing of ALDI is more predictable after the study and a pilot survey can be done before the introduction of a new commodity in the market. Through the study, the individual’s behavior towards the purchase of the commodity has been achieved. It is from the results that manipulation of the behavior can be done and thus resulting to a very powerful marketing tool (McCullough 1999, p.191).
References
Ajzen, I., 1985. From intentions to actions: A theory of planned behavior. New York: Springer-Verlag.
Ajzen, I., 1991. The theory of planned behavior. Org. Behav. Hum. Decis. New York: Springer-Verlag.
Ajzen, I. & Fishbein, M., 2005. The influence of attitudes on behavior. New York: Springer-Verlag.
Amjad, N. & Wood, A.M., 2009. Identifying and changing the normative beliefs about aggression which lead young Muslim adults to join extremist anti-Semitic groups in Pakistan. Aggressive Behavior, 35, pp.514-519.
Armitage, C.J. & Conner, M., 2001. Efficacy of the theory of planned behavior: a meta- analytic review. British Journal of Social Psychology, 40(4), pp.471-499.
Bandura, A., 1997. Self-efficacy: The exercise of control. New York: Freeman.
Conover, W.J., 1980. Practical nonparametric statistics. New York: Wiley.
Cooper, H. & Hedges, L.V., 1994. The Handbook of Research Synthesis. New York: Russell Sage.
Cornell, J.E. & Mulrow, C.D., 1999. Meta-analysis. London: Sage.
Gorsuch, R., 1983. Factor Analysis. Hillsdale, NJ: Lawrence Erlbaum.
Haebara, T., 1980. Equating logistic ability scales by a weighted least squares method. Japanese Psychological Research, 22(3), pp.144-149.
Kim, S. & Kolen, M.J., 2007. Effects on scale linking of different definitions of criterion functions for the IRT characteristic curve methods. Journal of Educational and Behavioral Statistics, 32(4), pp.371-397.
Koger, S. & Deborah, D., 2010. The Psychology of Environmental Problems. New York: Psychology Press.
McCullough, B.D., 1999. Econometric software reliability: EViews, LIMDEP, SHAZAM and TSP. Journal of Applied Econometrics ,14(2), pp.191-202.
McCullough, B. D. & Vinod, H.D 1999. The Numerical Reliability of Econometric Software. Journal of Economic Literature, 37(2), 633-665.
Norman, S.T., 1999. Tutorial in Biostatistics, Meta-Analysis: Formulating, Evaluating, Combining, and Reporting. Statistics in Medicine, 18(3), pp.321-359.
Ognjen, K., 2005. A Short Preview of Free Statistical Software Packages for Teaching Statistics to Industrial Technology Majors. Journal of Industrial Technology, 2, pp.1-2.
Sheppard, A.G., 1996. The sequence of factor analysis and cluster analysis: Differences in segmentation and dimensionality through the use of raw and factor scores. Tourism Analysis, 1(1), pp.49-57.
Sheppard, B.H., Hartwick, J. & Warshaw, P., 1988. The theory of reasoned action: A meta-analysis of past research with recommendations for modifications and future research. Journal of Consumer Research, 15(3), pp.325-343.
Sniehotta, F.F., 2009. An experimental test of the Theory of Planned Behavior: Applied Psychology. Health and Well-Being, 1(2), pp.257-270.
Stern, P.C., 2005. Understanding individuals’ environmentally significant behavior, Environmental Law Reporter. News and Analysis, 35(11), pp.10785-10790.
Sternberg, R.J., 1990. The geographic metaphor. New York: Cambridge.
Stills, D., 1989. International encyclopedia of the social sciences: Biographical supplement (Vol. 18). New York: Macmillan.
Stocking, M.L. & Lord, F.M., 1983. Developing a common metric in item response theory. Applied Psychological Measurement, 7(2), pp.201-210.
Velicer, W.F. & Jackson, D., 1990. Component analysis versus common factor analysis: Some issues in selecting an appropriate procedure. Multivariate Behavioral Research, 25(1), pp.1-28.
Sutton et al., 2000. Methods for Meta-analysis in Medical Research. London: John Wiley.