Structure of the Dissertation
This dissertation consists of six chapters. Chapter I is introductory. The chapter presents the background of the study, the problem statement discussing the importance of the study, research questions and objectives of the study; it discusses the scope of the research and its contribution to the field; and it provides the operational definitions applied to the study. Chapter II presents the literature review on the main aspects of the topic. The chapter discusses the related theories, the sustainability concept, the SMEs’ sustainability, entrepreneurial marketing and its dimensions. The chapter also analyzes the research gap in recent studies on the problem to support the need for the current study. Chapter III presents the conceptual framework for the research and hypotheses aligned with research questions. Chapter IV provides the methodology used for the research with the focus on explaining the sampling, data collection, and data collection procedures as well as the mine approach for analyzing the collected data. Chapter V introduces the findings that are taken from the data analysis. This chapter is divided into several meaningful sections with one discussing the peculiarities of the actual study and its demographic results and statistics, and another focusing on the results of PLS-SEM analysis with its two models, measurement and structural. Chapter VI evaluates the work done and presents the results and evaluation of the findings and hypotheses of the dissertation project. In this chapter, the hypotheses are compared with the findings, and the required conclusions are made to prove that proactiveness and resource leveraging may have a positive impact in order to increase business sustainability.
Background of the Study
With regards to this study context, the Saudi government and the private sector initiatives to provide the support for Saudi SMEs in terms of capital (debt and equity) are recently in place. Under the supervision of the Ministry of Finance, the Saudi Industrial Development Fund (SIDF) had established a special program called “Kafala” fund, which provides financial facilities for Saudi SMEs (Alsaleh 2012; Aragon-Correa et al. 2008). The Saudi Credit Bank had also distributed social loans to low-income Saudis, helping them to start their own businesses (Hertorg 2010; Sivakumar & Sarkar 2012). These efforts by the government are meant to foster the expansion of SMEs (Saudi Arabian Monetary Agency 2010; Sivakumar & Sarkar 2012). The private sector also plays a considerable role in supporting SMEs in Saudi Arabia. Hertog (2010) indicates the essence of support programs executed by private agencies that help SMEs in the Gulf region to gain external resources through learning and sharing (Hertorg 2010; Sivakumar & Sarkar 2012).
It is also necessary to mention that recently, the government of Saudi Arabia has made a considerable contribution to the sphere of work of Small and Medium Enterprises. The new formed Public Authority has been approved by the Cabinet in order to help create more jobs for young Saudis and support the economy of the country (Arab News 2015). Its main goal is to facilitate the conditions under which funding of different SMEs can be organized. Sheikh Nasser admits that this initiative is crucial indeed and can help to promote the difference that is expected from such country like Saudi Arabia (Marray 2015). It is expected that this new authority can help to remove the obstacles a number of SMEs face with. It is also a crucial step to improve the country’s economy and promote its growth. In addition to the expected economic growth, it is also possible to underline the development of new employment opportunities. The new body that is financially and administratively independent can regulate the work of small and medium organizations and ensure the required financial support for the sector under consideration. However, this improvement is new, and not many comments and opinions can be found. Still, this change has to be considered to realize how it can influence the essence of three pillars of sustainability.
Data Analysis and Findings
Introduction
This chapter presents the key findings from the data analysis. The first section reports the pilot study results. The next section presents the preliminary data analysis including the missing value, outlier’s detection, inspection on the data distribution, as well as the respondents’ demographic profile and descriptive analysis of the mean score and standard deviation. The other sections of the chapter provide the PLS-SEM analysis presented in two dimensions, which include the assessment of a model measurement and the assessment of a structural measurement in order to test the developed hypotheses. The chapter ends with the summary.
Summary of Pilot Study
In order to cater the pilot study, about ten questionnaires have been distributed. The pilot test was self-administered. Total 10 out of 10 questionnaires (100% response rate) have been used in an attempt to generate the result. The questionnaire has been distributed to two managers in each of the SME. Based on the result of the pilot survey, it has been shown that all of the respondents in this pilot study are male. Most of them are working as chief executive officers (6 respondents), they have attained the postgraduate degree (3 respondents), and the range age is between 30-39 years (6 respondents). Moreover, the majority of the SMEs respondents’ came from the manufacturing sector of the industry (5 respondents), with more than 20 years of establishment (5 respondents), and they have more than 200 employees (4 respondents). Lastly, the determined respondents’ company annual gross income fall in the range between 1,000,001 SR- 5,000,000 SR (3 respondents). Further details on the respondent’s profile based on the pilot survey are summarised in Table 5.1.
Table 5.1: Pilot Study Profile
Moreover, Cronbach’s Alpha was used in order to measure the internal consistency in the pilot survey. It is considered to be a measure of the reliability scale. In many social science researches, the alpha value of 0.7 and above is considered to be acceptable. Based on the generated result in the pilot study (Table 5.2), the alpha coefficient for all of the constructs was found to be greater than 0.7, and this fact indicates that the items in each constructs have the high internal consistency. Therefore, it was determined that the proposed constructs can be used for the actual data collection in the main study.
Table 5.2: Reliability Analysis – Pilot Study
Preliminary Data Analysis – Actual Study
The questionnaire has been distributed personally towards the target respondents with the intention to ensure the high response rate in return. About 256 questionnaires have been disseminated to target respondents, and all of them were returned back with completed answers, which enabled the researcher to further analyze the questionnaires. Thus, the 100% response rate and usable rate were observed (Table 5.3).
Table 5.3: Response Rate
The first stage in the analysis part is the preliminary data analysis. The goals of this preparatory information investigation are to alter the information to set it up for the further examination, depict the key elements of the information, and compress the outcomes. Firstly, the analysis on the missing value was performed. The results of this analysis are shown in Table 5.4 below. In this case, the missing data for the observation and individual case has been found to be 0.4 percent only. According to Hair et al. (2010), the listwise deletion is the default method for dealing with the missing data which simply means excluding any cases with data missing any variables involved from the analysis, since the missing value that has been found is an individual case only.
Table 5.4: Missing Value Analysis
Secondly, the focus is on the identification of outliers or cases that have data values that are very different from the data values for the majority of cases in the data set. For this case, the D2 (Mahanalobis Distance) was performed in order to obtain and check for multivariate outliers if any. This analysis has been done through the regression method. D2 follows a chi-square distribution with degrees of freedom equal to the number of variables included. The level confidence of 90%, the critical value of Chi-square table is 9.210 (df =2). Based on the generated result on the mahanalobis distance, there were ten cases that have been identified with values higher than critical value stated. Therefore, the ten cases have been removed in order to conduct the further analysis. The details on this analysis can be found in Table 5.5.
Table 5.5: Analysis on the Outliers
Thirdly, the last stage in the data mining and preliminary analysis is the inspection on the distribution of the data. This analysis can be displayed in the indicators of skewness and kurtosis of the data. In this context, skewness is noted in order to understand whether the distribution analysis has any deviation that can influence the results. In its turn, kurtosis demonstrates whether the distribution analysis can be discussed as “flattening” (Hair et al. 2014). According to George and Mallery (2010), the values for the asymmetry and kurtosis that are between -2 and +2 can be considered as acceptable in order to prove the normal univariate distribution. Therefore, by looking at the result shown in Table 5.6 below, it can be said that the data distribution is normal.
Table 5.6: Analysis on the Data Distribution
Demographic Results
Table 5.7 below presents the demographic result of the respondents. The result shows that the majority of the respondents who participated in this study are male (216 respondents), working as business owners (130 respondents), and having the undergraduate degree (112 respondents). Furthermore, the majority of the respondents in this study fall in the age group between 30-39 years (107 respondents). As for the type of the industry, about 103 respondents categorized their business under the service industry, with the year of establishment less than 5 years (82 respondents), that have about 5-20 employees (86 respondents), and the annual gross income is between 1,000,001 SR- 5,000,000 SR (53 respondents).
Table 5.7: Demographic Result
Descriptive Statistics
Furthermore, in order to gain the general review of the respondents’ perception towards SMEs’ business sustainability, the descriptive analysis has been performed on the entire construct used in this study. All of the items in the construct have been measured by using the Likert Scale on the basis of six scores (1= strongly disagree to 6= strongly agree). Subsequently, Table 5.8 below shows the recap of respondents’ perception towards SME business referring to the several main constructs. These constructs were assessed in terms of the minimum, maximum, as well as the mean and standard deviation scores.
Table 5.8: Descriptive Analysis
Based on the result shown, the average scores for the full construct are moderately low, and they are between 2 to 3 scores. The highest mean score falls under the SMEs’ business sustainability (2.55) followed by innovativeness (2.45). Whilst the lowest mean score is shown by proactiveness (2.07) that is followed by value creation (2.26). Additionally, in terms of the standard deviation, the SMEs’ business sustainability is the most little varied compared to other construct (0.76).
Analysis on PLS-SEM
In analysing the model by using the PLS, there are two main steps that should be taken. The first step is to assess the outer model, and the second step is to evaluate the results in the inner model. Hair et al. (2014) provide insights on how each step and each phase of the PLS-SEM should be applied and evaluated. Furthermore, the analysis is divided into the discussion of the used measurement model and set structural model. Therefore, the discussion of the outer and inner models in this study is based on propositions made by (Hair et al. 2014) in their work.
The inner model, or the basic model, shows the connections between the blocks being assessed. The external models, otherwise called the estimation models, are utilized to assess the connections between the pointer variables and their relating developments. The initial phase in utilizing the PLS-SEM includes creating the path model that interfaces variables and develops taking into account the hypothesis and rationale of the study (Hair et al. 2014). In creating the pathway, it is vital to recognize the area of the location in addition to the connections between them. The PLS-SEM calculations related to the analysis of the algorithm are the next step after specifying the models for the measurement. The assessment of the results should also involve the focus on the reliability and validity among other aspects. While beginning with the appraisal of the outer models, the researcher can assume that the constructs, which shape the premise for the evaluation of the inner model connections, are precisely measured.
First Stage: Measurement Model
The first step in the PLS Analysis is to analyze the Measurement Model (or outer model) to determine how well the indicators (specific questions) load on the theoretically defined constructs. Examining the outer model ensures that the survey items are measuring the constructs they were designed to measure, thus, ensuring that the survey instrument is reliable. To determine individual item reliabilities, the researcher looked at their loadings to their respective constructs. According to (Chin 1998), the standardized loadings should be greater than 0.707.
In the measurement or outer model evaluations, the focus is on the reliability and validity of the measures used to represent each construct. It involves determining individual indicator reliabilities (standardized outer loading), internal consistency reliabilities (composite reliability), as well as the measure convergent validities (average variance extracted or AVE), and discriminant validities (Fornell-Larcker criterion, cross-loadings).
Reflective indicators are usually utilized in order to determine the variety of items that are used within the concrete construct, as it is noted by Diamantopoulos and Winklhofer (2001) in their work. The presence of all reflective indicators to support the construct allows removing certain items without changing the meaning of the discussed domain. The reason is in the interchangeable character of items that are usually discussed as reflective. The meaning of the construct also remains unchanged because the main focus is on the loadings that are used to connect items within the set.
Hence, Table 5.9 presents the remaining item loadings, AVE, Composite Reliability, and Cronbach’s Alpha that were obtained from the model. There were 13 items that have the loadings value which is below the acceptable value. For instance, item (EN2) has been eliminated directly for the outer loading score 0.4 which is very poor and below minimum acceptable value (Hair et.al 2014). Since the loading for other eight indicators were tolerable in between 0.6 to 0.7, therefore, the assessment has been made after checking on the content validity of the construct (Hair et al. 2014). Hence, the study has further drop another five items (EC3, EN1, EN2, EN3, EN4) from the model due to low loading scores. The study dropped one item under business sustainability (EC3) for the low value of the item indicating that agreeableness towards economic performance is at an acceptable level in terms of its income stability seems to be unsuitable to measure the business sustainability as a whole.
Furthermore, four items has been removed as well under the business sustainability (EN1, EN2, EN3, EN4) because it seems that the business sustainability does not include exclusive dealing with the environmental pillar in Saudi Arabia. This aspect can be contingent with the descriptive analysis result on the business sustainability that has been discussed in Table 5.7 earlier. The finding shows that the mean score under this falls in range between 2 to 3 (disagree to somewhat disagree). It was found that the removing of these items increased the AVE in return.
Pertaining with loading scores, the composite reliability values has been examined as well. It is important to note that reliability and validity should be proved and confirmed during the process of the reflective outer models’ assessment. This procedure can be completed with the focus on evaluating not only the internal reliability but also the composite reliability. The reference to the Cronbach’s alpha allows the effective measurement of the reliability, but the role of the internal consistency reliability can be not taken into account in this case. However, it is also possible to use the composite reliability measure. The main advantage of the composite reliability is in accepting the inequalities in indicators that are consistent with the PLS-SEM algorithm.
Still, reflective indicators should also be evaluated with the focus on their validity. In order to measure validity, it is necessary to pay attention to its two types. The researcher needs examining both convergent and discriminant validity in order to receive the credible results. It is necessary to refer to the items’ outer loadings (>0.70). In this case, it is possible to speak about the convergent validity. In addition, the focus should be on the construct’s loadings. The desired average variance extracted (AVE) should be higher than 0.50 (Hair et al. 2014). The high AVE is examined to note that the construct can explain and represent the highest number of associated indicators. Table 5.9 summarises the reliability and convergent validity of the study construct.
Table 5.9: Reliability Analysis and Convergent Analysis
The result has shown that all of the AVE values in each construct have the adequate level of convergent validity minimum acceptable level of 0.5 (Hair et.al 2014). In the whole model, the lowest loading is 0.639 (EC4) and the highest loading is 0.898 (N2).
The next step is the examination of the discriminant validity to determine the uniqueness of the certain construct. This validity demonstrates the effectiveness of the proposed construct to measure the specific quality or factor. The discriminant validity is usually measured with the help of the Fornell-Larcker (1981) criterion. The researcher examines the variance related to not only other constructs but also to items. In this case, the discriminant validity is assessed by comparing the shared variance (squared correlation) between each pair of constructs against the average of the AVEs for the construct. Table 5.10 shows the discriminant validity for all study construct.
Table 5.10: Discriminant Validity
Note: Diagonal figures represent the square root of the AVE and the off-diagonal figures represent the correlations.
Based on the result shown in the table above, square root of the AVE are all more than the correlation values. This factor is indicating that all of the construct are strongly correlated with their own measures than with another construct in the model. Alternatively, according to the Fornell-Larcker criterion, the cross loading matrix was also assessed in order to demonstrate the higher loadings. These details on cross loading can be summarised in table 5.11 for cross loading measurement model. For this reason, therefore overall the Fornell-Larcker criterion and cross loading values has support the discriminant validity of the construct.
Table 5.11: Cross Loading for Measurement Model
Finally, after examining the convergent and discriminant validity of the measurement items in each construct as in outer model, the final measurement item can be shown in Table 5.12 below. As compared to the original items of 42, dropping five items counted as 11% only, which is below the cut off value of 20% as suggested by (Hair et al. 2014).
Table 5.12: Finalised of Measurement Items
Second Stage: Structural Model
The second step is the structural model assessment that includes the evaluation of the inner model. This assessment is important because it demonstrates the actual existence of any hypothesized relationships in the study. The advantage of using the PLS-SEM in this case is in determining parameters important to measure the predictive effects of the selected constructs clearly. Henseler & Sarstedt (2013) note that such relationships in the PLS-SEM can be measured with references to different statistical approaches to achieve the best results. In this context, it is possible to mention about a set of criteria or factors that are assessed in the study in order to increase the validity of results. The factors that need to be assessed include the collinearity and specific path coefficients. In addition, it is necessary to assess coefficients of determination. Finally, the cross-validated redundancy is evaluated, and the analysis of the effect size should be presented. The mentioned criteria can be presented as follows:
- Collinearity Assessment
- Path coefficients
- Coefficient of determination (R2)
- Cross-validated redundancy (Q2)
- Effect size (f2).
In this study, the inner model was assessed to identify possible collinearity issues. The results are based on the regression analysis findings. The reference was made to the Fornell-Larcker criterion (Hair et al. 2014). For formatively measured constructs, the collinearity assessment is rather contributing to avoid the bias, as well as exaggerated focus on the AVE. After measuring the inner model for collinearity, it is necessary to refer to testing the outer model. The reason is in the need to indicate the potential for the high collinearity levels that can lead to the high bias levels.
In the PLS-SEM, a tolerance value of 0.20 or lower and a variance inflation factor (VIF) value of 5 and higher respectively indicates a potential collinearity problem (Hair et al. 2014). In order to assess the collinearity among the constructs, it is important to start with examining it by using the linear regression in the SPSS software to find out the VIF value. There are four sets regression to be separated according to the research framework in this study for the collinearity assessment. Table 5.13 summarises the VIF threshold value.
Table 5.13: Assessment of the Collinearity
Based on the cut off value of 5 for VIF, it can be said that the collinearity among the predictor constructs is not an issue in the measurement model for this study.
- Value Creation (V) and Customer Intensity (C) as predictors of Proactiveness (P)
- Value Creation (V) and Customer Intensity (C) as predictors of Innovativeness (I)
- Value Creation (V) and Customer Intensity (C) as predictors of Resource Leveraging (R)
- Proactiveness (P), Innovativeness (I), and Resource Leveraging (R) as predictors of SME Business Sustainability (BS)
Next, the structural model path coefficients are estimated. Individual path coefficients of the PLS structural model can be interpreted as standardized beta coefficients of ordinary least regression (Hair et al. 2011; Hair et al. 2014). Each path coefficients’ significance is assessed by means of bootstrapping procedure. The minimum number of bootstrap sample is 5,000, and the number of cases is equal to the number of the observations (Chin 2010). In this case, the bootstrapping was applied with the sample of 1000 and cases of 246.
Table 5.14: Path Coefficient
Paths that are non-significant or show the sign contrary to the hypothesized direction do not support the prior hypotheses, whereas significant paths showing the hypothesized direction empirically support the proposed relationship (Hair et al. 2014). The structural path coefficients can also be interpreted relative to one another, where the larger path coefficient indicates greater effect on the endogenous latent variable (Hair et al. 2014).
The next step is to find out test the hypothesis. Commonly used critical t-values for two-tailed test are 1.65 (significance level = 10 %), 1.96 (significance level = 5%) and 2.57 (significance level=1%) (Hair et al. 2014). The choice of the significance level depends on the field of study and the study’s objective but in marketing, researchers usually assume a significance level of 5% (Hair et al. 2014).
Table 5.15: Result on Hypothesis Testing
Note: ***p<0.01, n.s not significant
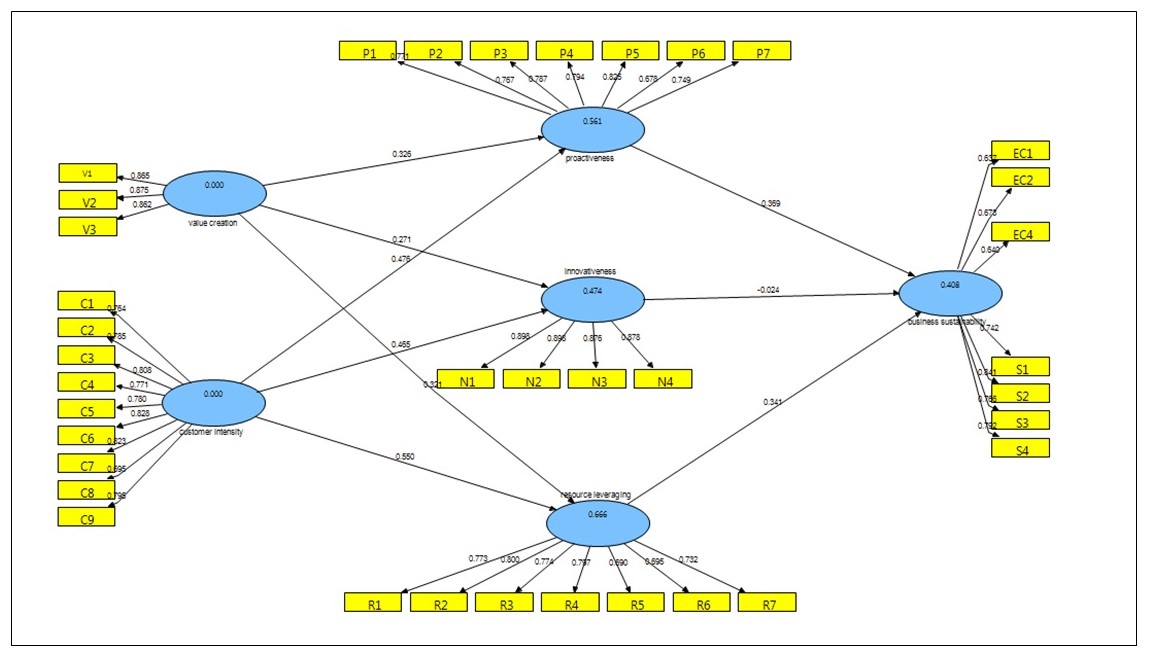
According to the result shown in Table 5.15, it has been found that there is only one hypothesis that is not significantly affecting business sustainability, which is H-2 (innovativeness, 0.285). The result has also shown that proactiveness is the most significant predictor of business sustainability with path coefficient of β=0.37, followed by resource leveraging which is also significant at one percent confidence level (p<0.05) with path coefficient of β=0.34. Therefore, the hypotheses proposed that proactiveness and resource leveraging has an effect on the SMEs business sustainability are supported.
Likewise, the other six hypotheses (H4, H5, H6, H7, H-8, and H9) are supported as well. In this dimension, the result has shown that consumer intensity (H-5) display larger path (β=6.227) and significant at one percent confidence level (p<0.01). It supports the assumption that the customer intensity has a positive effect on proactiveness practices of SMEs. Similarly, the value creation (H-6) has also found to have a positive effect on innovativeness practices of SMEs that are significant at confidence level of one percent (p<0.01) even though with much smaller path coefficient of β=0.27.
Moreover, the next evaluation under this second stage is the coefficient of determination (R2) value that is used to determine the accuracy of the researcher’s predictions made with references to hypotheses. This effect ranges from 0 to 1 with 1 representing complete predictive accuracy. Figure 5.1 displays the coefficient of determination in this model. Based on the figure shown, the R2 value for proactiveness, innovativeness, resource leveraging, and business sustainability are 0.561, 0.474, 0.666, and 0.408 accordingly. Because the topic of SMEs business sustainability is consider new, therefore the acceptable R2 values are 0.26, 0.13, and 0.02, respectively, describing substantial, moderate, or weak levels of predictive accuracy (Cohen 1988).Thus, it can be said that the values of R2 in this model are substantial.
Additionally, the effect size (ƒ2) of has been examined as well. Table 5.16 summarise the values of effect size in this model. According to Hair et.al (2014), the greater the effect size (ƒ2) value is the greater influence independent construct towards dependent construct. Additionally, Hair et al. (2014) have stated that the value of (>0.35), (>0.15), and (<0.02) means the construct has larger effect, medium effect, and no effect respectively. Thus, by looking at the result shown in table below, it has been found that innovativeness has no effect on the SMEs business sustainability. This finding is also aligned with the R2 value earlier. Meanwhile, the other construct has found to have an effect on business sustainability, for instance, proactiveness (0.368) and Resource Leveraging (0.340).
Table 5.16: Total Effect size (ƒ2)
Lastly, the final assessment under the second stage is to determine Q² effect. Q² is a criterion to evaluate how well the model predicts the data of omitted cases. It is referred to as predictive relevance. The process involves omitting (removing) or “blindfolding” one case at a time and re-estimating the model parameters based on the remaining cases. The omitted case values are then predicted on the basis of the newly estimated parameters of the remaining cases (Chin 2010).
By using the blindfolding procedure with omission distance of d=7, the cross validated redundancy to measure Q² were attained. Blindfolding is a sample re-uses technique that starts with the first data point and omits every d-th data point in the endogenous construct’s indicators. Then, the procedure estimates the PLS path model parameters by using the remaining data points. The resulting estimates are then used to predict the omitted data points. The difference between the true (i.e., omitted) data points and the predicted ones is then used as input for the Q²measure.
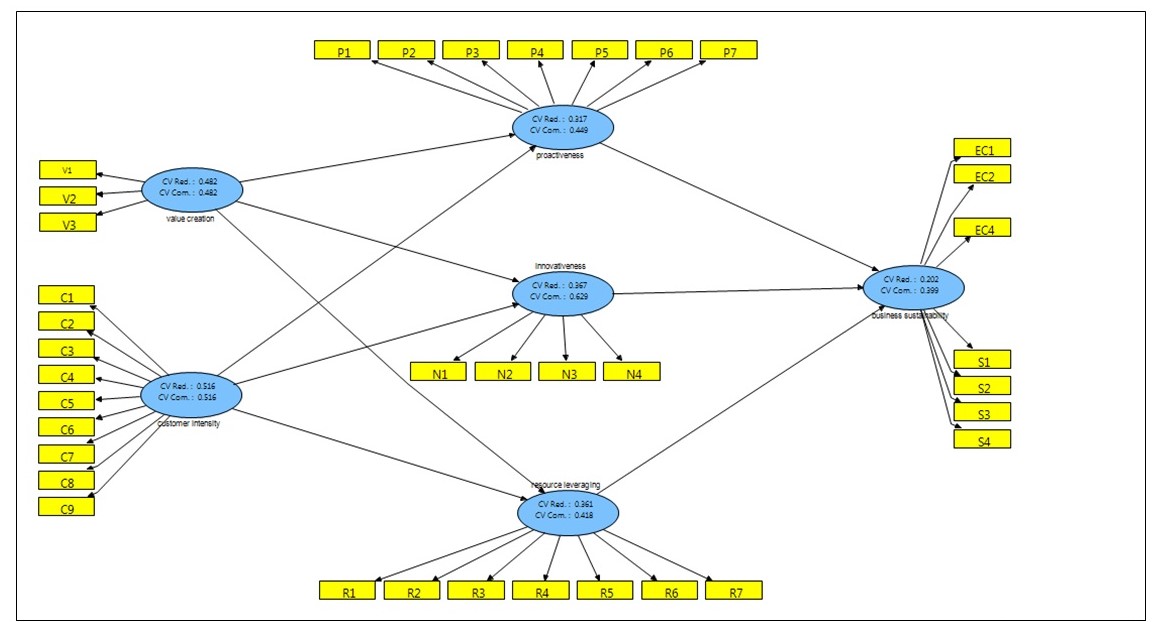
Q² can be obtained using two different types of prediction techniques, that is, the cross validated communality and cross validated redundancy. The cross validated communality is based on the score of latent variables and associated assumptions. The cross validated redundancy is based on measured blocks related to latent variables and associated predictions (Q² > 0.5) (Chin 2010). The estimations related to the cross validated redundancy in this particular study are presented in Fig 5.2. Table 5.17 summarizes the predictive relevance of Q² values. Thus, based on the result generated, it has been shown that only the customer intensity can be regarded as having a predictive effect on the business sustainability (0.516). In contrast, the other constructs have been regarded as rather non-predictive or slightly predictive in the model.
Table 5.17: Predictive Relevance of Q² Redundancy
Summary
The first section in this chapter presents the summary of the pilot study results that are followed by the preliminary analysis involving the data cleaning process such as the missing value analysis, detection of outliers, and data distribution inspection. Having done with the preliminary stage, the researcher analysed the demographic profile of the total 246 respondents. The result shows that the majority of respondents who participated in this study are male, working as business owners of the company, and having the undergraduate degree. Furthermore, the majority of respondents in this study fall in the age group between 30-39 years old. As for the type of the industry, the majority of managers categorized their business under the service industry, with the year of establishment less than 5 years. They noted having about 5-20 employees and the annual gross income between 1,000,001 SR- 5,000,000 SR.
During the main PLS-SEM analysis, two models were assessed and discussed. The discussion of the measurement model included the outer model evaluations with the focus on the reliability and validity of measures used in order to represent each construct in the study. The procedure involved determining individual indicator reliabilities (standardized outer loadings), internal consistency reliabilities (the composite reliability), as well as the measures of convergent validity (average variance extracted or AVE) and discriminant validities (following the Fornell-Larcker criterion and cross-loadings). Furthermore, four items under the business sustainability construct were removed because it was found that business sustainability in Saudi Arabia was not generally or exclusively related to the environmental pillar. Pertaining with the loading scores, the composite reliability values were also examined. The result has shown that all of the AVE values in each construct have the adequate level of convergent validity at the minimum acceptable level. Therefore, there were about 37 items that remained in the model.
At the next stage of the analysis process, the structural model assessment or the inner model assessment was conducted to examine the relationships between constructs. Collinearity and path coefficients were measured and analysed to indicate the presence of any relationships between constructs. Each of path coefficients’ significance was assessed by means of the bootstrapping procedure. It was found with references to the inner model analysis, out of nine hypotheses, only one was rejected. Following Hypothesis 2, it was found that innovativeness was not significantly affecting the business sustainability in the Saudi Arabian context. As for the R2 value for proactiveness, innovativeness, resource leveraging, and business sustainability, it was determined as substantial. Additionally, by using the blindfolding procedure with the omission distance of d=7, the cross validated redundancy to measure Q² was determined.
Based on the generated results, it has been shown that only proactiveness and resource leveraging can be regarded as having the predictive effect on the business sustainability. In addition, the data demonstrated that the value creation and customer intensity could have the predictive positive effect on proactiveness and resource leveraging leading to the business sustainability. From this perspective, the data supported the presence of the assumed relationships of the EM dimensions between each other, as well as the EM dimensions and the business sustainability. However, the presence of the relationship between innovativeness and business sustainability was not proved with the PLS-SEM data in the Saudi Arabian SMEs.
Discussion and Conclusion
Introduction
This chapter presents the detailed discussion of the study findings and hypotheses testing in the context of theories and past studies and provides the implications for knowledge, managers, and policy-makers, as well as limitations and directions for the further study. Thus, the chapter is divided into several sections. The first section discusses research objectives and associated hypotheses. The second section discusses inter-relationships of entrepreneurial marketing (EM) dimensions. The third section presents theoretical and practical implications. The fourth section discusses the study limitations. The next sections propose the directions for the future research. Finally, the conclusions regarding the research are provided at the end of this chapter.
Discussion of the Research Objectives and Hypotheses
The findings of the study indicate that four objectives were achieved, and the hypotheses testing demonstrates that Hypotheses 1, 3, 4, 5, 6, 7, 8, 9 were supported by the results, but Hypothesis 2 was not supported because of the absence of the statistically significant relationship between constructs. The results confirm that proactiveness and resource leveraging as EM dimensions influence sustainability in SMEs, as it is in line with the studies by Gawel (2012), Rezvani and Khazaei (2013), and Wallnofer and Hacklin (2013). However, innovativeness is not positively and significantly related to sustainability because SMEs in Saudi Arabia lack the implemented innovative practices.
Moreover, there is the strict evidence that value creation and customer intensity as the dimensions of building the competitive advantage in the firm positively affect the increase in the companies’ proactiveness, innovativeness, and resource leveraging. These results are consistent with findings and conclusions made by Beverland et al. (2007), Blocker et al. (2010), Tanev et al. (2011), Hacioglu et al. (2012), Vrontis et al. (2012), and Fiore et al. (2013). Hypotheses are based on the theoretical assumptions and presented in the context of Institutional Theory and Contingency Theory. Therefore, it is assumed that the managers’ choices of practices and answers to the questionnaire items are influenced by the institutional environment (Manolova et al. 2008) and the vision of available contingencies to choose the most appropriate strategy for implementing sustainability in the organisation (Ibeh 2003).
Objective 1: Examining the predictive effect of proactiveness, innovativeness and resource leveraging on SMEs’ business sustainability.
Proactiveness and Sustainability
While focusing on the studied relationship between proactiveness, innovativeness, resource leveraging, and business sustainability, it is possible to state that proactiveness has the highest positive effect on sustainability in comparison to other EM factors (path coefficient is 0.369, > 0.20), and the statistical significance of the relationship is also high. According to Morris et al. (2002, p. 6), proactiveness is related to the sustainable development of the company as the leaders’ approach to manipulating and influencing the environment. The proactive actions of leaders are also viewed by Mitra et al. (2008, p. 103) as the approaches to creating the sustainability. In this context, managing environmental changes with the help of proactive steps, leaders are able to achieve the balance and sustainability (Mitra et al. 2008). The Institutional Theory is used by the researchers to explain how proactiveness can be helpful on the path to sustainability in the company (Mitra et al. 2008). These results are consistent with the ideas by Rezvani and Khazaei (2013, p. 208), who noted that proactiveness as the process of seeking opportunities for companies is associated with influencing the environmental and organisational changes. In other words, proactiveness is chosen by leaders in those situations when they choose the direction to sustainability. The reason is that the orientation to new opportunities and approaches of companies leads to positive changes associated with the sustainable development of the company in terms of its environmental, social, and economic progress (Mitra et al. 2008, p. 103; Rezvani & Khazaei 2013, p. 208).
From this point, the findings are directly correlated with the ideas by Gawel (2012, p. 10), who stated that those companies that have the lowest proactiveness as the orientation to searching for new opportunities also have the lowest level of sustainability because of focusing on past trends. On the contrary, the highest level of proactiveness directly leads to the active use of opportunities associated with or affecting the sustainable development (Gawel 2012, p. 10). Therefore, the findings support the researchers’ opinions and earlier conclusions that the higher proactiveness in the form of seeking new opportunities for marketing and leading the change in the company can result in the higher sustainability in the Saudi Arabian SMEs.
Innovativeness and Sustainability
The findings of this study indicate that in the Saudi Arabian context, there is no direct positive relationship between innovativeness and sustainability. Thus, the results demonstrated that there is no a statistically significant relationship between these two constructs, and while focusing on the relationship, it is important to note that it tends to be negative. As a result, Hypothesis 2 is not supported. The absence of the relationship between innovativeness and sustainability can be discussed as a non-regular feature because such researchers as Gawel (2012) and Hills and Hultman (2011) proved the direct relationship between these factors that influence the development of the business. Thus, according to Gawel (2012, p. 11), innovativeness is based on improving products and services to enhance the operations and achieve sustainability, while reducing all types of costs. The reason is that the sustainable development is based on changes in strategies and innovations. This idea is also supported by Dobni (2010, p. 56). Hills and Hultman (2011, p. 4) also stated that innovativeness in forms is important to build the sustainable strategy and achieve the competitive advantage and flexibility. The researchers are inclined to state that innovativeness of the firm based on the implemented innovations is an important factor to achieve sustainability for small businesses. According to Bresciani et al. (2011, p. 294), the promoted innovation is a guarantee of the further sustainable development of small family businesses. In their turn, Vrontis et al. (2012, p. 431) focused on the innovation as directly associated with the competitive advantage that is based on the ideas of the sustainable development. Vrontis et al. (2012) found the relationship between innovativeness and sustainability while discussing how firms can use creativity and innovations for the strategic redevelopment according to the principle of the balance and sustainability.
However, the absence of the obvious positive relationship between these two constructs in the Saudi Arabian context can be viewed as predictable because SMEs in Saudi Arabia are only on their path to integrating the idea of innovativeness in the business development to achieve sustainability. As a result, managers cannot determine what practices related to innovation can be used in order to achieve sustainability that is also a new concept for the majority of SMEs in the country (Sadi & Iftikhar 2011, p. 226; Saudi Arabian Monetary Agency 2010, p. 3). Shalaby (2010, p. 11) claimed that in Saudi Arabia, there is a lack of innovative mechanisms for the work of SMEs to compete effectively in the industry. Bahaddad et al. (2013, p. 70) and Berghman et al. (2013) also noted that the use of innovation techniques is problematic in the context of Saudi Arabia, and it is one of the challenges for SMEs. From this point, there are numerous barriers for SMEs to integrate innovativeness in Saudi Arabian businesses, and the paradox is in the fact that the problem is also in the active growth of SMEs because the frequent appearance of many SMEs in the country tends to “kill innovation” (Alsaleh 2012, p. 5). Therefore, being unable to use the benefits of innovativeness in SMEs, managers cannot see the direct relationship between innovativeness and sustainability (Majid & Koe 2012, p. 295; Ahmad 2012, p. 217). From this perspective, the findings of this study do not support the hypothesis about the positive relationship between innovativeness and sustainability typical of business contexts that are other than Saudi Arabian SMEs. However, the results support the statements argued in the previous studies that SMEs in the country lack the focus on innovativeness that prevents them from the effective and sustainable development (Achoui 2009, p. 38).
Resource Leveraging and Sustainability
Resource leveraging as the creative and most effective use of resources in the company leads to positive changes in operations, and as a result, this strategy leads to sustainability. The findings of this study demonstrate that there is the direct positive relationship between resource leveraging and sustainability. From this point, Hypothesis 3 is supported by the study results. The dependence of the business sustainability on the aspect of resource leveraging means that the firms’ success in the creative resource management leads to the increased chances of improving sustainability. This idea was mentioned by Wallnofer and Hacklin (2013, p. 760) and Webb et al. (2011, p. 544). If an organisation can effectively leverage the resources, it can mobilise its skills and funds in order to create the sustainable or perfectly balanced environment (Rezvani & Khazaei 2013, p. 212).
These findings are in line with the ideas by Gawel (2012, p. 10) who states that such easy steps in the resource management as the economical use of the energy and the efficient use of materials can lead not only to balancing the economic performance but also to developing the other aspects of sustainability. According to Alsaleh (2012, p. 4), SMEs in Saudi Arabia need to develop their strategic resources in order to gain the competitive advantage, improve performance, and achieve the strategic growth, as well as sustainability. From this point, the findings support the researchers’ previous conclusions in the field, and they allow speaking about the significant role of resource leveraging in affecting the sustainability in SMEs, and the success depends on the use of most creative approaches to managing both material and human resources to achieve the higher results (Rezvani & Khazaei 2013, p. 212; Webb et al. 2011, p. 544).
Objective 2: Examining the predictive effect of value creation and customer intensity on SMEs’ proactiveness.
Value Creation and Proactiveness
The relationship between the value creation and proactiveness as the firm’s feature was discussed by many researchers. However, different directions of this relationship were noted. The findings indicate that such direction of the relationship as the impact of the value creation on proactiveness exists, and it is rather significant. As a result, Hypothesis 4 is supported. These findings are in line with the results and discussions presented in studies by Beverland et al. (2007) and Blocker et al. (2010). According to Beverland et al. (2007, p. 49), the creation of the customer value leads to developing the managers’ proactive understanding of their resources and strategies. In their turn, Blocker et al. (2010, p. 217) noted the process of the value creation is proactive in its nature.
Becherer et al. (2008, p. 45) stated that proactiveness is a characteristic of firms that try to develop new approaches to increase the value and competitiveness. Morris et al. (2002, p. 8) focused on the value creation as a result of the leaders’ proactive and creative actions to find the new sources of the customer value. Fiore et al. (2013, p. 66-67) also noted that the dependence of the value creation on the proactive utilisation of different resources to find new opportunities for the firm, and then, on the proactive use of the value to achieve the high position in the market. From this point, the researchers were inclined to discuss proactiveness as the source of the value creation for companies rather than the value creation as the source of proactiveness. These findings support the assumption that there is the complex interrelationship between the dimensions of EM because the study results support the idea that the process of value creation affects proactiveness in SMEs in addition to the reverse relationship, when proactiveness leads to the value creation.
Customer Intensity and Proactiveness
The findings of this study indicate that there is the statistically significant relationship between customer intensity and proactiveness, and the higher level of customer intensity leads to the higher level of proactiveness. The phenomenon of the customer intensity is discussed by Morris et al. (2002, p. 7) and Blocker et al. (2010) as the process of attracting and retaining customers with the help of different strategies, approaches, and techniques. The use of these strategies is oriented to attracting and satisfying more customers. As a result, the success of the firm in this practice is based on its proactive approach. Blocker et al. (2010, p. 217) called this phenomenon the “proactive customer orientation.” Beverland et al. (2007, p. 55) also supported this vision, and they noted that proactiveness is a potential for developing the effective relationships with customers to increase the customer intensity.
The findings can be discussed as supported with references to the results of the studies by Hacioglu et al. (2012, p. 872), who found that the firm’s performance depends on addressing the customers’ needs, and this approach contributes to increasing the proactiveness of the firm. The findings are also consistent with the assumptions made by Challagalla et al. (2009, p. 77), who stated that the focus on customers leads to increasing customer-level outcomes, and the overall proactive potential of the firm can also grow. However, the previous researches present only assumptions regarding the presence of the relationship, and this study covers the gap in the field and provides the evidence to state about the actual relationship between customer intensity and proactiveness for the very first time. Therefore, the study results demonstrate that there is a strict relationship between customer intensity and proactiveness, and it is possible to speak about the interrelationship of these dimensions because the increase of any factor leads to the positive changes in another one.
Objective 3: Examining the predictive effect of value creation and customer intensity on SMEs’ innovativeness.
Value Creation and Innovativeness
The study results support the idea that there is a positive relationship between the value creation and innovativeness. Following the findings by Tanev et al. (2011, p. 132), it is possible to state that modern companies create the value while cooperating, and the focus on using value creation practices directly leads to increasing the innovativeness of the firm because of a range of implemented new approaches and the development of the concept of innovation. Bowonder et al. (2010, p. 22) found that the value creation based on the development of new products can directly lead to the progress of innovation in the company. In their turn, the similar idea was supported by Vrontis et al. (2012, p. 426), who developed the concept of the “value-based innovativeness”, accentuating the direct relationship between the idea of value creation and innovativeness. The findings of the study support the idea that those SMEs that focus on the value creation also build strategies for increasing innovativeness for the better competition in the market (Vrontis et al. 2012, p. 426). The findings are also supported with references to the discussion of the value creation by Dobni (2010). The researcher has found the relationship between the creation of the differentiable value and the further development of the culture based on the principle of innovation in the company (Dobni 2010, p. 56). In this context, the findings are linked to the previous studies that examined the presence of relationship between the value creation and innovativeness.
Customer Intensity and Innovativeness
The findings indicate that in the Saudi Arabian context, the relationship between customer intensity and innovativeness is even more obvious and statistically significant than the relationship between value creation and innovativeness. The findings can be explained with references to the studies by Sawhney et al. (2005), Romero and Molina (2009), and Tanev et al. (2011). The study results are in line with the findings by Sawhney et al. (2005, p. 11), who found that the customer’s ideas and knowledge can influence the product innovation in the company, especially in the online sphere. Romero and Molina (2009, p. 413) developed the idea and stated that the customers can influence the development of the firms’ new experiences and strategies with the focus on the idea of value creation. From this point, all three dimensions of entrepreneurial marketing seem to be interrelated. Tanev et al. (2011, p. 132) also mentioned in their work that the active customers can contribute to the development of new products to increase the innovativeness of the firm.
The results also supported the findings presented by Hacioglu et al. (2012, p. 876), who stated that in the Turkish SMEs, the customer intensity is directly related to increasing the innovativeness in the company in terms of affecting the innovative performance. Fiore et al. (2013, p. 79) went further, and the researcher accentuated the idea of the “consumer-centric innovation”. Therefore, the current discussion of the relationship between customer intensity and innovativeness is in line with the previous studies in the field. As a result, it is possible to conclude that while orienting to customers, their knowledge, and ideas, SMEs are inclined to implement more innovative approaches in order to compete in the market successfully.
Objective 4: Examining the predictive effect of value creation and customer intensity on SMEs’ resource leveraging.
Value Creation and Resource Leveraging
The statistically significant relationship is observed between value creation and resource leveraging in Saudi Arabian SMEs. According to Tanev et al. (2011, p. 150), the value creation is closely linked with the innovation processes in the company, and the managers’ approaches to increasing the value lead to improving the resource management. The researchers argued that the value co-creation could lead to even more intensive process of resource leveraging (Tanev et al. 2011, p. 150). The findings are in line with the claims made by Kurgun et al. (2011, p. 352) in their research. The investigators found that the process of increasing the customer value is directly associated with changes in managing resources, and the more creative use of available tools and resources leads is associated with the focus on the highest value. However, in this case, the effective use of resources is obviously regarded as a cause for the value creation.
In addition, Sull and Escobari (2004, p. 18) also discussed resource leveraging as one of the ways to create the value. Still, the current findings indicate that there is also the reverse relationship to support the interdependence of these two constructs, and this direction of the relationship was not studied previously in detail. Nevertheless, it is important to note that Wallnofer and Hacklin (2012, p. 757) and Kraus and Britzelmaier (2012, p. 20) were among those researchers who viewed the process of the value creation associated with the customer value and the value in the market as leading to the enhancement of approaches to developing resources of the competitive advantage and their management. From this point, the current findings support the hypothesis that the focus on the value creation in the Saudi Arabian SMEs can cause the further improvement of resource leveraging.
Customer Intensity and Resource Leveraging
The results indicate that the most statistically significant relationship associated with the impact on the resource management is observed between customer intensity and resource leveraging. It is a problematic task to find the support for such dependence in the previous literature on the topic because the researchers discussed the relationship between these constructs mainly in terms of the customers’ impact on managing resources while explaining the creation of the value in the firm. However, there are notes that customer intensity as the received information on customers’ needs, preferences, and interests can influence the managers’ approaches to the use of resources in order to address the customers’ expectations directly (Setia et al. 2013, p. 582; Sull & Escobari 2004, p. 18). The results of this study can be supported with references to the claims made by Setia et al. (2013, p. 582). The researchers found that firms were inclined to use the most effective approaches, strategies, technologies, and resources while aiming to attract customers or address their complaints. From this point, customer intensity has an effect on resource leveraging. Thus, the findings support the ideas mentioned by the other researchers in the field indirectly, while discussing the notion of the value creation.
Inter-relationships of Entrepreneurial Marketing Dimensions
One of the main contributions of this study is the emphasis on the inter-relationships of entrepreneurial marketing dimensions that, in their turn, influence the SMEs’ potential for the development of sustainability. The study of inter-relationships of entrepreneurial marketing dimensions allows determining in what way these factors can influence each other, and what combinations of entrepreneurial marketing dimensions are the most promising ones to expect the further sustainable development of the SME. The research indicates that customer intensity has the large effect on innovativeness, proactiveness, and resource leveraging (ƒ2 = 0.464, 0.475, and 0.549 accordingly), but the effect of value creation on innovativeness, proactiveness, and resource leveraging is medium (ƒ2 = 0.270, 0.325, and 0.321 accordingly). Moreover, comparing the effects of innovativeness, proactiveness, and resource leveraging on business sustainability, it is possible to state that the larger effect is observed for the significant relationship between proactiveness and sustainability.
These findings are important for managers in Saudi Arabian SMEs in order to focus on the customer intensity as an approach to improve the other entrepreneurial marketing dimensions, and especially, proactiveness to achieve the business sustainability in the shortest period of time. From this point, focusing on entrepreneurial marketing dimensions inter-relationships, it is possible to predict what factors will have the most advantageous effect on the sustainable development of the firm (Bettiol et al. 2012, p. 225). The findings demonstrate that customer intensity can have the more significant effect than the value creation to achieve the higher strategic results, and they allow managers in Saudi Arabia to conclude what dimensions of the entrepreneurial marketing and in which combinations can contribute significantly to the sustainable progress of SMEs. As a result, it is possible to state that the entrepreneurial marketing dimensions are interrelated, and they have different effects on each other, and the managers can improve their understanding of these aspects with references to the current study to implement the most effective entrepreneurial marketing dimensions to achieve sustainability.
Implications
Findings of this study have the theoretical and practical implications. Thus, the examination of the effect of entrepreneurial marketing on business sustainability in SMEs contributes to the theoretical knowledge in the field. Moreover, the findings are theoretically significant in terms of providing the evidence to speak about the relationship between value creation and resource leveraging and the relationship between customer intensity and proactiveness. The practical implications include the contribution for managers as they can use the results of the study in order to improve their approaches to creating the value, supporting the customer intensity, guaranteeing proactiveness and resource leveraging to achieve suitability. The practical implications also include the necessity for managers to understand the complicated relationship between innovativeness and sustainability in the Saudi Arabian context. The study also contributes to developing the certain policies in the business environment of the state to guarantee sustainability. Therefore, the research also has implications for policy-makers.
Implications for Knowledge
While discussing the theoretical contribution of the study, it is important to note that it focuses on determining and explaining the relationship that exists between entrepreneurial marketing and business sustainability of SMEs. In spite of the fact that there were many studies in the field to determine the relationship between separate dimensions of entrepreneurial marketing and the companies’ sustainable development or advantage, this study contributes to the existing knowledge while discussing how entrepreneurial marketing dimensions can influence each other and then, the business sustainability of SMEs (Gawel 2012; Hacioglu et al. 2012; Wallnofer & Hacklin 2013). In this context, it is the first research to explain not only the role of entrepreneurial marketing in achieving sustainability but also the inter-relationships between entrepreneurial marketing dimensions as influential factors for the businesses’ sustainable development. From this point, the discussion of the relationship between value creation and resource leveraging and the relationship between customer intensity and proactiveness are tested and discussed in this study for the very first time.
Besides, regarding the theoretical implications of the current study, it is necessary to admit the importance of the gaps, their evaluation, and the possibility to fulfill the majority of them successfully. The literature review helps to clarify the fact that there are a number of gaps between such concepts as entrepreneurial marketing and sustainability or customer intensity and proactiveness. These gaps may be explained by the evident misunderstandings of the past studies and the inabilities to come to the same conclusions and describe the nature of the relations between the concepts of entrepreneurial marketing, sustainability, intensity, validity, etc. The current study makes it possible to fulfill the gaps successfully and use the surveys to identify the impact of proactiveness, resources, and innovativeness on sustainability in entrepreneurial marketing on the example of the SMEs in Saudi Arabia.
From a theoretical perspective, the study also adds to the knowledge regarding the specific role of different entrepreneurial marketing dimensions in affecting SMEs’ business sustainability. The reason is that the researcher was focused on discussing the relationship between entrepreneurial marketing dimensions and sustainability, using specific paths and directions. As a result, it is possible to conclude now that the value creation has the similar important effect on proactiveness as proactive actions have on the value creation; the value creation has as significant impact on innovativeness as innovations have on the value creation; and the value creation has the similar impact on resource leveraging as the management of resources has on creating the value in SMEs. In addition, the similar directions of relationships are characteristic of customer intensity and its impact on proactiveness, innovativeness, and resource leveraging. If researchers noted regarding some observed relationships between entrepreneurial marketing dimensions previously, there was no evidence to state that there are also relationships between value creation and resource leveraging, as well as customer intensity and proactiveness (Morris et al. 2002; Rezvani and Khazaei 2013). Therefore, these study findings provide the empirical evidence to state that such relationships exist, and they are positive.
The results indicate that Institutional Theory and Contingency Theory are usually used by managers to explain how the internal and external factors can influence their approach to using the entrepreneurial marketing principles and dimensions in order to enhance the sustainable development of the SME. As a result, utilising the theoretical framework based on the aspects of Institutional Theory and Contingency Theory, the study aims at explaining the relationship between such concepts as entrepreneurial marketing and sustainability and between entrepreneurial marketing dimensions. From this perspective, the study contributes to the knowledge in the field while explaining the concept of sustainability in the context of SMEs in such rapidly developing economies as Saudi Arabia. It is revealed that there is the direct positive relationship between such entrepreneurial marketing dimensions as value creation and customer intensity and such entrepreneurial marketing dimensions as proactiveness, innovativeness, and resource leveraging (Gawel 2012; Hacioglu et al. 2012). Moreover, there is also the relationship between proactiveness, resource leveraging and sustainability. These theoretical conclusions are in line with findings by Morris et al. (2002), Mitra et al. (2008), Webb et al. (2011), Gawel (2012), Rezvani and Khazaei (2013), and Wallnofer and Hacklin (2013). However, one more important contribution of the study to the theory of discussing the Saudi Arabian SMEs is that the negative relationship between innovativeness and sustainability discussed in the context of Saudi Arabian SMEs is supported with references to the current study’s results.
Implications for Managers
The results of this study can be discussed as important to improving the managerial practices in the Saudi Arabian SMEs in terms of their focus on developing sustainability based on the implementation of the entrepreneurial marketing principles and dimensions of their strategies and daily operations. From this point, the study results allow managers in SMEs to understand the important relationship between entrepreneurial marketing dimensions and sustainability with the focus on the significant effects that have proactiveness and resource leveraging on achieving the desired sustainable development. In the context of Saudi Arabia, sustainability of SMEs is a purpose for many managers, but the problem is in the lack of experience in using entrepreneurial marketing dimensions to increase the firm’s potential and guarantee the sustainability. The study also contributes to understanding such challenge in the Saudi Arabian entrepreneurial marketing as the lack of focusing on innovativeness. The study findings indicate that many managers in SMEs accept the significant role of proactiveness and resource leveraging in affecting sustainability, but they lack effective practices to promote innovativeness in order to achieve sustainability quicker.
As the idea of sustainability is only developing in the country’s business environment, the current study results are helpful to promote the understanding of the SMEs’ strengths and weaknesses at their path to achieving the sustainable development with the focus on the manipulation of entrepreneurial marketing dimensions. Managers in SMEs should realise how their practices regarding the value creation and customer intensity are related to proactiveness and resource leveraging in the firm, and how all these efforts can positively influence the sustainability in the concrete company (Gawel 2012; Hacioglu et al. 2012). From this point, managers receive the opportunity to choose what entrepreneurial marketing dimensions should be implemented in what combinations. Moreover, managers need to realise that the lack of innovativeness adopted in SMEs is one of the main barriers to sustainability as the balanced growth of the company (Abdullah et al. 2014, p. 201; Alsamari et al. 2013, p. 107). While taking into account that there are direct positive relationships between EM dimensions and targeted sustainability, managers should understand what they can change in terms of restructuring their approaches to the value creation and customer intensity; what they can add to SMEs’ proactiveness and resource leveraging; and what they should change in their approaches to discussing innovativeness in companies. It is also important to note that the findings of the study are most appropriate to be implemented by managers in SMEs in Saudi Arabia because SMEs represent a special category of businesses that develops in the country according to specific laws and with the support of the government.
However, the results can also be applied by managers in SMEs in the similar contexts of the rapidly developing Middle Eastern economies. In addition to managers in SMEs, the findings can be discussed as useful by the entrepreneurs and business executives who are responsible for implementing the principles of entrepreneurial marketing in their SMEs. The reason is that the study demonstrates that sustainability of the firm is directly based on the successes of managers in applying the principles of entrepreneurial marketing in practice. As a result, these study findings can be used in order to prioritise the practices that can be utilised by entrepreneurs and managers with the purpose of increasing their potential for achieving sustainability. While focusing on the results of the study, it is possible to state that managers need to pay more attention to hiring skilled employees, creating and co-creating the value, and referring to customers in order to increase their proactiveness and resource leveraging to influence their strategy regarding the building of sustainability. They should focus on the customer intensity to improve proactiveness in order to achieve the business sustainability for the SME in the shortest term. In addition, managers of SMEs in Saudi Arabia should become focused on the problem of innovativeness of the firm as the result of implementing innovations in the company’s practice to achieve sustainability quicker and increase the sustainable advantage.
Implications for Policy-Makers in Saudi Arabia
The study findings are also important to provide policy-makers with the evidence regarding the dependence of sustainability on the effective implementation of entrepreneurial marketing dimensions in strategies of SMEs in Saudi Arabia. The problem is in the fact that the effective development of SMEs is a goal for the Saudi Arabian government and policy-makers, and they pay much attention to designing and implementing programs to support entrepreneurs, but the results are still not promising because of the lack of innovativeness in the practices and strategies of SMEs. From this point, policy-makers can refer to the results of this study in order to understand the relationship between entrepreneurial marketing dimensions and sustainability in order to re-organise their approach to promoting the sustainable development of SMEs. In order to guarantee that SMEs follow the path of the sustainable development, policy-makers should formulate principles and introduce programs that aim at removing the barriers for SMEs to implement the innovative practices and tools in their daily practice. The use of innovations in practices as the condition for increasing the competitive advantage of the SME should be reflected at the state level in policies, and additional programs to support new SMEs can be proposed in order to help managers adapt to the entrepreneurial marketing context and increase their advantage.
From this point, the current study provides policy-makers with the evidence on the modern situation in Saudi Arabian SMEs regarding the understanding of the role of EM dimensions in promoting sustainability. In this situation, the task of policy-makers is to create the normative environment for Saudi Arabian entrepreneurs in which the focus on entrepreneurial marketing dimensions should be a required condition in order to achieve sustainability because the current study supports the findings of other researchers in the field regarding the relationship between entrepreneurial marketing and sustainability. The industry of SMEs is rather specific, and the study results are helpful for policy-makers to accentuate the importance of using rather innovative approaches to supporting SMEs on their path to the sustainable development that is the guarantee of the healthy progress of the industry and business market in Saudi Arabia. From this point, the task of policy-makers is to decrease the number of institutional pressures in the state business context and to provide opportunities for SMEs to achieve sustainability while addressing the issue of innovativeness. The current study indicates that the focus on entrepreneurial marketing dimensions contributes to achieving sustainability in SMEs, and the main barrier is the factor of innovativeness because it is not applied correctly in SMEs, but its potential for the sustainability growth is high. Therefore, policy-makers in Saudi Arabia can use these findings in order to determine the factors that need to be addressed in order to add to the development of the sustainable business environment in the state.
Implications for the Saudi SMEs Authority
Recently, the government of Saudi Arabia has announced the creation of a Public Authority for SMEs, and the Cabinet has approved the suggestion. Among the variety of possible outcomes, the financial changes are more captivating and effective. This new authority can also define the quality of research that has been already done in this project. The establishment of the appropriate programs and policies can be predetermined by the effectiveness of the authority’s work. The three pillars of sustainability that are People, Profit and Plant can be considerably improved with the help of this new authority. The evaluation of social, economic, and environmental issues should clarify the situation and make some independent predictions in regards to the innovation offered.
Economic Sustainability
For a long period of time, it was admitted that self-sustainability is the possibility to ensure economic freedoms and improved possibilities. A number of developing countries face the challenge of unemployment. However, Saudi Arabia and its current economic progress have nothing in common with the challenges that can be observed in developing countries. The development of the authority is a good chance for Saudi Arabia to solve the current economic problems and succeed in making profits. The experts admit that the funding system can be improved with the help of the authority. There are a number of captivating words and ideas on how beneficial the offered idea is. However, in regards to all those words, it is hard to check a true effectiveness of the authority in a real life using real examples. Still, it is possible to predict that this authority can help to create more trustful relations with banks, and SMEs can get access to funding within a short period of time. The economic changes can attract the attention of the SMEs of other countries. More people would be eager to understand how the presence of one public authority can change the economic situation in the country. The SMEs could be eager to use the authority as a possibility to trust in some new economic bodies and be introduced as powerful economic bodies in the chosen sector. The SMEs can get access to different resources that have not been used yet and try new perspectives that have not been tried yet. The possibility to benefit from the novelty and avoid financial losses is the main aspect of the profit pillar of sustainability in SMEs.
Social Sustainability
Many changes can be also observed in the social sector. The authority is the possibility to try some new incentives programs within the frames of which it is possible to promote social responsibility and proactiveness. From the examples offered by other developed countries, social changes and the role of the public authority can be interrelated only in case the authority participates in a decision-making process in an SME. It is not enough to be formally identified for the authority. It is more important for each SME believe in the effectiveness of the authority and try to consider its perspective as one of the most important. The authority can help to understand better such concepts like social engagement, social empowerment, or even the necessity to interact in a real life and virtually. The development of the authority’s worth in regard to the People’s pillar can explain the necessity of the technological progress. And it proves one of the main rules of entrepreneurial sustainability that all three pillars are interrelated and can help a company to benefit only in case they are regarded altogether. The social pillar is the possibility to unite available economic factors with the environmental factors.
Environmental Sustainability
The evaluation of the last pillar should help to clarify how the environmental sector has to be accepted by SMEs and what Saudi Arabian managers can do in order to improve it. The new authority is a chance to learn more about what the Planet pillar is all about. It is possible to identify the ways of how managers can be educated using the available materials and ideas. The authority can enhance the development of a new business and redevelop the program in accordance with the needs of a new company. The authority is also able to promote an understanding of the importance of the environmental sector in SME. Certain programs can be developed to explain why such departments as marketing, manufacturing, and managing have to be developed thoroughly.
The environmental impact has to be taken seriously by all SMEs. The authority is to chance to unite the SMEs and provide them with the same goal. Environmental sustainability can be defined the level of competitiveness demonstrated by the SMEs. As soon the author can regulate the SME sector, it may create a considerable contribution to the country’s economy and GDP level. It can be possible to create jobs and provide SMEs with the possibilities to choose and be confident in the decisions made. The support offered by the authority is a unique chance to make the environmental sector of sustainability more appropriate for the development of economic and social platforms for the SMEs.
Study Limitations
The first limitation of the study is the focus on the cross-sectional analysis of data instead of the longitudinal analysis of the managers’ visions and use of different entrepreneurial marketing dimensions to influence sustainability. The study represents the results that are credible only for the concrete period of time, and changes in the Saudi Arabian policies regarding SMEs can result in modifications of the strategies to address entrepreneurial marketing dimensions and achieve the business sustainability. From this point, the findings illustrate the situation typical of the Saudi Arabian SMEs only for the concrete period of time. The other limitation is associated with the choice of types of SMEs to participate in the study. The respondents work in SMEs operating in the Manufacturing, Retail/Wholesale, and Services sectors of Saudi Arabia business environment. Therefore, the study conclusions are most relevant for these concrete sectors, and propositions regarding the improvements in policies are also related to these business areas.
The next limitation is related to the necessity of removing the environmental factor from discussing business sustainability in SMEs in Saudi Arabia because the managers from the selected companies indicated that their firms do not work directly to change the environmental factor while focusing on the sustainable development. Finally, the data analysis tool selected for the study allows the discussion of causal relationships to represent the particular directions in them, but it is impossible to study the relationships between entrepreneurial marketing dimensions while setting opposite directions for variables.
Finally, there is a considerable limitation of the sample size. Though it can be more than 200 respondents chosen for research, the final solution is made and cannot be changed. The participation of a definite number of people creates a serious limitation because it is impossible to analyze the public opinion. It is hard to consider the level of effectiveness of their responses without their personal preferences and prejudices in regards to the development of SME business. The managers have the acceptable range and share their opinions in the required way. However, the number of participants is predetermined, and it is impossible to predict what kind of results could be achieved with more people.
Future Research Directions
In spite of the fact that the current research addressed the gap in the discussion of the relationship between entrepreneurial marketing and sustainability not presented in the past studies, there are still areas that require the further research. First, the future research can explore the relationship between entrepreneurial marketing and sustainability while using another type of study in order to determine how changes in managers’ manipulations of EM dimensions can affect the sustainable development of SMEs in Saudi Arabia. Second, the future study can explore the reference to entrepreneurial marketing in SMEs while involving the larger number of respondents from different sectors to generalise the conclusions for the whole sector of SMEs in Saudi Arabia that currently develops with the support of the government. Additionally, the further research is important to pay more attention to the inter-relationships of EM dimensions and their role in affecting the business sustainability. The reason for the further research is in the fact that entrepreneurial marketing dimensions can influence each other in different combinations, and to guarantee that managers choose the most advantageous patterns to increase sustainability, it is necessary to expand the number of studied paths and their directions while finding the relationships between entrepreneurial marketing dimensions applied in Saudi Arabian SMEs.
Besides, it is necessary to underline the fact that the current study and the model chosen for the analysis help to prove the validity of the information got. That is why it is recommended to examine each sustainability pillar separately and clarify their peculiarities. It should help to explore the concept of business sustainability and explain how each pillar defines the quality of sustainability of the SMEs. In this project, one model has been used to construct the evaluation of sustainability. Though Structural Equation Modeling is a powerful means to rely on, it is wrong to reject the possible effectiveness of other models. It may happen that the consideration of other available models and understanding the essence of business sustainability for Saudi Arabia SMEs can lead to some new achievements and results. For example, the idea of MANOVA analysis can be offered. This type of analysis is appropriate for the evaluation of dependent measures that may constitute a variable system. It is possible to consider the pillars of sustainability as the dependent factors that have to be analyzed accordingly. However, MANOVA should not be regarded as the only appropriate method. Further researchers are able to come to their own conclusions on how to discuss the peculiarities of the business sustainability system.
One more suggestion is to pay more attention to such dimensions like risk calculation and opportunities of the interrelationship of EM. It is possible to get more insight on the problem under consideration and understand what steps can be taken more to improve the relations that exist between different EM dimensions. Though such dimensions as proactiveness, resources, and innovativeness are defined as those that can enhance business sustainability in a variety of way, it is still possible to identify other dimensions and explain how their development can influence the quality of SMEs’ sustainability.
Finally, it is necessary to remember that there many other predictions that can affect SMEs sustainability. In spite of the fact that EM is a significant concept for consideration, it is not enough to rely on it in order to comprehend what business sustainability is and how it can be developed. That is why it is possible to pay more attention to such issues as marketing orientation or entrepreneurial orientation construct. Many other types of prediction can lead to some positive changes and impacts as well. Further researchers have to understand this possibility and try to achieve some new results in their surveys to prove that business sustainability is a concept with multiple dimensions that cannot be neglected all the time. There are many factors that may be identified in the analysis of business sustainability. For example, it is possible to compare private and federal policies and explain how different types of funding can influence business sustainability. The technological aspect and the necessity to follow the current technological progress can be used as the basis for the analysis as well. Finally, the possibility to use integrated reports can become another crucial de-facto of business sustainability. With the help of such report, business sustainability may be improved in terms of communication or other social factors. Environmental psychology may become a new aspect to rely on. The current project is one of the opportunities to study better the pillars of business sustainability. Still, it is not enough to rely on them only because business sustainability can be explained by various issues regarding the recent achievements and discoveries.
Conclusion
The objectives of this study were to examine the predictive effect of certain EM dimensions on each other and on the business sustainability in SMEs located in Saudi Arabia. The findings indicate that in the context of Saudi Arabia, proactiveness and resource leveraging have a positive impact on the increasing the potential for business sustainability, but innovativeness has no actual impact on sustainability. Even if this factor is taken into account, the presented relationship is negative. The analysis of these findings helps to understand that the reason is in the Saudi Arabian context, where SMEs lack the focus on innovativeness as the process of using new technologies and any other innovations. The study also demonstrates that the inter-relationship between entrepreneurial marketing dimensions exists, and it can have the significant effect on business sustainability.
Thus, it is found that customer intensity leads to proactiveness, and then, to sustainability. In this context, managers can find out that customer intensity is even more influential than the value creation to affect proactiveness, innovativeness, and resource leveraging. These conclusions regarding the effective combinations of entrepreneurial marketing dimensions and their inter-relationships also contribute to the existing theoretical knowledge regarding the relationship between entrepreneurial marketing and sustainability. From this point, it is important to state that the current study contributed to the research debates on the problem of sustainability in SMEs and to the discussion of the relationship between entrepreneurial marketing and business sustainability, as it is realised in the complicated context of the Saudi Arabian developing economy. The managers can utilise the results of the research in order to improve their practices and approaches to choosing the tools for promoting the sustainable development in the company.
References
Abdullah, N. H., Mei, Y. S., Shamsuddin, A. & Wahab, E. 2014. The Relationship between Entrepreneurial Orientation (EO) and Organizational Innovativeness among Small and Medium Enterprises (SMEs) in Malaysia. Australian Journal of Basic & Applied Sciences 8(5): 199-206.
Achoui, M. 2009. Human Resource Development in Gulf Countries: An Analysis of the Trends and Challenges Facing Saudi Arabia. Human Resource Development International 12(1), 35-46.
Ahmad, S. 2012. Micro, Small and Medium-Sized Enterprises Development in the Kingdom of Saudi Arabia. World Journal of Entrepreneurship, Management and Sustainable Development 8(4): 217-232.
Ahrholdt, D. C. 2011. Empirical Identification of Success-Enhancing Website Signals in E-Tailing: An Analysis Based on Known E-Tailers and the Theory of Reasoned Action. Journal of Marketing Theory and Practice 19(4): 441–458.
Al-Jasser, M. 2011. Small and Medium Enterprises. London: Institute of Banking.
Allurentis Limited. 2013. Saudi Arabia 2013-2014: Discovering Business. London: Allurentis Limited.
Al-Mahdi, H. 2010. The Role of Higher Educational Institutions in Saudi Arabia in Promoting Entrepreneurship Education and Development. London: Brunel Business School.
Alsaleh, A. 2012. Exploring Strategies for Small and Medium Enterprises in Saudi Arabia. RIBM Doctoral Symposium 3(1): 1-13.
Alsamari, A., Slade, H., Sharif, M. & Saleh, W. 2013. The SMEs Challenges and Opportunities in Bahrain and Saudi Arabia. International Journal of Computer Networks and Wireless Communications 3(2): 107-118.
Amoah-Manseh, A. 2013. Strategic Resources and Performance of Rural SMEs. International Journal of Business and Social Research 3(4): 106-119.
Anderson, R. E. & Swaminathan, A. 2011. Customer Satisfaction and Loyalty in E-markets: A PLS Path Modeling Approach. Journal of Marketing Theory and Practice 19(2): 221–234.
Arab News. 2015. New SME Body Will Generate Jobs for Saudis. Web.
Aragon-Correa, J., Hurtado-Torres, N., Sharma, S. & Garcia-Morales, V. 2008. Environmental Strategy and Performance in Small Firms: A Resource-Based Perspective. Journal of Environmental Management 86(1): 88-103.
Arend, R. J. 2014. Social and Environmental Performance at SMEs: Considering Motivations, Capabilities, and Instrumentalism. Journal of Business Ethics 1(2): 1-21.
Asif, M., Searcy, C., Zutshi, A. & Ahmad, N. 2011. An Integrated Management Systems Approach to Corporate Sustainability. European Business Review 23(4): 353-367.
Astrachan, C. B., Patel, V. K. & Wanzenried, C. 2014. A Comparative Study of CB-SEM and PLS-SEM for Theory Development in Family Firm Research. Journal of Family Business Strategy 5(1): 116–128.
Atkinson, G. 2000. Measuring Corporate Sustainability. Journal of Environmental Planning and Management 43(2): 235-252.
Avram, D. O. & Kuhne, S. 2008. Implementing Responsible Business Behaviour from a Strategic Management Perspective: Developing a Framework for Austrian SMEs. Journal of Business Ethics 82(1): 463–475.
Ayeyemi, L. 2013. Industrial Development in Developing Nations: A Case Study of Nigerian Small and Medium Business Enterprises. Helsinki: SAVONIA.
Bahaddad, A., Houghton, L. & Drew, S. 2013. Attracting Customer in Saudi Arabia to Buy from Your Business Online. International Journal of Business and Management 8(7): 65-81.
Bansal, P. & Clelland, I. 2004. Talking Trash: Legitimacy, Impression Management, and Unsystematic Risk in the Context of the Natural Environment. Academy of Management Journal 47(1): 93-103.
Barrett, H., Baalloun, J. & Weinsten, A. 2000. Marketing Mix Factors as Moderators of the Corporate Entrepreneurship. Journal of Marketing Theory and Practice 8(2): 50-62.
Becherer, R. C., Haynes, P. J. & Helms, M. M. 2008. An Exploratory Investigation of Entrepreneurial Marketing in SMEs: The Influence of the Owner/Operator. Journal of Business and Entrepreneurship 20(2): 44-63.
Becherer, R. C., Helms, M. M. & McDonald, J. P. 2012. The Effect of Entrepreneurial Marketing on Outcome Goals in SMEs. New England Journal of Entrepreneurship 15(1): 7-18.
Becker, J.-M., Klein, K. & Wetzeels, M. 2012. Hierarchical Latent Variable Models in PLS-SEM: Guidelines for Using Reflective-Formative Type Models. Long Range Planning 45(1): 359–394.
Berghman, L., Matthyssens, P., Streukensand, S. & Vandenbempt, K. 2013. Deliberate Learning Mechanisms for Stimulating Strategic Innovation Capacity. Long Range Planning 46(1): 39–71.
Berns, M., Townend, A., Khayat, Z., Balagopal, B., Reeves, M. & Hopkins, M. S. 2009. The Business of Sustainability: What It Means to Managers Now. MIT Sloan Management Review 51(1): 20–26.
Berry, C. 2011. The Sustainable Procurement Guide. London: British Standard Institute.
Bettiol, M., Di Maria, E. & Finotto, V. 2012. Marketing in SMEs: The Role of Entrepreneurial Sensemaking. International Entrepreneurship and Management Journal 8(2): 223-248.
Beverland, M., Farrelly, F. & Woodhatch, Z. 2007. Exploring the Dimensions of Proactivity within Advertising Agency-Client Relationships. Journal of Advertising 36(4): 49–60.
Blocker, C., Flint, D., Myers, M. & Slater, S. 2010. Proactive Customer Orientation and Its Role for Creating Customer Value in Global Markets. The Journal of the Academy of Marketing Science 39(2): 216-233.
Bowonder, B., Dambal, A., Kumar, S. & Shirodkar, A. 2010. Innovation Strategies for Creating Competitive Advantage. Research-Technology Management 53(3): 19-32.
Bresciani, S., Thrassou, A. & Vrontis, D. 2011. The Link between Family Business and Innovation: Evidence from an Italian Sample. Business Research Challenges in a Turbulent Era 2(10): 290-307.
Brilius, P. 2010. Economic Crisis and SMEs Sustainability Policies: Application of Emotional Well-Being Function for Analysis. Journal of Advanced Research in Management 1(1): 18-29.
Bruton, D. & Ahlstrom, D. 2010. Institutional Theory and Entrepreneurship: Where Are We Now and Where Do We Need to Move in the Future? ETP 5(2): 421–440.
Bruton, G., Ahlstrom, D. & Puky, T. 2009. Institutional Differences and the Development of Entrepreneurial Ventures: A Comparison of the Venture Capital Industries in Latin America and Asia. Journal of International Business Studies 40(1): 762-778.
Bryman, A. & Bell, E. 2015. Business Research Methods. Boston, MA: Oxford University Press.
Burns, T. & Stalker, G. M. 1961. The Management of Innovation. London: Tavistock.
Buttermann, G., Germaina, R. & Iyer, K. 2008. Contingency Theory “Fit” as Gestalt: An Application to Supply Chain Management. Transportation Research Part E: Logistics and Transportation Review 44(6): 955-69.
Canina, L., Palacios, D. & Devece, C. 2012. Management Theories Linking Individual and Organizational Level Analysis in Entrepreneurship Research. International Entrepreneurship and Management Journal 8(3): 271–284.
Cavagnaro, E. & Curiel, G. 2012. The Three Levels of Sustainability. Sheffield: Greenleaf Publishing.
Challagalla, G., Venkatesh, R. & Kohli, A. 2009. Proactive Postsales Service: When and Why Does It Pay Off? Journal of Marketing 73(2): 70-87.
Chen, L.-J., Chen, C.-C. & Lee, W.-R. 2008. Strategic Capabilities, Innovation Intensity, and Performance of Service Firms. Journal of Service Science and Management 1(1): 111–122.
Chin, W. 1998. The Partial Least Squares Approach for Structural Equation Modeling. Mahwah: Lawrence Erlbaum.
Chin, W. 2010. “How to Write Up and Report PLS Analyses”, in Esposito, V.V., Chin, W.W., Henseler, J. and Wang, H. (Eds), Handbook of Partial Least Squares: Concepts, Methods and Applications in Marketing and Related Fields. pp. 655-690. Berlin: Springer.
Choi, Y., & Yu, Y. 2014. The Influence of Perceived Corporate Sustainability Practices on Employees and Organizational Performance. Sustainability, 6(1): 348-364.
Cohen, J. 1988. Statistical Power Analysis for the Behavioral Sciences. Mahwah: Lawrence Erlbaum.
Collinson, E. & Shaw, E. 2001. Entrepreneurial Marketing – a Historical Perspective on Development and Practice. Management Decision 39(9): 761-766.
Creswell, J. W. 1994. Research Design. Thousand Oaks: Sage Publications.
Creswell, J. W. 2009. Research Design: Qualitative, Quantitative, and Mixed Methods Approaches. Los Angeles: Sage Publications.
Danish, A. Y. & Smith, H. L. 2012. Female Entrepreneurship in Saudi Arabia: Opportunities and Challenges. International Journal of Gender and Entrepreneurship 4(3): 216-235.
De Vaus, D. 2013. Surveys in Social Research. New York, NY: Routledge.
Delai, I. & Takahashi, S. 2011. Sustainability Measurement System: A Reference Model Proposal. Social Responsibility Journal 7(3): 438-471.
Delmas, M. & Toffel, W. 2004. Stakeholders and Environmental Management Practices: An Institutional Framework. Business Strategy Environment 13(1): 209–222.
Delmas, M. 2002. The Diffusion of Environmental Management Standards in Europe and the United States: An Institutional Perspective. Policy Sciences 35(1): 91–119.
Diamantopoulos, A. & Winklhofer, H. M. 2001. Index Construction with Formative Indicators: An Alternative to Scale Development. Journal of Marketing Research 38(2): 269-277.
DiMaggio, P.J. & Powell, W.W. 1983. The Iron Cage Revisited: Institutional Isomorphism and Collective Rationality in Organizational Fields. American Sociological Review 48(1): 147–160.
Dobni, C. B. 2010. Achieving Synergy between Strategy and Innovation: The Key to Value Creation. International Journal of Business Science & Applied Management 5(1): 48-58.
Dyer, L. M., & Ross, C. A. 2008. Seeking advice in a dynamic and complex business environment: Impact on the success of small firms. Journal of Developmental Entrepreneurship, 13(02): 133-149.
Editorial. 2012. Long Range Planning 45(1): 309–311.
Editorial: Partial Least Squares Structural Equation Modeling: Rigorous Applications, Better Results and Higher Acceptance. 2013. Long Range Planning 46(1): 1–12.
Editorial: Partial Least Squares: The better approach to structural equation modeling? 2012. Long Range Planning 45(1): 312–319.
Eggert, A., Ulaga, W. & Schultz, F. 2006. Value Creation in the Relationship Life Cycle: A Quasi-Longitudinal Analysis. Industrial Marketing Management 35(1): 20–27.
Ferguson, D. 2009. Measuring Business Value and Sustainability Performance. Cranfiled: Cranfiled University Doughty Centre for Corporate Responsibility.
Fiksel, J., McDaniel, J. & Mendenhall, C. 1999. Measuring Progress towards Sustainability Principles, Process, and Best Practices.Ohio: Battelle Memorial Institute.
Fiore, A., Nehm, L., Hurst, J., Son, J. & Sadachar, A. 2013. Entrepreneurial Marketing: Scale Validation with Small, Independently-Owned Businesses. Journal of Marketing and Development and Competitiveness 7(4): 63-86.
Fornell, C. & LArcker, D.F. 1981. Evaluating Structural Equation Models with Unobservable Variables and Measurement Error. Journal of Marketing Research 18(1): 39-50.
Franco, M., Santos, M., Ramalho, I. & Nunes, C. 2014. An Exploratory Study of Entrepreneurial Marketing in SMEs: The Role of the Founder-Entrepreneur. Journal of Small Business and Enterprise Development 21(2): 265-283.
Garengo, P. & Bititci, U. 2007. Towards a Contingency Approach to Performance Measurement: An Empirical Study in Scottish SMEs. International Journal of Operations & Production Management 27(8): 802-825.
Gaweł, A. 2012. Entrepreneurship and Sustainability: Do They Have Anything in Common? Poznan University of Economics Review 12(1): 5-16.
Gefen, D., Rigdon, E. E. & Straub, D. 2011.An Update and Extension to SEM Guidelines for Administrative and Social Science Research. MIS Quarterly 35(2): iii–xiv.
George, D. & Mallery, M. 2010. SPSS for Windows Step by Step: A Simple Guide and Reference. Boston: Pearson.
Gilmore, A. 2011. Entrepreneurial and SME Marketing. Journal of Research in Marketing and Entrepreneurship 13(2): 137-145
Gilmore, A., Carson, D. & Grant, K. 2001. SME Marketing in Practice. Marketing Intelligence and Planning 19(1): 6–11.
Gladwin, T. 2010. Shifting Paradigms for Sustainable Development: Implications for Management Theory and Research. Academy of Management Review 20(2): 874-907.
Glover, J., Champion, D., Daniels, K. & Dainty, A. 2014. An Institutional Theory Perspective on sustainable Practices across the Dairy Supply Chain. International Journal of Production Economics 152(2): 102–111.
Grafström, A. 2009. Entropy of Unequal Probability Sampling Designs. Statistical Methodology 7(2): 84–97.
Guderan, S. P., Devinney, T., Richter, N. F. & Ellis, R. S. 2012. Strategic Implications for (Non-Equity) Alliance Performance. Long Range Planning 45(3): 451–476.
Guderan, S. P., Ringle, S. M., Wende, S. & Will, A. 2008. Confirmatory Tetrad Analysis in PLS Path Modeling. Journal of Business Research 61(2): 1238–1249.
Guido, G., Marcati, A. & Peluso, A. 2011. Nature and Antecedents of a Marketing Approach according to Italian SME Entrepreneurs: A Structural Equation Modeling Approach. International Journal of Entrepreneurial Behaviour & Research 17(4): 342-360.
Hacioglu, G., Eren, S. S., Eren, M. S. & Celikkan, H. 2012. The Effect of Entrepreneurial Marketing on Firms’ Innovative Performance in Turkish SMEs. Procedia-Social and Behavioral Sciences 58(2): 871-878.
Hair, J. E., Ringe, C. M. & Starstedt, M. 2011. PLS-SEM: A Silver Bullet. Journal of Marketing Theory and Practice 19(2): 139–151.
Hair, J. E., Starstedt, M., Pieper, T. M. & Ringe, C. M. 2012. The Use of Partial Least Squares Structural Equation Modeling in Strategic Management Research: A Review of Past Practices and Recommendations for Future Applications. Long Range Planning 45(4): 320–340.
Hair, J. E., Starstedt, M., Ringe, C. M. & Mena, L. 2012. An Assessment of the Use of Partial Least Squares Structural Equation Modeling in Marketing Research. Journal of the Academic Marketing Science 40(3): 414–433.
Hair, J. F., Black, W. C., Babin, B. J. & Anderson, R. E. 2010. Multivariate Data Analysis – A Global Perspective. New Jersey: Pearson Prentice Hall.
Hair, J. F., Ringle, C. M. & Sarstedt, M. 2011. PLS-SEM: Indeed a Silver Bullet. Journal of Marketing Theory and Practice 19(2): 139-151.
Hair, J. F., Sarstedt, M., Hopkins, L. & Kuppelwieser, V. 2014. Partial Least Squares Structural Equation Modeling (PLS-SEM): An Emerging Tool In Business Research. European Business Review 26(2): 106-121.
Hair, J., Hult, G.T.M., Ringle, C., & Sarstedt, M. 2013. A Primer On Partial Least Squares Structural Equation Modeling (PLS-SEM). New York, NY: Sage Publications.
Hall, J. K., Daneke, G. A. & Lenox, M. J. 2010. Sustainable Development and Entrepreneurship: Past Contributions and Future Directions. Journal of Business Venturing 25(5): 439-448.
Han, L., Benson, A., Chen, J. & Zhang, S. 2014. The Use and Impacts of Bank Support on UK Small and Medium-Sized Enterprises. International Small Business Journal 32(1): 61-80.
Harrigan, P., Ramsey, E. & Ibbotson, P. 2011. Entrepreneurial Marketing in SMEs: The Key Capabilities of E-CRM. Journal of Research in Marketing and Entrepreneurship 14(1): 40-64.
Hauser, J. & Shugan, S. 1980. Intensity Measures of Consumer Preference. Operations Research 28(2): 278-320.
Henseler, J. 2012. Why Generalized Structured Component Analysis is not Universally Preferable to Structural Equation Modeling. Journal of the Academy of Marketing Science 40(4): 402–413.
Henseler, J. & Sarstedt, M. 2013. Goodness-of-Fit indices for Partial Least Squares Path Modelling. Computational Statistics 28(2): 565-580.
Henseler, J., Ringle, C. M. & Sinkovics, R. R. 2009. The Use of Partial Least Squares Path Modeling in International Marketing. New Challenges to International Marketing Advances in International Marketing 20(3): 277–319.
Hertog, S. 2010. Benchmarking SME Policies in the GCC: A Survey of Challenges and Opportunities. Brussels: Eurochambres.
Hills, G. & Hultman, C. M. 2011. Academic Roots: The Past and Present of Entrepreneurial Marketing. Journal of Small Business & Entrepreneurship 24(1): 1-10.
Hills, G., Hultman, C. M. & Miles, P. 2008. The Evolution and Development of Entrepreneurial Marketing. Journal of Small Business Management 46(1): 103-104.
Holton, E. H. & Burnett, M. B. 1997. “Qualitative Research Methods”. In Human Resource Development Research Handbook: Linking Research and Practice, eds. R. A. Swanson and E. F. Holton. San Francisco: Berrett-Koehler Publishers
Hult, G. T. 2011. Market-Focused Sustainability: Market Orientation Plus. Journal of the Academy of Marketing Science 39(1): 1-6.
Hultman, C. M. & Hills, G. E. 2011. Influence from Entrepreneurship in Marketing Theory. Journal of Research in Marketing and Entrepreneurship 13(2): 120‐125.
Ibeh, K. 2003. Toward a Contingency Framework of Export Entrepreneurship: Conceptualisations and Empirical Evidence. Small Business Economics 20(1): 49-68.
Ionita, D. 2012. Entrepreneurial Marketing: A New Approach for Challenging Times. Management & Marketing 7(1): 131-135.
Jakobowicz, E. & Derquenne, C. 2007. A Modified PLS Path Modeling Algorithm Handling Reflective Categorical Variables and a New Model Building Strategy. Computational Statistics & Data Analysis 51(2): 3666–3678.
Jones, R. & Rowley, J. 2011. Entrepreneurial Marketing in Small Businesses: A Conceptual Exploration. International Small Business Journal 29(1): 25–36.
Jones, R. & Rowley, J. 2009. Presentation of a Generic ‘EMICO’ Framework for Research Exploration of Entrepreneurial Marketing in SMEs. Journal of Research in Marketing and Entrepreneurship 11(1): 5-21.
Kesper, A. 2001. Failing or not Aiming to Grow? Manufacturing SMMEs and Their Contribution to Employment Growth in South Africa. Urban Forum 12(2): 171-203.
Ketokivi, J. 2006. Elaborating the Contingency Theory or Organisations: The Case of Manufacturing Flexibility Strategies. Production and Operations Management 15(2): 215-228.
Khan, A. E., Dewan, N. M. A. & Chowdury, M. H. 2014. Developing Instrument for E-business Sustainability Construct. Malaysia: Malaysia Conference 2014 Publishing.
Kickul, J. & Gundry, L. 2002. Prospecting for Strategic Advantage: The Proactive Entrepreneurial Personality and Small Firm Innovation. Journal of Small Business Management 40(2): 85-97.
Klewitz, J. & Hansen, E. G. 2014. Sustainability-Oriented Innovation of SMEs: A Systematic Review. Journal of Cleaner Production 65(1): 57-75.
Kongolo, M. 2010. Job Creation versus Job Shedding and the Role of SMEs in Economic Development. African Journal of Business Management 4(11): 2288-2295.
Kraus, P. & Britzelmaier, B. 2012. Corporate Sustainability Management: Evidence from Germany. Journal of Global Responsibility 3(2): 248-262.
Kraus, S., Harms, R. & Fink, M. 2010. Entrepreneurial Marketing: Moving beyond Marketing in New Ventures. Entrepreneurship and Innovation Management 11(1): 19-34.
Kurgun, H., Bagiran, D., Ozeren, E. & Maral, B. 2011. Entrepreneurial Marketing – The Interface between Marketing and Entrepreneurship: A Qualitative Research on Boutique Hotels. European Journal of Social Sciences 26(3): 340-357.
Lahtinen, J. 2013. SME View on Project Marketing-Case Study in the Context of Institutional Space Business. Helsinki: Aalto University.
Lai, H., Wong, C. & Cheng, T. 2006. Institutional isomorphism and the adoption of information technology for supply chain management. Computering Industries 57(1): 93–98.
Lawrence, P.R. & Lorsch, J.W. 1967. Organization and Environment: Managing Differentiation and Integration. Boston, MA: Harvard University.
Lawrence, S., Collins, E., Pavlovich, K. & Arunachalam, M. 2006. Sustainability Practices of SMEs: The Case of NZ. Business Strategy and the Environment 15(4): 242-257.
Li, H., Zhang, Y. & Chan, T. 2005. Entrepreneurial Strategy Making and Performance in China’s New Technology Ventures – The Contingency Effect of Environments and Firm Competences. Journal of High Technology Management Research 16(1): 37-57.
Loucks, E. S., Martens, M. L. & Cho, C. H. 2010. Engaging Small-And Medium-Sized Businesses in Sustainability. Sustainability Accounting, Management and Policy Journal 1(2): 178-200.
Majid, I. A. & Koe, W. L. 2012. Sustainable Entrepreneurship (SE): A Revised Model Based on Triple Bottom Line (TBL). International Journal of Academic Research in Business and Social Sciences 2(6): 293-310.
Manolova, T., Eunni, R. & Gyoshev, B. 2008. Institutional Environments for Entrepreneurship: Evidence from Emerging Economies in Eastern Europe. Entrepreneurship Theory and Practice 32(1): 203-218.
Marray, D. 2015. Saudi Arabia and UK Share Expertise to Foster Enterprises. Arab News. Web.
Mark Ware Consulting Ltd. 2009. UK Small and Medium-Sized to Professional and Academic Information. Bristol: Publishing Research Consortium.
Martin, D. 2009. The Entrepreneurial Marketing Mix. Qualitative Market Research: An International Journal 12(4): 391-403.
Maser, C. 2012. Decision-Making for a Sustainable Environment: A Systemic Approach. Boca Raton: Taylor & Francis.
Masurel, E. 2007. Why SMEs Invest in Environmental Measures: Sustainability Evidence from Small and Medium-Sized Printing Firms. Business Strategy and the Environment 16(3): 190-201.
McAdam, R. 2000. The Implementation of Reengineering in SMEs: A Grounded Study. Small Business Journal 18(1): 29-45.
Meyer, J. W. & Scott, W. R. 1983. Organizational Environments: Ritual and Rationality. Beverly Hills, CA: Sage Publications.
Mitchelmore, S. & Rowley, J. 2010. Entrepreneurial Competencies: A Literature Review and Development Agenda. International Journal of Entrepreneurial Behaviour & Research 16(2): 92-111.
Mitra, S., Dhar, S. & Agrawal, K. M. 2008. Assessment of Corporate Environmental Proactiveness. South Asian Journal of Management 15(3): 101-135.
Money, K., Hillenbrand, J. H. & Camara, N. 2012. Exploring Unsatisfied Consequences of Strategy amongst Stakeholder Segments: The Case of European Revenue. Long Range Planning 45(2): 395–423.
Moore, S. & Manring, S. 2009. Strategy Development in Small and Medium Sized Enterprises for Sustainability and Increased Value Creation. Journal of Cleaner Production 17(1): 276-282.
Morris, M. H. Schindehutte, M. & LaForge, R. W. 2002. Entrepreneurial Marketing: A Construct for Integrating Emerging Entrepreneurship and Marketing Perspectives. Journal of Marketing Theory and Practice 10(4): 1–19.
Morrish, S. 2011. Entrepreneurial Marketing: A Strategy for the Twenty-First Century? Journal of Research in Marketing and Entrepreneurship 13(2): 110-119.
Mort, G., Weerawardena, J. & Liesch, P. 2008. Advancing Entrepreneurial Marketing: Evidence from Born Global Firms. European Journal of Marketing 46(3): 542-561.
Motwani, J., Levenburg, N. & Schwarz, T. 2006. Succession Planning in SMEs. International Small Business Journal 24(5): 471-495.
Müller, A. L. & Pfleger, R. 2014. Business Transformation towards Sustainability. Business Research 7(2): 313-350.
Nasr, S., & Rostom, A. 2013. SME Contributions to Employment, Job Creation, and Growth In The Arab World. Washington: World Bank.
Neuman, W. L. 2003. Social Research Methods: Qualitative and Quantitative. New York: Pearson Education Inc.
Newby, R., Watson, J. & Woodliff, D. 2003. SME Survey Methodology: Response Rates, Data Quality, and Cost Effectiveness. Entrepreneurship: Theory & Practice 28(2): 163–172.
Nkamnebe, A. 2011. Sustainability Marketing in the Emerging Markets: Imperatives, Challenges, and Agenda Setting. International Journal of Emerging Markets 6(3): 217-232.
Noor, A. 2012. Exploring New Factors and the Question of ‘Which’ in User Acceptance Studies of Healthcare Software. Nottingham: The University of Nottingham.
OECD. 2009. The Impact of the Global Crisis on SME and Entrepreneurship Financing and policy Responses. Paris: OECD Publishing.
Oribu, W.,King’oriah, G., Agwata, J. & Gongera, E. 2014. Business Sustainability: A Need to Re-Look Environmental Practices and Initiatives. European Journal of Business Management 6(3): 143-152.
Parrish, B. D. 2010. Sustainability-Driven Entrepreneurship: Principles of Organization Design. Journal of Business Venturing 25(5): 510-523.
Pojasek, R. 2007. A Framework for Business Sustainability. Environmental Quality Management 17(2): 81-88.
Punch, K.F. 2013. Introduction To Social Research: Quantitative And Qualitative Approaches. New York, NY: Sage.
Raduan, C. R., Jegak, U., Haslinda, A. & Alimin, I. 2009. A Conceptual Framework of the Relationship between Organizational Resources, Capabilities, Systems, Competitive Advantage and Performance. Research Journal of International Studies 12(1): 45-58.
Ramachandran, J., Mukherji, S. & Sud, M. 2006. Strategic Entrepreneurship in a Globalising Economy: Evidence from Emerging Economies. IIMB Management Review 28(3): 291-302.
Rezvani, M. & Khazaei, M. 2013. Evaluation of Entrepreneurial Marketing Dimensions According to Characteristics of Institutions: Institutions Age and Size. International Journal of Basic Sciences & Applied Research 3(4): 207-213.
Rigdon, E. E. 2012. Rethinking Partial Least Squares Path Modeling: In Praise of Simple Methods. Long Range Planning 45(2): 314–358.
Ringle, C. M., Starstredt, M. & Straub, D. W. 2012. A Critical Look at the Use of PLS-SEM. MIS Quarterly 36(1): iii–xiv.
Rivera, J. 2004. Institutional Pressures and Voluntary Environmental Behavior in Developing Countries: Evidence from the Costa Rican Hotel Industry. Social Natural Resources 17(2): 779–797.
Riyadh Chamber Commerce & Industry. 2011. Small and Medium Enterprises in Saudi Arabia. Saudi Arabia: RCCI Publishing.
Rocha, R., Subika, F., Khouri, R. & Pearce, D. 2011. The status of bank lending to SMEs in the Middle East and North Africa region: Results of a joint survey of the Union of Arab Bank and the World Bank. Washington: World Bank.
Romero, D. & Molina, A. 2009. Value Co-Creation and Co-Innovation: Linking Networked Organisations and Customer Communities, Leveraging Knowledge for Innovation. IFIP Advances in Information and Communication Technology 307(1): 401-412.
Rubin, A. & Babbie, E. 2009. Essential Research Methods for Social Work. New York, NY: Cengage Learning.
Sadi, M. A. & Iftikhar, Q. 2011. Factors Critical to the Success of Small-Medium Sized Business Marketing: A View from the Tourism Industry in Saudi Arabia. African Journal of Marketing Management 3(9): 226-232.
Sarma, M., Septiani, S., Dewi, F. & Siregar, E. 2013. The Impact of Entrepreneurial Marketing and Business Development on Business Sustainability: Small and Household Footwear Industries in Indonesia. International Journal of Marketing Studies 5(4): 110-120.
Saudi Arabian Monetary Agency. 2010. Small and Medium Enterprises. Saudi Arabia: SAMA Publishing.
Saudi-US Relation Information Service. 2011. Boosting Small and Medium Enterprises in Saudi Arabia. Saudi Arabia: SUSRIS.
Sawhney, M., Verona, G. & Prandelli, E. 2005. Collaborating to Create: The Internet as a Platform for Customer Engagement in Product Innovation. Journal of interactive marketing 19(4): 4-17.
Schumacker, R. E. & Lomax, R. G. 2004. A Beginner’s Guide to Structural Equation Modeling. Mahwah: Lawrence Erlbaum Associates, Inc.
Sekaran, U. 2003. Research Methods for Business. Hoboken: John Wiley and Sons.
Sekaran, U. & Bougie, R. 2010. Research Methods for Business: A Skill Building Approach. New Jersey: John Wiley and Sons.
Setia, P., Venkatesh, V. & Joglekar, S. 2013. Leveraging digital technologies: How information quality leads to localized capabilities and customer service performance. MIS Quarterly 37(2): 565-590.
Shalaby, N. 2004. SMEs Developments Saudi Arabia. Dammam: Eastern Province Chamber of Commerce and Industry Publishing.
Shalaby, N. 2010. SMEs Capabilities and Needs Assessment Eastern Province, Saudi Arabia. Saudi Arabia: Eastern Province Chamber of Commerce and Industry.
Sharma, G. 2011. Do SMEs Need to Strategize? Business Strategy Series 12(4): 186-194.
Simba, A. & Ndlovu, T. 2015. The Entrepreneurial Marketing Management and Commercialization Arrangements of Born-Global Bio-Enterprises: The Case of UK Companies. Journal of Small Business and Entrepreneurship 27(2): 143-157.
Simpson, M., Taylor, N. & Barker, K. 2004. Environmental Responsibility in SMEs: Does It Deliver Competitive Advantage? Business Strategy and the Environment 13(3): 156-171.
Sivakumar, A. D. & Sarkar, S. 2012. Women Entrepreneurs in Small and Medium Scale Businesses in Saudi Arabia. International Journal of Finance & Policy Analysis 4(1): 25-38.
Sodhi, K. 2011. Has Marketing Come Full Circle: Demarketing for Sustainability. Business Strategy Series 12(4): 177-185.
Sole, M. 2013. Entrepreneurial Marketing: Conceptual Exploration and Link to Performance. Journal of Research in Marketing and Entrepreneurship 15(1): 23-38.
Starik, M. & Kanashiro, P. 2013. Toward a Theory of Sustainability Management: Uncovering and Integrating the Nearly Obvious. Organization & Environment 26(1): 7-30.
Stefanović, I., Prokic, S. & Rankovic, L. 2010. Motivational and Success Factors of Entrepreneurs: The Evidence from a Developing Country. Journal of Economics and Business 28(2): 251-269.
Stevens, C. 2009. Measuring Sustainable Development. Paris: OECD Publishing.
Stokes, D. 2000. Putting Entrepreneurship into Marketing: The Process of Entrepreneurial Marketing. Journal of Research in Marketing & Entrepreneurship 2(1): 10-20.
Stonebraker, P. & Afifi, R. 2004. Toward a ContingencyTheory of Supply Chains. Management Decision 42(9): 1131-44.
Sull, D. & Escobari, M. 2004. Creating Value in an Unpredictable World. Business Strategy Review 15(3): 14–20.
Székely, F. & Knirsch, M. 2005. Responsible Leadership and Corporate Social Responsibility: Metrics for Sustainable Performance. European Management Journal 23(6): 628-647.
Tambunan, T. 2008. SME development, economic growth, and government intervention in a developing country: The Indonesian story. Journal of International Entrepreneurship 6(4): 147-167.
Tanev, S., Bailetti, T., Allen, S., Milyakov, H., Durchev, P. & Ruskov, P. 2011. How Do Value Co-Creation Activities Relate to the Perception of Firms’ Innovativeness? Journal of Innovation Economics & Management 1(7): 131-153.
The EU-GCC Chamber Forum. 2010. Benchmarking SME Policies in the GCC: A Survey of Challenges and Opportunities. London: EU-GCC.
Theyel, G. & Hofmann, K. 2012. Stakeholder Relations and Sustainability Practices of US Small and Medium-Sized Manufacturers. Management Research Review 35(12): 1110-1133.
Tolbert, P., David, R. & Sine, W. 2011. Studying Choice and Change: The Intersection of Institutional Theory and Entrepreneurship Research. Organization Science 22(5): 1332–1344.
Urban, B., & Naidoo, R. 2012. Business sustainability: empirical evidence on operational skills in SMEs in South Africa. Journal of Small Business and Enterprise Development 19(1): 146-163.
Vanormelingen, S. & Cassiman, B. 2013. Profiting from Innovation: Firm Level Evidence on Markups. Flanders: KU Leuven.
Vevela, V. & Ellenbecker, E. 2000. A Proposal for Measuring Business Sustainability: Addressing Shortcomings in Existing Networks. General Management International 3(7) : 101–110.
Vrontis, D., Thrassou, A., Chebbi, H. & Yahiaoui, D. 2012. Transcending Innovativeness towards Strategic Reflexivity. Qualitative Market Research: An International Journal 15(4): 420-437.
Wallnofer, M. & Hacklin, F. 2013. The Business Model in Entrepreneurial Marketing: A Communication Perspective on Business Angels’ Opportunity Interpretation. Industrial Marketing Management 42(5): 755–764.
Webb, J. W., Ireland, R. D., Hitt, M. A., Kistruck, G. M. & Tihanyi, L. 2011. Where Is the Opportunity without the Customer? An Integration of Marketing Activities, the Entrepreneurship Process, and Institutional Theory. Journal of the Academy of Marketing Science39(4): 537-554.
Welcomer, S. 2011. Reinventing vs. Restoring Sustainability in the Maine Woods: Narratives of Progress and Decline 2010. Organization & Environment 23(2): 55-75.
Wilden, R., Gideran, S. P., Nielsen, B. B. & Lings, I. 2013. Dynamic Capabilities and Performance: Strategy, Structure and Environment. Long Range Planning 46(1): 72–96.
Wu, G., Ding, J. & Chen, P. 2012. The Effects of GSCM Drivers and Institutional Pressures on GSCM Practices in Taiwan’s Textile and Apparel Industry. IJPE 135(2): 618–636.