About the Company
The Domino’s Pizza Group is owned by Domino’s Pizza International Franchising Inc. The company owns a Master Franchise Agreements which provides exclusive rights to sell their products in the UK, the Republic of Ireland, Switzerland, Luxembourg, and Liechtenstein. The company also has associate investments in some parts of the world such as Iceland, Sweden, Norway, and Germany. The company specializes in the making, retailing, and delivery of pizzas and other products. The company has stores across the regions mentioned above. It sells its products through franchises. As of the end of 2012, the company had 805 stores. The number grew to 1,013 stores at the end of 2016. Further, the company had 77 franchises at the end of 2016. Each franchise has an average of 12.9 stores. The company has experienced tremendous growth in revenue between 2012 and 2016. The total revenue in 2016 was £360.58 million. Further, £319.0 million of the total revenue was generated from the UK market. The profit for the year 2016 was £65,154. The company had 995 employees at the end of 2016. This was down from 1,083 the company had in 2016. This treatise seeks to carry out a comprehensive financial analysis of Domino’s Pizza Group.
Analysis of Financial Results
Data
The table presented below shows a summary of financial data for Domino’s Pizza Group. The data were collected from the annual reports of the company.
(Source of data – Domino’s Pizza Group PLC 2017, pp. 72-77)
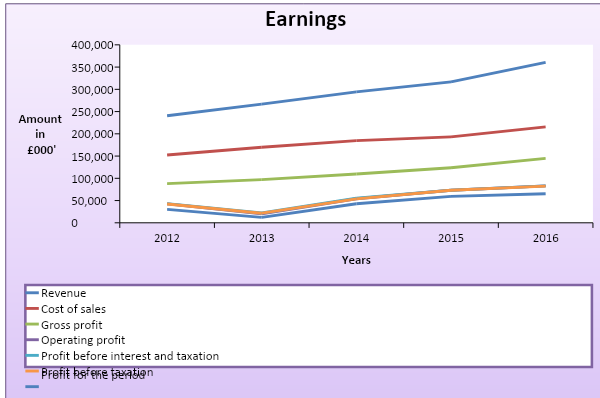
Earnings and Profits
The information presented in the table above indicates that there was growth in revenue. Sales increased from £240,524 in 2012 to £360,577 in 2016. The gross profit also grew gradually from £88,015 in 2012 to £144,858 in 2016. Growth was also reported in operating profit, profit before taxation, and profit for the year with a slight decline in the year 2013. The trend of earnings is displayed in the graph below. In the graph, there is a clear upward trend in the earnings of the company. This can be attributed to the favorable economic environment that caused an increase in consumer spending. The economy has been stable and gross domestic product has been fairly stable over the years. The inflation rates have remained relatively low while the unemployment rate has increased by a small margin. The international economy is expected to improve in the coming years. Thus, it is expected that the performance of the company will grow. The consumer trend in the consumption of fast food has been positive. This has a favorable impact on the bottom line. In addition, there was a significant growth in revenue that is generated from the new stores that were opened within the UK and external markets. The company also acquired the largest pizza delivery chains in Germany. A significant improvement in performance was also reported in the Switzerland market (Domino’s Pizza Group PLC 2017, p. 27). The use of digital platforms and franchising has contributed immensely to growth in revenue.
The table below shows the profitability ratios for the period between 2012 and 2016.
Return on equity, gross profit, operating profit, and net profit margin had a similar trend. The value of the ratios declined in 2013 and later increased between 2014 and 2016. Return on capital employed fluctuated. This can be attributed to the changing values of debt. Generally, the high values of the five profitability ratios give an indication that the company is efficient in managing revenues, operating, and non-operating expenses. The company is also efficient in using capital to generate revenue and income as can be seen in the high values of return on equity and capital employed (Goyal & Goyal 2013, p. 139).
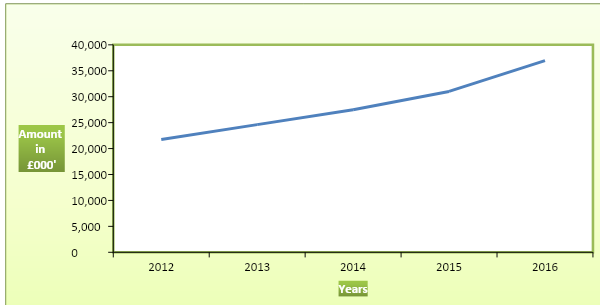
Dividends
The total amount of dividend paid by the company increased from £21,746 in 2012 to £36,963 in 2016. The dividend paid per share also grew despite the increase in the number of shares. The basic and diluted earnings per share grew during the 5 year period. The amount of dividend paid ranged between 33.75% and 41.85% of net income. The company is considered stable because it pays out less than 50% of the earnings. It has room for growth. The amount of profit that is retained by the company was more than 50% during the five-year period. The dividend coverage ratio ranged between 1.51 and 1.72. The trend of the total dividend paid is displayed in the graph below.
Financial Stability and Liquidity
The liquidity ratios give information on the ability of the company to settle immediate obligations using short-term assets. The values fluctuated and they were low. There was no trend. In 2012, 2013, and 2014, the company was able to pay current liabilities using current assets. However, in 2013 and 2016, the company faced difficulties in settling immediate obligations. This can be attributed to a significant increase in current liabilities and a decline in current assets. The low liquidity ratios can be attributed to the fact that the industry is characterized by a high amount of working capital requirements (Shapiro & Moles 2014, p. 213).
A comparison of debt and equity shows that the amount of equity exceeded debt during the entire five years. The values of debt to equity ratios were high in 2012 and 2013. This can be explained by heavy borrowing during this period. Thereafter, the company experienced a significant decline in 2014 and 2015. The debt level grew again in 2016. The ratio of debt to capital employed followed a similar trend. The company is keen on maintaining a favorable level of gearing ratio because it has a direct effect on other variables such as liquidity and profitability. In addition, a high amount of debt can indicate that the company is facing financial difficulties. The values of interest coverage ratios were high which implies that the company is solvent. Short-term and long-term liquidity ratios are strong indicators of the financial health of an organization. Thus, poor ratios can affect the value of the company. This explains why the company closely monitors the gearing ratios.
There was no trend observed in the efficiency ratios. Inventory days give information on the number of days it takes the company to replenish stock. The value of the ratios implies that the efficiency in managing stock improved in 2013 and 2014 and deteriorated in the subsequent years. The receivables days show that the company was most efficient in collecting amounts due from debtors in 2015 and least efficient in 2012. The values of payable days were quite high and it implies that the company takes a long period to pay creditors. The company had negative values of the working capital cycle. It shows that the company does not make payment for inventories or raw materials until the final product is sold. This implies that there is efficiency in the use of working capital. Based on the three sets of ratios, the company is stable and has a sound financial standing.
News that has Impacted the Company’s Performance
The company reported a lower like-for-like sales growth in the first half of 2017. The results showed that the over-the-counter sales grew by only 2.4% as compared to the 13% growth that was reported during the first half of 2016. Thus, it was below expectation. Further, the results indicated that sales in mature stores dropped by about 3%. The news led to an 8% drop in the share prices to a low of 263.7 pence. This was the lowest share price that was reported by the company since July 2015 (Varghese 2017, p. 1).
Reflection About the Company
Domino’s Pizza Group is recognized as a world leader in pizza delivery. Various journalists and financial reports portray the company as having a good financial performance (Reuters 2017, p. 1). Besides, the entity is keen on growing the number of stores and franchises across the globe. Based on the latest news, the group is aggressive in increasing its global presence and market share (Seeking Alpha 2017, p. 1). These measures have contributed immensely to growth in revenue and profit. The business also generates a lot of revenue through the digital platform. Further, the share prices are perceived to be overvalued. They are trading at a price that is higher than their intrinsic value. The shares are also viewed as a viable investment opportunity because it has room for growth (The Telegraph 2017, p. 1). However, some journalists are skeptical about recommending the company for investment because they are of the opinion that the model and the strategies are not sustainable.
Corporate Governance
The work of the board is supported by three committees. These are Audit, Nomination, and Remuneration Committees. The board of directors of the company has eight members. Out of the eight members, six are non-executive directors. The first non-executive director is Stephen Hemsley. He became a non-executive chairman of the board in 2010. He also chairs the Nomination Committee and AIM-listed Franchise Brands PLC. The second non-executive director is Colin Halpern. He is the vice-chairman of the board. He has contributed immensely to the significant milestones that have been achieved by the company such as the acquisition of the Domino’s Pizza Master Franchise Agreement and the listing of the company on the stock exchange market. The third non-executive director is Steve Barber. He joined the board in July 2015. He chairs the Audit Committee and is also a member of the Remuneration Committee. Having worked in big audit firms such as PricewaterhouseCoopers, Steve has vast experience in accountancy (Domino’s Pizza Group PLC 2017, p. 32). The fourth non-executive director is Kevin Higgins. He was appointed to the board in 2014. Further, he is the chairman of the Remuneration Committee and a member of the Audit Committee. He has vast experience in consumer food in the international markets such as Europe, the United States, and Switzerland among others. The fifth non-executive director is Ebbe Jacobsen. He joined the board in January 2014. He is a member of the Nomination Committee. He has experience in operating in Germany and other European countries. The last non-executive director is Helen Keays. She is also a Senior Independent Director. Helen joined the board in 2011. Further, she is a member of the three committees. Helen has experience in various industries such as travel, telecoms, retail, and consumer markets (Domino’s Pizza Group PLC 2017, p. 33).
The first executive director is David Wild. He was appointed to the board as a non-executive member in November 2013. Later, he became the chief executive officer in April 2014. David has worked with well-established companies such as Walmart Stores Inc. and Tesco Store PLC. The second executive member is Rachel Osborne. She is the Chief Financial Officer. She joined the company in October 2016. Rachel is a chartered accountant who has worked with renowned companies such as Kingfisher, PepsiCo, and Vodafone (Domino’s Pizza Group PLC 2017, p. 32).
Domino’s Pizza Group is incorporated and listed in The UK. Therefore, it is governed by the UK Corporate Governance Code (Combine Code). As indicated in the annual report, the company complied fully with the principles and provisions apart from Code provision A.4.1 (Domino’s Pizza Group PLC 2017, p. 33). The code deals with the appointment of one of the independent non-executive directors to be the senior independent director. The company made this appointment in April 2016. This shows that there was partial compliance with the provision.
Recommendation
The asset value per share can be achieved by dividing the net assets by the number of shares outstanding. The value of a net assets for the year 2016 was £107,158,000 while the basic weighted average number of shares was 496,496,866 (Domino’s Pizza Group PLC 2017, p. 89). Thus, the net asset per share was £0.21583. The value is equivalent to 21.58 pence. The current market price per share is 336.0 pence (Yahoo Finance 2017, p. 1). A comparison of the two prices indicates that the book value of the firm is much lower than the market value. This implies that the stock is overvalued. An overvalued stock has a negative margin of safety and an investor can make losses in the future when prices start to decline. An investor’s aim is to buy shares at a low price and sell them at a profit (Warren, Reeve & Duchac 2013, p. 315). It is worth mentioning that the market price per share highly depends on the forces of supply and demand. Thus, the price of shares can go up when demand exceeds supply. This scenario is mainly experienced in the case of blue-chip companies. This explains why an overvalued share can be considered for investment. Despite the overvaluation of the shares, investing in Domino’s Pizza Group is a viable opportunity. This recommendation is based on the fact the financial analysis carried out above reveals a stable and sound financial performance (Shapiro & Moles 2014, p. 219). The performance is expected to improve further in the future.
Reference List
Domino’s Pizza Group PLC 2017, Annual report and accounts. Web.
Goyal, V & Goyal, R 2013, Financial Accounting, PHI Learning Private Limited, New Delhi Horner, D 2013, Accounting for non-accountants, Kogan Page Limited, Philadelphia.
Reuters 2017, Domino’s pizza group plc (DOM.L). Web.
Seeking Alpha 2017, Domino’s pizza group. Web.
Shapiro, A & Moles, P 2014, International financial management, John Wiley & Sons, Limited, New Jersey.
The Telegraph 2017, Fundamentals for domino’s pizza group. Web.
Varghese, J 2017, ‘Domino’s pizza’s slowing UK sales growth sends shares tumbling’, Reuters. Web.
Warren, C, Reeve, J & Duchac, J 2013, Financial and management accounting, Cengage Learning, Boston.
Yahoo Finance 2017, Domino’s pizza group plc (DOM.L). Web.