Executive Summary
Home- and community-based services are becoming increasingly popular in the United States as effective and inexpensive ways of offering quality care to senior citizens. The statistics in this study show that the state of Michigan is underperforming in funding HCBS, spending only $0.72 per person in contrast to other states such as Colorado, Connecticut, and Massachusetts, which are spending over $80 per person. This significant difference indicates that state officials have yet to appreciate the need to invest in HCBS. The community-first choice did not receive any financial support from the state government from 2012 to 2015. In the financial year ending September 30, 2015, the state spent $30.68 per person on 1915(c) waivers. When compared to the spending of such states as Minnesota, Alaska, Connecticut, the District of Columbia, and Pennsylvania in amounts averaging over $300 per person, the difference is striking. The state of Minnesota spent $413.43 per person, more than 13 times greater than Michigan’s expenditure. The statistics show that the state is spending more on nursing homes, which have been proven to be less effective, less popular among the elderly, and more expensive than HCBS. In 2015, while the state spent $261.62 per person on nursing homes, total HCBS expenditure in 2015 was $131.36, a significant improvement compared with that of the previous years. The statistics also show that total Medicaid expenditure for all services in 2015 was $1,618.43 per person, a 19.3% increase. However, there is room for improvement, especially in the HCBS sector. As discussed in the paper, a policy change that emphasizes the importance of home- and community-based services is vitally needed.
Introduction
The population of seniors receiving long-term services and support (LTSS) from the federal and state governments has been on the rise over the past several decades. The United States currently has over 46 million seniors aged over 65 years who need these services, and the number is expected to increase by 25% by 2040 (Keehan et al. 9). LTSS is expensive, and vulnerable seniors need direct support from the government. Some of these senior citizens require specialized care because of complications such as stroke, cardiovascular disease, musculoskeletal disorders, and related complications. Watts and Musumeci explain that the average annual cost of these services, when offered as part of nursing facility care, is about $90,000 (31). The report also shows that cost reduces significantly to $40,000 for home health services and $20,000 for adult day care.
The country has been trying to redefine its strategy for offering LTSS to the elderly. Over the past decade, expenditures for LTSS have been declining consistently as a percentage of the national budget, making it necessary to establish a better model of service delivery than traditional nursing homes. According to Mehdizadeh, home- and community-based services (HCBS) are gaining popularity in the country over nursing homes (45). Empirical studies have confirmed that one of the best ways to reduce annual expenses related to LTSS without compromising the quality of services to senior citizens is to shift from the nursing home model to the HCBS model (Watts and Musumeci 21). Many states, including Michigan, are now trying to shift their focus from nursing homes to HCBS because of the reduced cost and improved service delivery. In this case study, the researcher seeks to ascertain that an increase in spending for home- and community-based services decreases spending for nursing homes under the Medicaid program.
Case Study
The National Trend
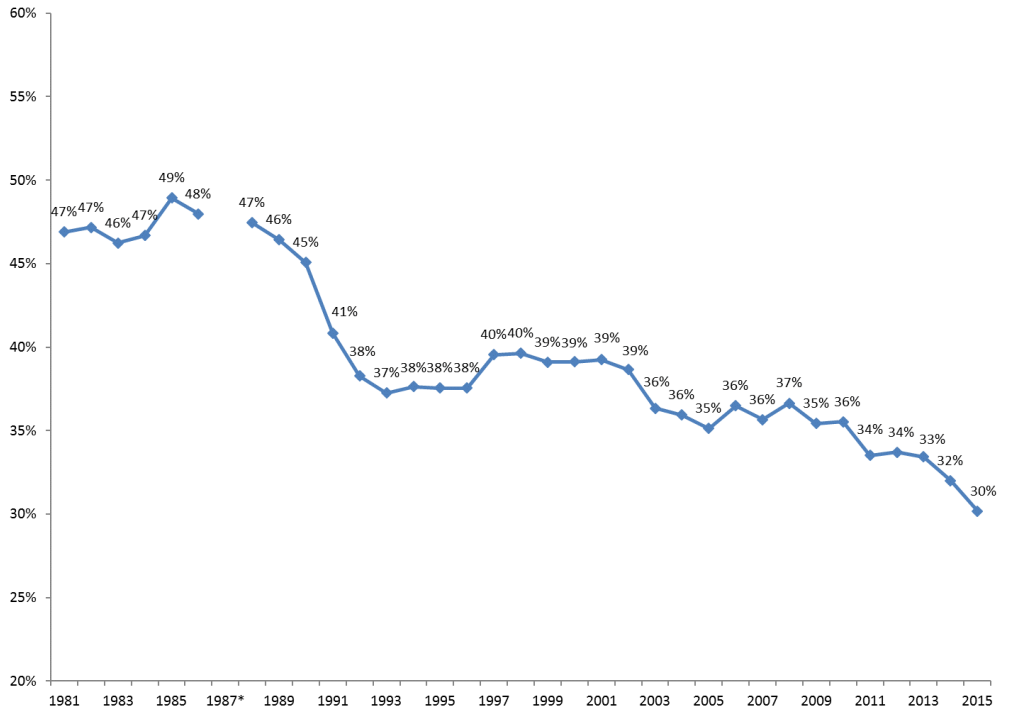
The population of Americans aged over 65 years is consistently increasing because of improved healthcare services, high living standards, and many other improvements in the socio-economic and technological sectors. A significant majority of these people are not actively employed and require close medical attention. According to D’Souza et al., many American seniors suffer from a wide range of health complications (160), largely depending on the government to fund their medical needs. The federal government has been keen on capping LTSS expenses to achieve a proper balance between recurrent and developmental expenditure. Mehdizadeh observes that although the amount of money allocated to LTSS in the country has been increasing, the representative percentage in the federal government’s budget has been declining over time (21). This indicates that the government is focused on reducing the percentage of expenditure on LTSS. The economic strain in this sector means that states must find ways to redefine the approach used to offer care to the elderly in a cost-effective manner. Figure 1 illustrates the decreasing budgetary allocation for Medicaid spending by the federal government. Statistical analysis shows that the federal government is likely to reduce expenses further as it focuses on managing other pressing health concerns affecting the entire population in the country.
Home- and community-based services have become increasingly popular in many states across the country. Watts and Musumeci attribute the rise in the popularity of HCBS to various factors (13). One of the leading reasons is its convenience for patients. Unlike the nursing home model that forces seniors to leave their community and stay in a school-like setting, an unpopular option among most of those affected, HCBS offers seniors the opportunity to remain within their community. No sudden change of lifestyle is involved as the model allows seniors to continue leading their accustomed life while at the same time receiving close medical attention as needed. Keehan et al. compare it to the outpatient model of care (9).
Most seniors using HCBS stay at home and visit designated healthcare facilities on a regular basis to ensure that they are not under any threat because of their medical condition. This model is relatively inexpensive compared to the nursing home model. In nursing homes, the elderly are treated as inpatients. Even at times when no medical attention is needed, the facility must employ nurses, cleaners, cooks, and other staff to take care of the seniors. Thus, the facility will be responsible for meeting most of the needs of residents. This costly model of elder care is still the most common approach in various states. Figure 2 shows the changing dynamics and costs involved in the two models at a national level.
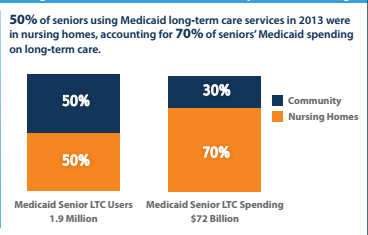
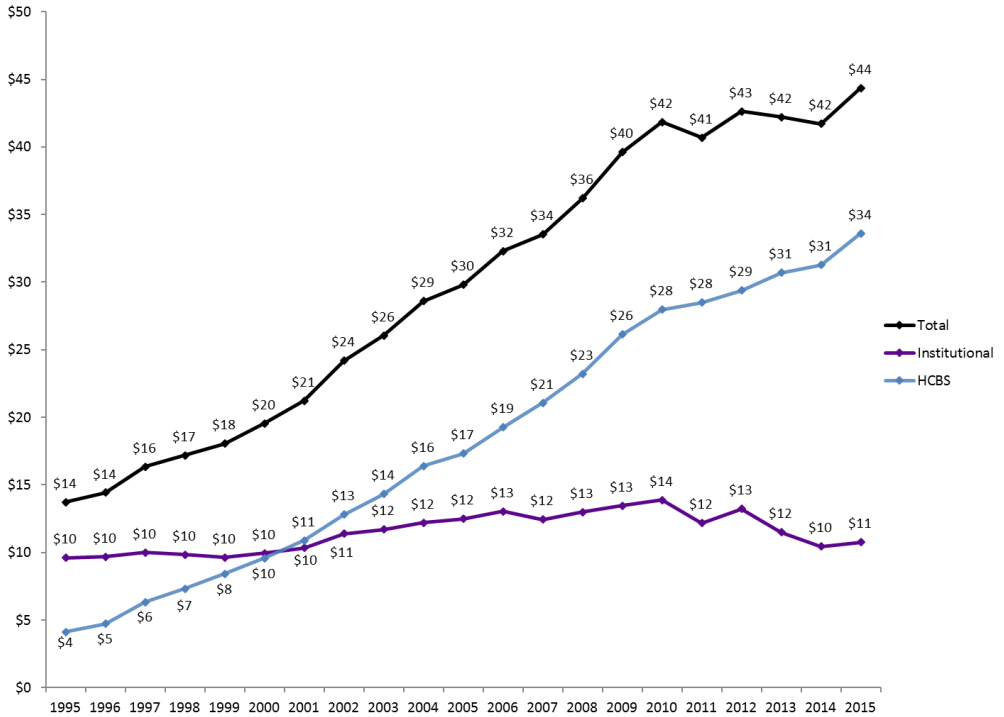
As shown in the figure, the number of seniors living in nursing homes represents about 50% the total population of those receiving LTSS in the country. The other half is using the community-based model. In terms of cost, statistics show that 50% of those in nursing homes spend 70% of the Medicaid budget while 50% of those using the community-based model account for 30% of the same budget, implying that the nursing home model is more than twice as expensive as the HCBS model. This explains why LTSS expenditure targeting older adults and the disabled population is shifting from the institutional model to HCBS. As shown in figure 3, Medicaid LTSS expenditure on HCBS is currently over 3 times that for institutions (nursing homes). It has been established that HCBS is a lean and more effective model than the traditional model involving nursing homes. While in the 1990s, the nursing home model was popular because many states had yet to understand the new concept of HCBS, since 2000, many states have been embracing the new model for offering care to older Americans.
According to Watts and Musumeci, one of the greatest challenges in promoting the use of HCBS over the nursing home model is the lack of uniformity across different states in the country (44). Although studies have strongly suggested that the former is a more efficient and leaner way of caring for older adults than the use of nursing homes, the federal government has allowed each state to come up with an implementation plan considered appropriate based on the prevailing circumstances. Thomas notes that the only requirement is that each state must provide a report on the number of older adults in nursing homes versus those receiving services using the HCBS model (17). Some states have performed exceptionally well in introducing the new system and ensuring that it is properly supported to enhance its success. Others have performed less well—in fact, dismally—in implementing the new plan. Mehdizadeh explains that politics is a major factor in defining the approach that each state has adopted to care for the elderly (43). The policy makers at the state level have the responsibility to ensure that they support a specific model that would serve the interest of the majority in the best way possible. The analysis will focus on Michigan and how this state compares with the other states across the country in the implementation of HCBS to care for the older adults in the country.
How Michigan Compares with Other States
According to Kane, Michigan is the tenth most populated state in the United States, with an estimated population of about 10 million people (155). A considerable percentage of that population comprises senior citizens who require regular medical attention that they may lead normal lives (Keehan et al. 11). The growing popularity of HCBS and the Medicaid waiver introduced by the federal government to promote this new model of caring for older adults has motivated the state to reconsider its Medicaid strategies in the form of policy formulation. According to Watts and Musumeci, Michigan has been relatively slow to implement the HCBS program when compared with other states (56). One reason why the implementation has been slow is because of the sluggish pace at which policy makers have developed the relevant legislation to promote the new model. Many people in positions of power in the state still believe in the traditional model as the most appropriate approach to caring for the elderly. However, pressure from the government and a growing number of empirical studies confirming the superiority of HCBS over institutional programs have motivated the state to consider increasing its attention to the new model. To understand the performance of this state, it is necessary to conduct a comparative analysis.
The Michigan Department of Health and Human Services has increased its expenditures on home- and community-based services in the recent past. However, a comparative analysis indicates that the state is still not performing well in this area when compared to its neighbors and the country’s average expenditures. Figure 4 shows the comparative statistics of a per-capita HCBS waiver in six different states: Illinois, Michigan, Indiana, Ohio, Wisconsin, and Minnesota.
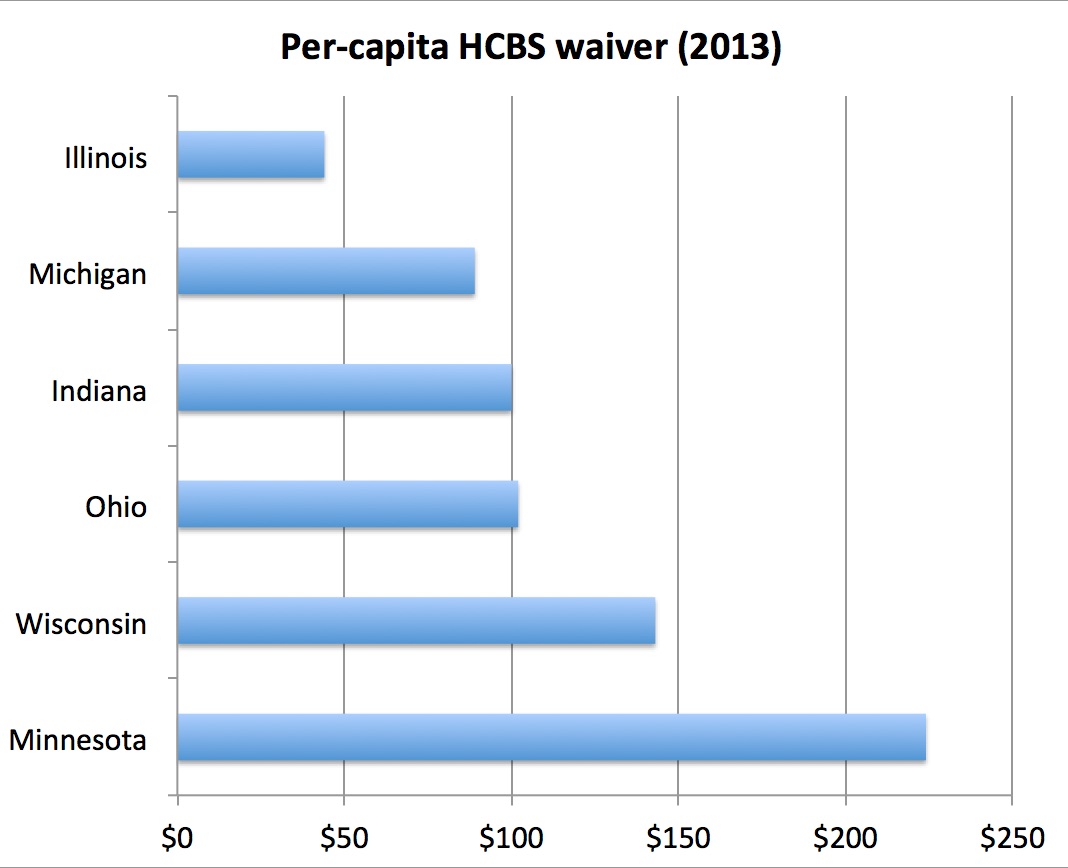
As shown in the figure, Illinois registered the worst performance in HCBC waivers in 2013. Michigan came in second to last, as per the above statistics, which is a confirmation that the state is still struggling to embrace the new policy. The amount of money used to compensate home- and community-based service providers in Michigan was less than half that spent by Minnesota. It is worrying that the state government has yet to give this new model of caring for the elderly serious attention. Craig et al. explain that the problem arises when a state fails to take responsibility as would be desirable (20). In many instances where HCBS is not properly supported by state officials, a problem arises from the perception that states should only be responsible for funding nursing homes. In other words, state government officials expect local authorities and non-profit organizations to take care of the HCBS segment of the state’s population. What they fail to understand, as Watts and Musumeci explain, is that an increase in spending for home- and community-based services will facilitate decreased spending for nursing home expenses under the Medicaid program (63). Table 1 shows Medicaid enrollment and expenditure for senior citizens in various states across the country in the financial year 2011.
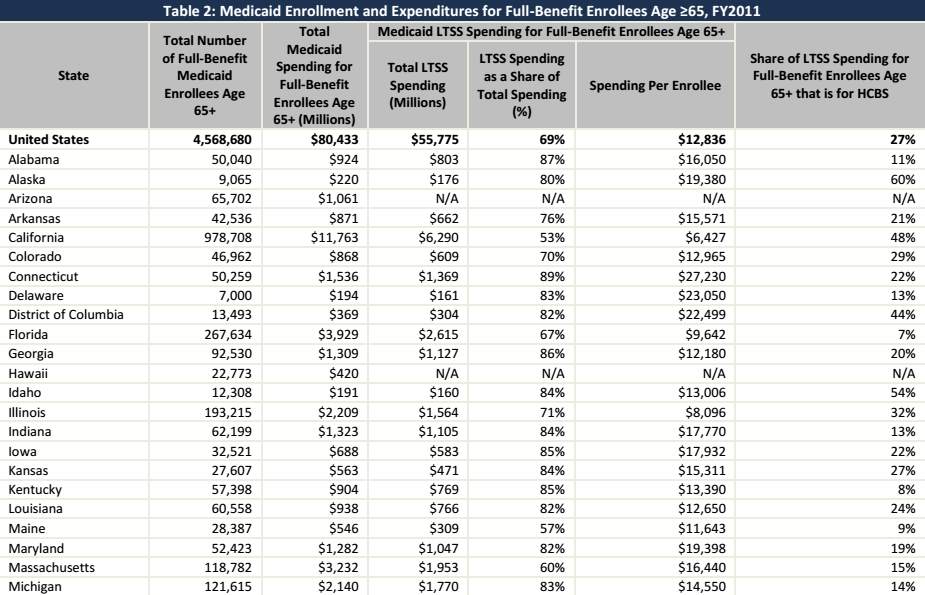
Source (The Kaiser Commission on Medicaid and the Uninsured 5)
As shown in the table, over 4.5 million Americans over 65 years of age were entitled to receive Medicaid from the government in that year. About 121,615 Michigan residents fell within that category. The country spent over $80 billion in total to offer necessary care to the elderly. On an individual basis, Michigan spent $2.14 billion to support its elderly in receiving the medical care they needed. Massachusetts, with a slightly smaller population, spent over $3.23 billion. The statistics under consideration also show that the state of Michigan only spent a small fraction of that money (14%) on home- and community-based services, a clear indication that the state has yet to give this form of care for elderly adults the attention required. For the sake of comparison, Alaska spent 60% of its Medicaid funds for older adults on HCBS. California’s expenditure on HCBS in that budget was 48%, while Idaho spent 54% on the same. While other states across the country have realized the importance of this new approach to caring for adults and are spending over 50% of their Medicaid funding for the seniors on HCBS, Michigan has only set aside 14% of the related budget sector on HCBS, a clear indication that the state is still not committed to promoting the use of the new model.
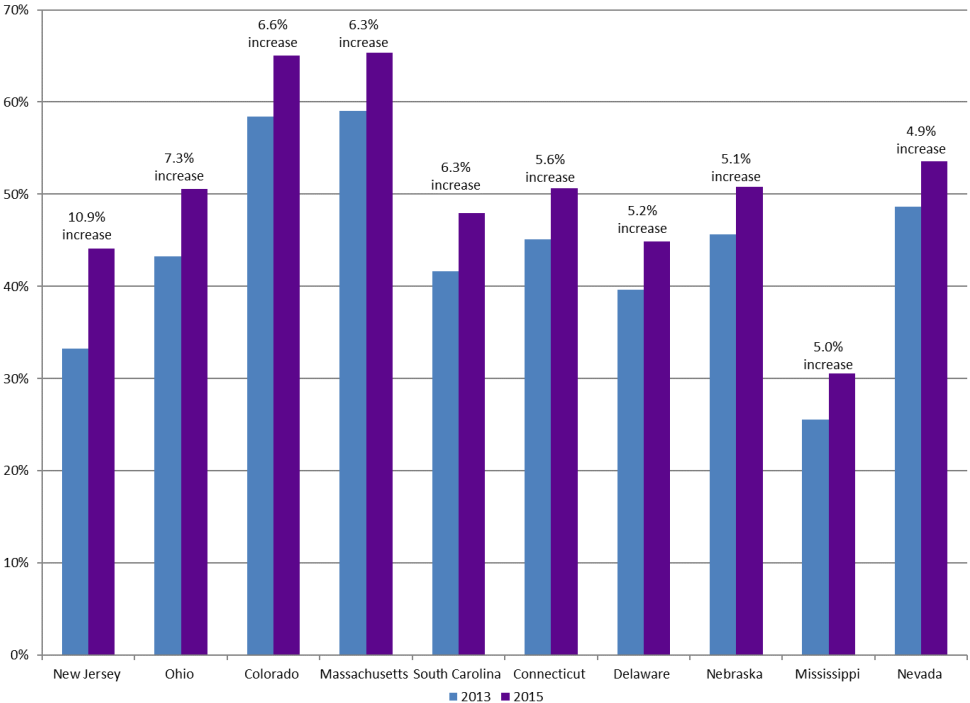
The dismal performance of Michigan in regard to its Medicaid HCBS expenditures is also demonstrated when comparing the states that registered the highest increase in this sector. As shown in figure 5, New Jersey registered the highest increase from 2013 to 2015 at 10.9%. It was followed by Ohio at 7.3% and Colorado at 6.6%. Massachusetts had a 6.3% increase, South Carolina 6.3%, Connecticut 5.6%, and Delaware, a 5.2% increase. Other states that registered impressive growth over the same period include Nebraska, Mississippi, and Nevada. Sadly, Michigan was not among the top ten in this category. These numbers further confirm that this state is still reluctant when it comes to the issue of properly funding HCBS.
Empirical studies conducted over the last decade strongly suggest that HCBS is the most appropriate model for offering medical care to senior citizens in the country. The model’s economic, social, and psychological benefits have been confirmed by various studies (Craig et al. 14). When the number of senior citizens registered in HCBS increases, the number of those who will need the services of nursing homes significantly drops. Studies have suggested that most senior citizens prefer home- and community-based services to nursing homes (Watts and Musumeci 45). The new concept allows them to lead a normal lifestyle without having to leave their families. In contrast, nursing homes have a negative mental impact on senior citizens. Many perceive such a facility to resemble a concentration camp where they will be separated from loved ones. Others view these homes as a confirmation of their diminished value to the country’s socio-economic and political development. While these institutions may offer residents necessary medical care, they also exert a serious psychological impact that often goes undetected and unrecognized. Using HCBS, elderly members of the society can remain active despite advanced age. In fact, a study by Kane shows that a significant number of senior citizens are now taking jobs in different sectors of the economy where their skills and experience are needed (159).
Different reasons motivate older citizens to remain active in the country’s economic development. Many are going back to work because of the need to get the social support they need in their old age. Some have no family members living in the same city, and maintaining a regular work environment even after retirement provides them with a family of coworkers they can share with and receive help from whenever it is necessary. Others are going back to work because it helps them maintain physical fitness. Having to wake up every morning and engage in physical activity throughout the day improves their health. Another segment of the elderly returning to employment is committed to helping promote economic development in the country. These workers do not want to become a source of financial burden for their family and the country. Regardless of the reason, Mehdizadeh explains that the elderly citizens who return to employment are healthier and more physically fit than their colleagues who prefer not to work (64). They also register improved mental performance because of the constant need to address tasks that require critical thinking and sound judgment. For those older citizens who are concentrated in nursing homes, it is not possible to be as actively engaged in the socio-economic and political development of the country as they might desire (Fox-Grage and Walls 41). Michigan must reconsider its policies when addressing the issue of offering long-term services and support to its senior citizens.
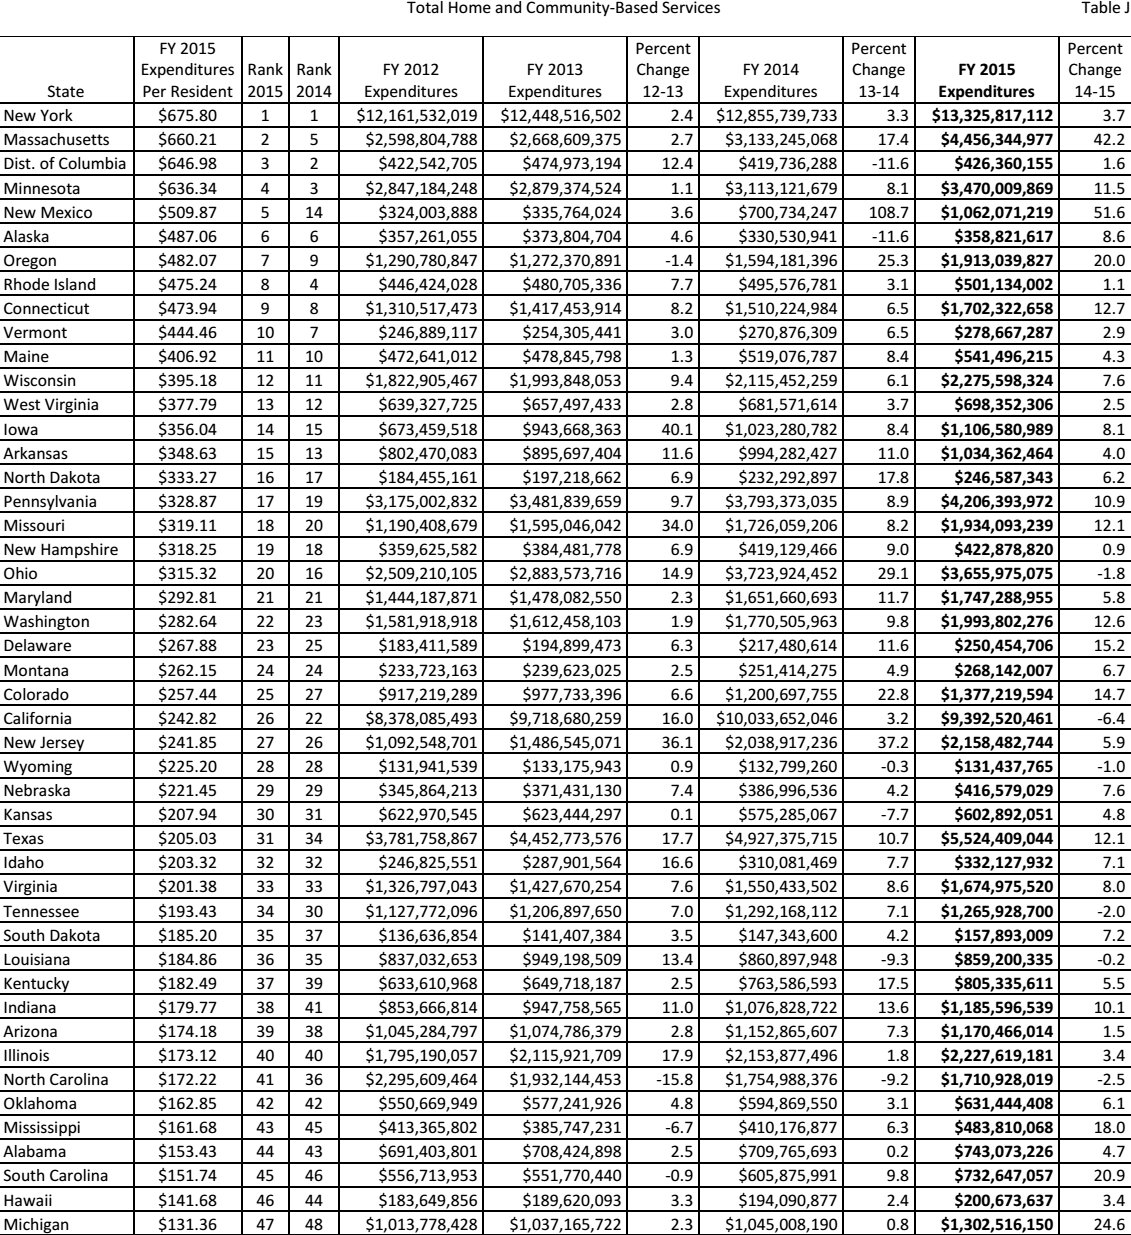
Medicaid Spending on HCBS across States
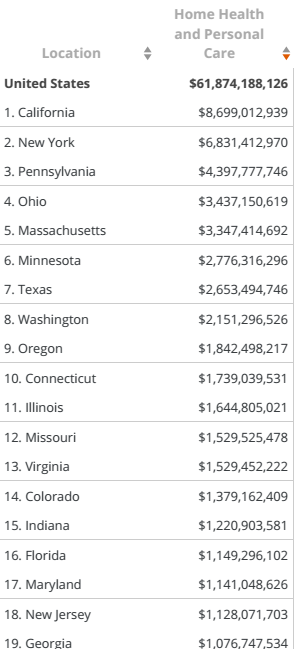
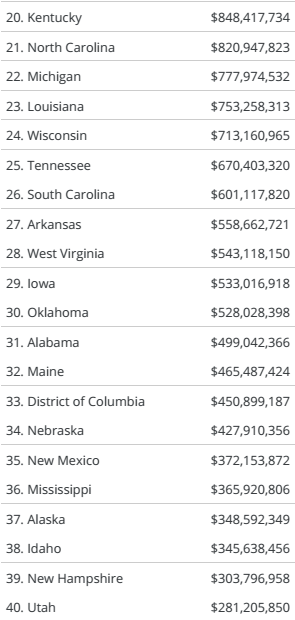
Table 2 shows the amount each state spends on home health and personal care in the United States. Perusing these figures will aid in understanding how the state of Michigan compares with other states in its financial commitment to home- and community-based facilities that offer long-term services and support to senior citizens.
Source (The Kaiser Commission on Medicaid and the Uninsured 6)
The statistics show that the state of California has the largest budget for home- and community-based services. It spends about $8.7 billion every year in that sector. New York comes second, Pennsylvania third, and Ohio is forth. The state of Michigan occupies position 22, spending only $777 million on home- and community-based services. According to Fox-Grage and Walls, this level of spending is understandable for states with a relatively smaller population that have a smaller budget than the larger states (39). The budget that a state allocates to the health sector should reflect the size of its population. Michigan is the eighth most populated state in the country, just behind Ohio. The table above shows that Ohio has the fourth largest budget, but Michigan is ranked 22nd. It is thus evident that relative to its size, Michigan is allocating minimal resources to support home- and community-based services. The state of Massachusetts, with a smaller population than that of Michigan, spends over four times more on this new model of caring for the elderly than the latter state. This is a clear demonstration of how Michigan is performing badly in terms of providing support for home- and community-based services. However, it remains feasible to implement changes to improve a state’s current performance. In addition, Michigan is not alone in its need to address this issue. Other states, those ranking 23–50 in home health and personal care spending, are performing worse than Michigan. New Hampshire and Utah represent some of the worst performers in this category.
According to Watts and Musumeci, the federal government is now encouraging states to spend more for the home- and community-based model of caring for the elderly because empirical studies have confirmed its effectiveness and the fact that it is less costly (45). However, no federal policy is in place to force each state to spend a specific amount of money on this new model. Thus, each state needs to have a report that shows how much is spent on the new model and how much is allocated to the nursing homes that care for senior citizens. The lack of specific information can also serve to explain why there is a disparity in the budgetary allocation across various states. Fox-Grage and Walls assert that those who have realized the importance of the community-based model have significantly increased their expenditure on the new model while at the same time reducing the amount of money spent on nursing homes (34).
Shrinking Budget for Nursing Homes
The statistics show that many states are now reducing their budgetary allocation to nursing homes, a model of offering medical care to senior citizens that is becoming less popular. Many older adults do not prefer being moved from their homes to stay in college-like institutions where their activities are strictly defined by the authorities there. Table 3 shows the trend in expenditure on nursing homes.
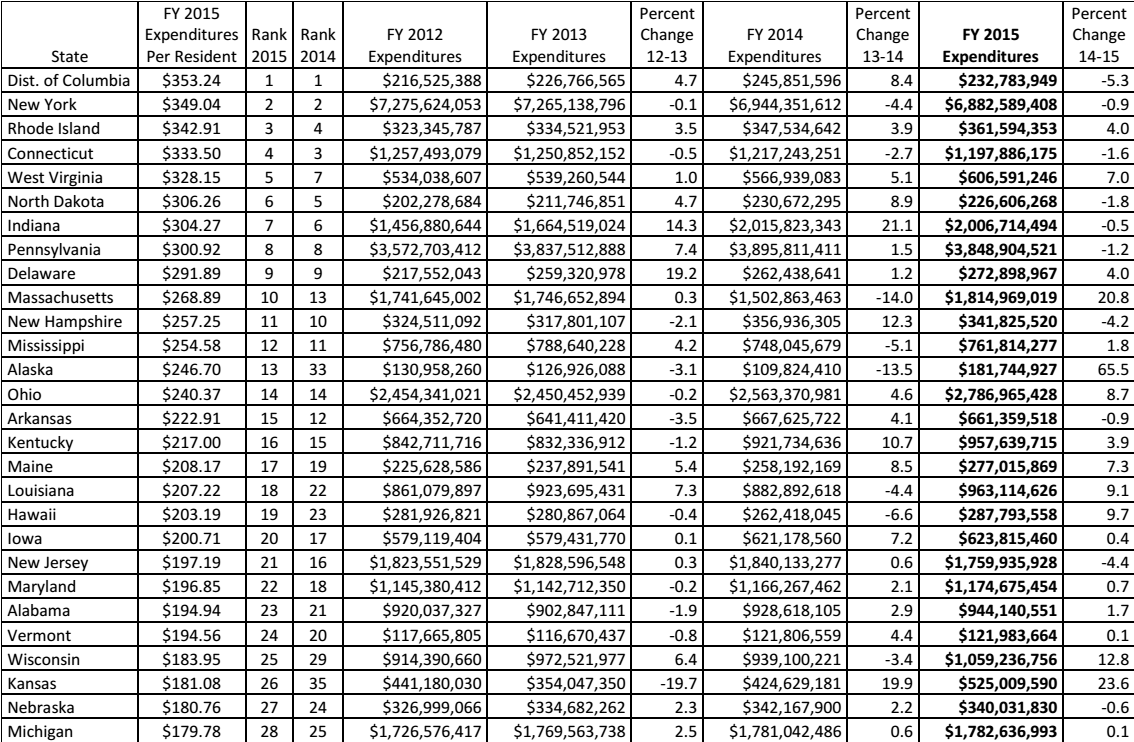
Source (Eiken et al. 91)
The table shows that states such as New York, Connecticut, Massachusetts, and Alaska are now reducing the amount of money allocated to nursing homes in favor of HCBS. From 2014 to 2015, Alaska decreased its budgetary allocation to nursing homes by 13.5%. In the same financial year, Massachusetts did the same by 14%. These states understand that the emerging trends in the healthcare sector will soon make nursing homes irrelevant in terms of offering proper care to the elderly. On the other hand, Michigan has consistently increased its budgetary allocation to nursing homes from 2012 to 2015. While other states are embracing the new model, this state is failing to show any sign of joining the rest in the move from nursing homes to HCBS at a reasonable rate.
Comparative Analysis of States’ Expenditure on HCBS
According to Fox-Grage and Walls, analyzing the trends shown in the moves by various states to financially support HCBS makes it easy to understand their commitment to adopting the new health model (42). Some community-based services for the elderly are supported by donations from various philanthropic organizations such as the Bill and Melinda Gates Foundation and The Rockefeller Foundation (Mehdizadeh 65). Others receive support from different non-governmental institutions that understand the significant role they play in offering quality care to the elderly. However, it is important to remember that it is the responsibility of the government to ensure that those who are enrolled in Medicaid obtain the services they need. Non-governmental institutions can continue to help, but that should not justify a decision on the part of a state’s government to reduce its expenditures on HCBS if a majority of state residents need such services. Table 4 shows a comparative analysis of the amount of money each state spent on HCBS from 2011 to 2015. It indicates the percentage change (increase or decrease) in the expenses for home- and community-based services. The performance of Michigan regarding its expenditures on HCBS, based on the statistics presented in table 4, is below average and is a further indication that something needs to be done to address the state’s weakness.
Source (Eiken et al. 98)
States’ Expenditures on Home Care per Person
The amount of money that the state spends per capita to support home health offers a better understanding than looking at the overall state expenditure (Mehdizadeh 49). As mentioned earlier, it is necessary to ensure that every state budgets for each of its residents appropriately. Table 5 shows how much each state assigns to its residents to cover home health. Colorado ranked highest in 2015, with an expenditure of $87.05 per person. Furthermore, that state was ranked second best the previous year. Connecticut was ranked second best with an expenditure of $85.74 per person, dropping one position from 2014 to 2015. Other high-performing states include Massachusetts at $84.96, Iowa at $52.51, and Indiana at $46.94 per person. Ohio spent $39.84 per person on home health in 2014. Unfortunately, placing the state firmly on the other side of the spectrum among the underperformers, the statistics show that in 2015, Michigan spent $0.72 per person on home health, one of the smallest allocations that year. While Ohio inhabits the eighth position, Michigan appears 45th in the list, performing better than only a few states including Maryland, Nevada, Mississippi, Illinois, and Oregon. The worst-ranked state was New Jersey, which spent $0.13 on home health. The policy makers in Michigan need to realize the significance of home health and its efficiency in caring for the elderly members of society.
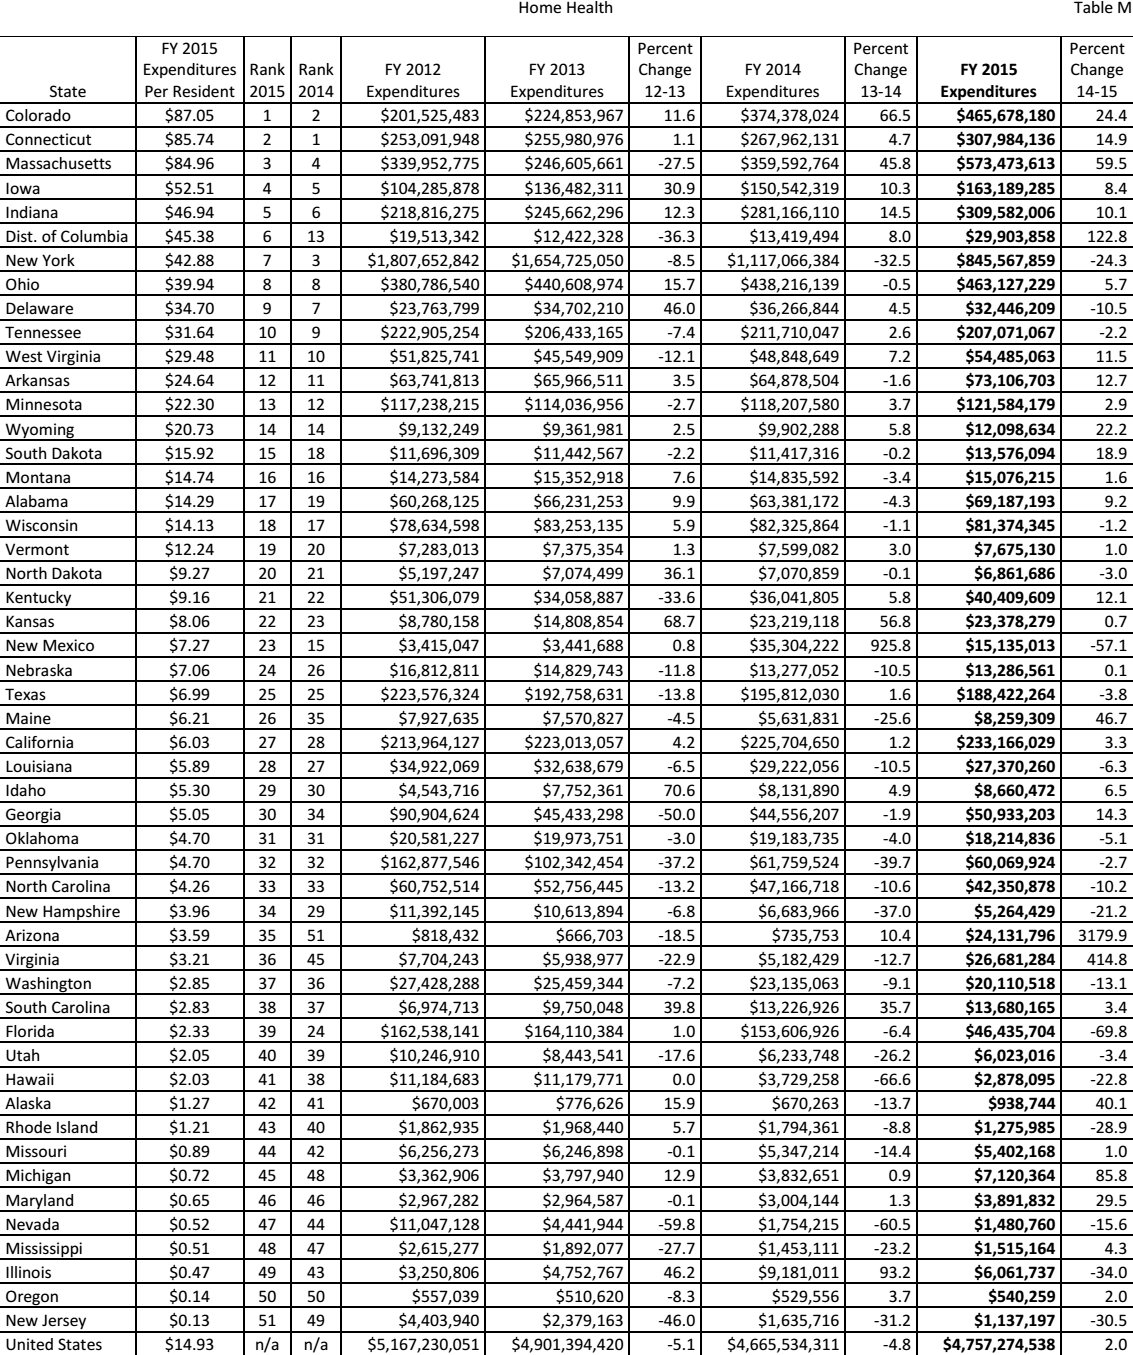
Source (Eiken et al. 121)
States’ Expenditure on Personal Care per Person
According to Mehdizadeh, some states perform dismally when it comes to budgetary allocations for health care (76). The comparative statistics above show that the state of Michigan is one of the worst performers when regarding budgetary allocations for home care. It will be helpful in this discussion to examine how much the state spends on personal care per person, and how it compares with other states. As shown in table 6, the District of Columbia had the highest expenditure per person on personal care in 2015 at $251.02, retaining the first position held the previous year. New York came second, spending $235.26 per person on personal care. That state also retained its position. The state of Massachusetts remained in position 3, as in the previous year, spending $157.11 per person in 2015. The states of Minnesota, Alaska, Missouri, Texas, Wisconsin, Washington, and Maine are among the top spenders on personal care. Michigan was ranked in position 16, spending $32.31 per person in 2015. It is important to note that in this area, Michigan outperformed many other states, evidence that the state is committed to offering care to its senior citizens even as it continues to overemphasize traditional models that many states are moving away from because of budget considerations. Table 6 summarizes how much each state spends on personal care per person.

Source (Eiken et al. 123)
The state of Michigan needs a policy change regarding the way it allocates its resources to the healthcare sector. Studies have confirmed that HCBS is a more effective and less costly approach to caring for the elderly. The current government should understand that if it moves more services related to personal care into the home health sector, which reflects a current spending level of $0.72 per resident, the state will not only see savings in personal care spending but will also over time reduce nursing home expenditures.
It is possible to assume that at position 16, the performance of the state of Michigan is not bad in comparison with that of other states. However, Wacker and Roberto explain that sometimes a state may lower its expenses related to personal care as a result of investing more in home- and community-based services (89). States ranked 17–34, and those that are not ranked because they either lack data or have not spent anything on personal care, showed better performance than Michigan in 1915 (c) waivers. For example, North Dakota was ranked in position 18 in personal care expenses, two places below Michigan. However, the former occupied position 9 in 195 (c) waivers. On the other hand, New Hampshire was ranked in position 29 in personal expenditure, but when it came to the state waivers, that state held a ranking in position 11. Nebraska is another state that spent less on personal care compared to Michigan (position 22) but was ranked higher than Michigan (position 16) in terms of 1915 (c) waivers.
Table 6 shows that 17 states, from positions 34 to 51, were not ranked. Most of these spent nothing on personal care from 2012 to 2015. It would be easy to assume that they are not doing well in providing long-term care to senior citizens in the United States; however, that is not the truth. In fact, most of these states are spending more on long-term care for the elderly than the state of Michigan, but they are moving away from personal care approaches in favor of HCBS. A good example is Ohio. As shown in table 6, that state spent nothing from 2012 to 2015. However, it ranked better than Michigan in 1915 (c) waivers at position 13. The next section provides further details on how the state of Michigan compares with other states across the country in terms of 1915 (c) waivers.
1915 (c) Waivers by States
The Social Security Act of 1915 Section C mandated states to provide waivers to specific populations within the country (Fox-Grage and Walls 82). Many states have been offering the waiver to those considered vulnerable by society. Senior citizens have enjoyed the waiver because of their vulnerability. Table 7 shows how much each state has been spending on the waivers for medical services offered to the vulnerable.

Source (Eiken et al. 126)
The state of Michigan spent over $772 million on waivers in 2015. Although that was a significant amount compared to the state’s performance in other areas as discussed above, comparative statistics still show that the state is trailing the majority of other states in the country. Michigan is ranked in position 43 out of 51. It spends $77.90 per resident, compared with $413.43 for Minnesota and $370.95 for Alaska, which are ranked first and second, respectively.
The comparative statistics strongly suggest that the state of Michigan is underperforming when it comes to offering financial support for HCBS. In fact, its financial allocations to various financial covers are not satisfactory in comparison to the expenditures of other states. It was necessary to conduct a comparative statistical analysis of the performance of this state against other states on total spending on long-term services and support. Table 8 shows the performance of Michigan against that of other states. As expected based on the statistics above, Michigan is ranked among the lowest-performing states, in position 44, having spent a total of $325.72 per person on long-term care. The District of Columbia spent $1,189.85 per person and was ranked in position 1. The second position was taken by New York, which spent $1,156.80, while Massachusetts came third after spending $1,009.97 per person in 2015. According to the numbers, the District of Columbia spends almost four times as much as Michigan on long-term services and support for its residents. These statistics indicate that the states that are allocating more resources to these medical services are shifting their model of health delivery from nursing homes to home- and community-based services. The lowest-performing states should consider emulating the strategies and effort put in place by the best performers in supporting the elderly who need long-term care.
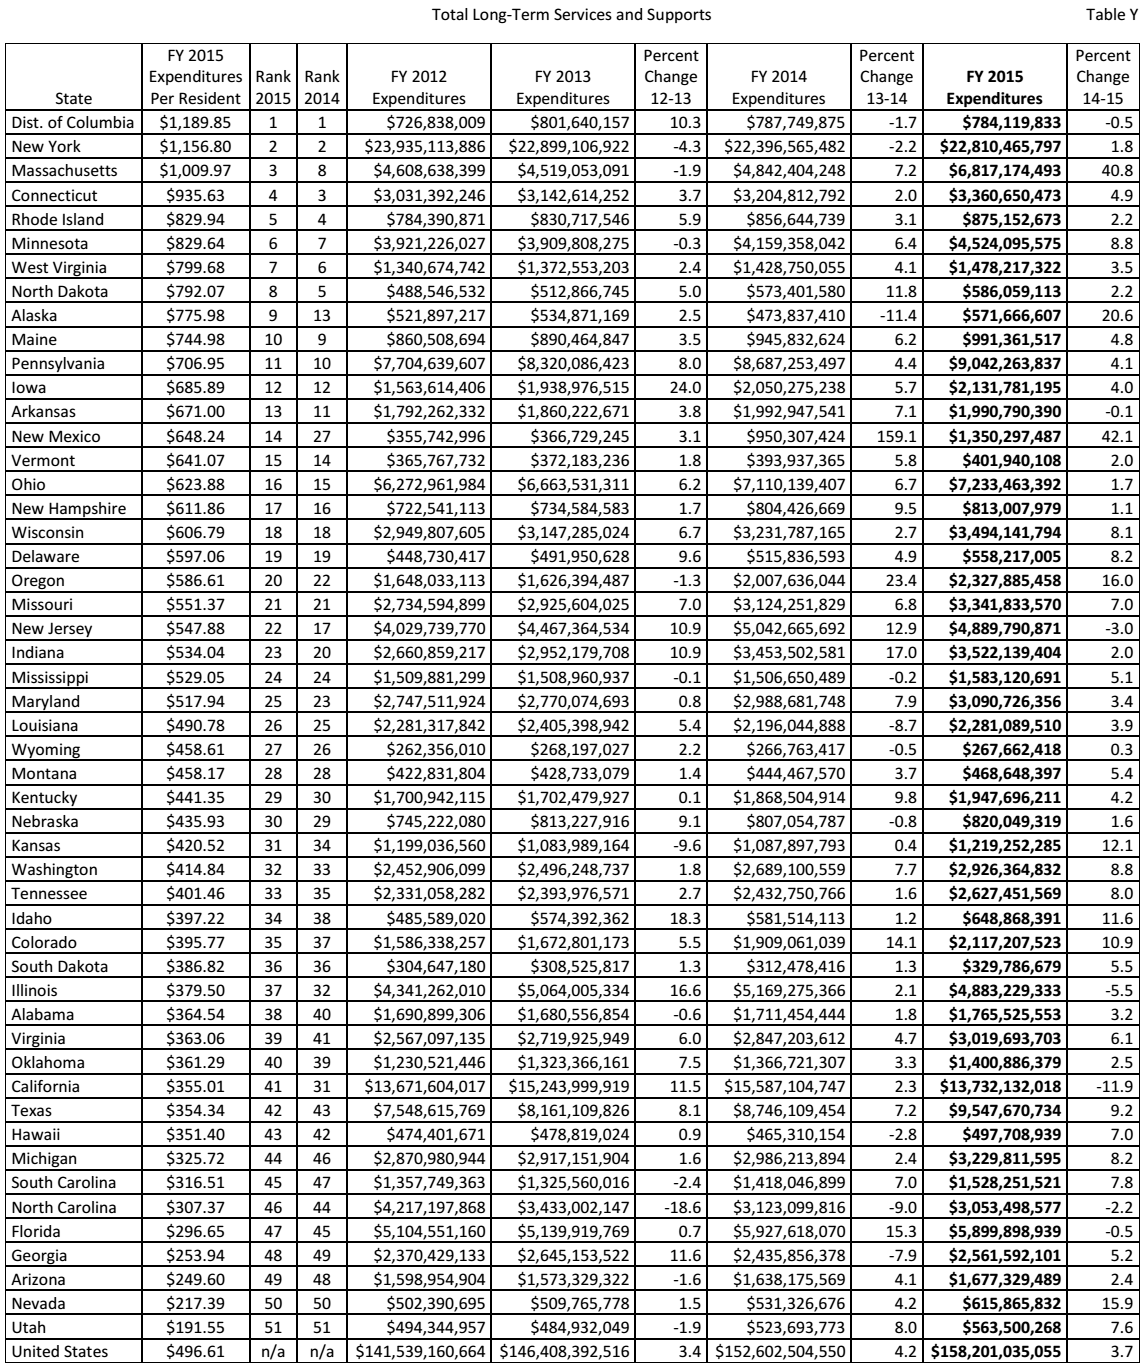
Source (Eiken et al. 127)
It is worrying that across the same country, such a huge disparity is evident in the amount of money allocated to long-term care for the elderly. According to Power et al., the quality of care provided the residents of each state depends on the money spent by the government in the sector of health (57). It is not reasonable to expect that senior citizens residing in Michigan, where the government spent $325.72 per person in 2015, are receiving the same quality of care as the residents of New York, where every person was allocated $1,156.80 in the same year. The statistics show that those states that have come to appreciate the benefits of HCBS continue to register impressive performance regarding their total-term service and support. The first two states (the District of Columbia and New York) retained their position from 2014 to 2015. Massachusetts moved from position 8 to 3, while Minnesota moved a step higher to position 6.
One worrying trend revealed by the statistics above is that underperforming states do not show signs of significant improvement. While some states continue to increase spending in this sector, others that are not doing well continue to do little to improve. The state of Utah, which was the worst-performing in 2014 according to the data collected, retained the bottom position in 2015. In fact, from 2013 to 2014, that state’s total long-term services and support expenditure dropped, a clear demonstration of the state’s limited commitment to provide the needed services to its senior citizens. Nevada is another state that retained its deplorable position (50 out of 51) in 2015. Michigan, in contrast, attempted to improve its performance in 2015, moving up two positions from number 46 to 44. This positive trend should continue as a sign of commitment to the senior citizens who reside in the state. More importantly, the state should focus more on HCBS because it offers better services at a lower cost than nursing homes.
Conclusion and Recommendations
An increase in spending for home- and community-based services decreases spending for nursing homes under the Medicaid program. The information gathered from various statistical studies indicates that when the number of senior citizens enrolled in HCBS increases, only a few will seek the services of nursing homes. Older adults prefer staying within their community and preferably in their homes as opposed to nursing homes when receiving medical care, a less disruptive approach that offers the opportunity to continue playing critical roles in the socio-economic and political development of their society. The study shows that when senior citizens are allowed to receive home- and community-based services, their sense of belonging is retained. They feel accepted and are not psychologically affected by the change of environment that is common in having to move to a nursing home. The fact that these patients stay in their homes significantly reduces the government’s expenses involved in providing their care. The boarding cost is eliminated as these patients’ only visit healthcare facilities on designated days and hours or when they have complications that need urgent medical attention. This approach reduces the need to hire more nurses in nursing homes and boarding facilities for the elderly.
The statistics show that the state of Michigan is underperforming in almost every aspect of HCBS. Compared with other states such as Mississippi, New York, Alaska, and Ohio, it is evident that this state has yet to appreciate the benefits that come with this new model of offering long-term-care to the elderly. Given the financial benefits and the popularity of this approach among the target group, it is appropriate for the state of Michigan to consider spending more on the new model than it spends on nursing homes. The study shows that the identified shortcomings can be addressed through policy formulation. It is necessary to consider the following recommendations:
- The Michigan state government should conduct a survey to understand the current population of senior citizens who are under the Medicaid program. The goal of the survey should be to identify the population of elderly persons who qualify for Medicaid.
- The Michigan Department of Health and Human Services should work with community-based healthcare institutions to come up with an appropriate model to make it possible for senior citizens to obtain needed healthcare services without having to move to nursing homes.
- The funding to home- and community-based institutions of care should be significantly increased as a way of improving services for senior citizens at a reduced cost.
- The government should reduce its Medicaid expenditure for nursing homes because studies have confirmed that this approach is more costly and less effective compared to HCBS.
Works Cited
Craig, Jones, et al. “Vermont’s Community-Oriented All-Payer Medical Home Model Reduces Expenditures and Utilization While Delivering High-Quality Care.” Population Health Management, vol. 19, no. 3, 2016, pp. 9-21.
D’Souza, Jennifer C., et al. “Hard Times: The Elects of Financial Strain on Home Care Services Use and Participant Outcomes in Michigan.” The Gerontologist, vol. 49, no. 2, 2009, pp. 154–165.
Eiken, Steve, et al. Medicaid Expenditures for Long-Term Services and Supports (LTSS) in FY 2015. Truven Health Analytics, 2017.
Fox-Grage, Wendy, and Jenna Walls. State Studies Find Home and Community-Based Services to Be Cost-Effective. AARP Public Policy Institute, 2013.
The Kaiser Commission on Medicaid and the Uninsured. Medicaid’s Role in Meeting Seniors’ Long-Term Services and Supports Needs. The Henry J. Kaiser Family Foundation, 2016.
Kane, Robert L. “Does Home and Community-Based Care Affect Nursing Home Use?” Journal of Aging & Social Policy, vol. 25, no. 2, 2013, pp. 146-160.
Keehan, Sean P., et al. “National Health Expenditure Projections, 2015–25: Economy, Prices, and Aging Expected to Shape Spending and Enrollment.” Health Affairs, vol. 38, no. 8, 2016, pp. 1-13.
Mehdizadeh, Shahla. Coming of Age: Tracking the Progress and Challenges of Delivering Long-Term Services and Supports in Ohio. Scripps Gerontology Center, 2011.
Power, Andrew, et al. Active Citizenship and Disability: Implementing the Personalisation of Support. Cambridge University Press, 2013.
Thomas, Kali S. “Local Medicaid Home and Community-Based Services Spending and Nursing Home Admissions of Younger Adults.” American Journal of Public Health, vol. 104, no. 11, 2014, pp. 15–17.
Wacker, Robbyn R, and Karen A. Roberto. Community Resources for Older Adults: Programs and Services in an Era of Change. SAGE Publications, 2013.
Watts, Molly O, and MaryBeth, Musumeci. Medicaid Home and January Community-Based Services: Results from a 50-State Survey of Enrollment, Spending, and Program Policies. Kaiser Family Foundation, 2018.