Introduction
It is important to note that the United States possesses one of the strongest manufacturing sectors in the world; in 2015, the manufacturers alone have contributed above two trillion US dollars to the economy, allowing the industry to experience incredible growth, and become more capable of contending internationally. Consequently, it is essential to analyze the real value-added in manufacturing, together with the level of employment created.
The Thesis Statement
Through a detailed investigation of the aspects of the US manufacturing industry and the external and internal factors, the case suggested that the country still possesses a strong manufacturing sector in terms of total output, and the decline in employment does not by itself indicate its deterioration.
Purpose of Paper
The key purpose of this paper is to review the case cautiously and consider whether the statistics provided in the figure are consistent with the analysis. It also has the purpose to forecast the upcoming trends, and come up with pertinent recommendations.
Overview of the Paper
The paper can be broadly divided into four parts: the first part conducts an overview of the case, the second part assesses the consistency of the figure with the case analysis, the third part predicts trends for the future, and the fourth part drafts the recommendations.
Case Analysis
Overview of the Case
The case study is essentially concerned with a scrupulous analysis and interpretation of a graph on the real value-added in manufacturing from 1960 to 2008 and the ‘employment in manufacturing’ during the period. The study mainly focuses on the manufacturing performances of the United States using a methodical consideration of several external and internal factors present in the economy. It attempts to endorse the idea that the country’s statistics on the real value-added in manufacturing had a general growing trend between 1960 and 2008, and the minor hitches or slumps in the graph were caused mainly due to macroeconomic factors, particularly recession. It suggests that although employment had reached its highest level in 1979, the long-run slump in this indicator started in the subsequent years because of several reasons. The first reason is the recession that hit the country in 1980, and the second reason for the continued decline even after the recessionary period was the relocation of the manufacturing industry inside the United States. As a result, the jobs were either dispensed to other states or moved to foreign countries. Due to these factors, a misconception grew amongst people that the country has lost its vitality in the manufacturing industry, while the real story is that the production continued to grow gradually over time. The productivity had increased because more goods were now manufactured by fewer laborers, indicating that the output per worker was rising due to fresh technological advancements and new procedures.
How the Data on Figure 13.2 Supports the Case Analysis
The data on the figure fully supports the case analysis because the illustrated statistics suggest that the real value-added in manufacturing had increased from 1960 to 2008 in the US and the idea that the country had lost its strength in the manufacturing sector is a false impression. Even though the employment level has truly declined recently, it cannot be blamed that this drop is due to weakening the manufacturing industry because output has increased, and now more goods are produced. The background discussion on why there has been a decline in jobs cannot be illustrated in the graph. However, the graph does support the analysis on the case that the slump is not associated with the loss of vibrancy in the manufacturing sector because there has been no such loss – thus, the graph well supports the case.
It can be suggested that the enlargement of the manufacturing industry in the country throughout the last half-century demonstrates two remarkable and rather opposing aspects, which requires detailed analysis. Notably, the expansion of the real output calculated via real value-added was either the same as the overall gross domestic product, or often, even greater than it. This has assisted the country to maintain a steady manufacturing share over a longer period; that is from 1960 to 2008. On the other hand, the country has suffered from a long-run slump in the total employment share of the industry concerned.
Baily and Bosworth (2014) suggested that the conflict between the growing productivity and the falling employment share could be reconciled with the idea that technological advancement has replaced human labor. However, according to Nager and Atkinson (2015), the credit behind the long-run success of the manufacturing industry goes to computer manufacturers. Throughout years, the computer producers remained to be the most significant contributor to the sustained growth of the manufacturing industry due to several reasons. The following table shows the yearly rates of growth in value-added of the manufacturing industry in comparison with the growth rate of the gross domestic product from 1987 to 2011; it is apparent that all computers and electronic products alone contribute the most to the gross national product:
Table 1: Growth rate in value added of the manufacturing industry compared with GDP
Source: Baily and Bosworth (2014)
The follow chart shows a breakdown of the productivity rate of the manufacturing sectors; it is notable that from 1987 to 2011, the output of computers, the labor productivity in computer manufacturing, and the multifactor productivity of computers were much higher than the other sectors:
Table 2: Productivity rate in computer manufacturing with other manufacturing sectors
Source: Baily and Bosworth (2014)
Estimation for the Next 10 Years (2009-2018)
The rising trend in the manufacturing sector, in case of the US, is something that it has achieved overtime by means of sustainable macroeconomic policies, vast technology integration, and stable economies of scale in certain secondary industries. As a result, it is highly unlikely that the figures would suddenly drop in the near future. Rather, according to Levinson (2017), with the groundbreaking achievements in research and development and the participation of more skilled policy makers, the industry is likely to grow in long run. However, there is likelihood for the employment share of the sector to drop further, since with the developments in scientific innovations, human efforts are likely to become more redundant in the upcoming years. Data retrieved from the US Bureau of Labor Statistics (2017) shows that employment in manufacturing has in fact declined further from 2009 to 2017, and it is highly unlikely that the figures would suddenly improve in 2018:
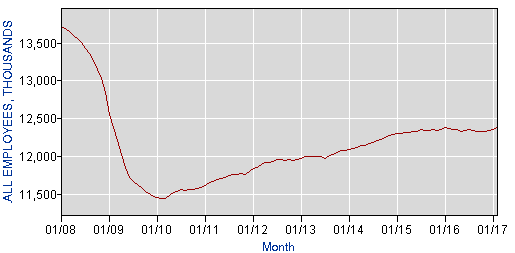
Source: US Bureau of Labor Statistics (2017)
Conclusion
Summary of Main Points
The US manufacturing industry is particularly attractive and strong in terms of productivity, and the idea that the country has lost its potency in the sector is a myth. Computer producers are crucial to the growth rate in manufacturing, and they ensure the sustainability of the sector in long run. Although employment has dropped, it is attributable to the outsourcing of laborers from foreign countries, and the relocation of jobs to other southern states. It is unlikely that employment would rise shortly because scientific advancements will be replacing human efforts.
Lessons Learned and Recommendations
The key lessons are that although it seems that the slump in employment and the growth in real value added in manufacturing cannot equally coexist, even an inverse proportionality of these factors is possible since when human resources are replaced by smarter technologies, productivity is likely to rise. Furthermore, the integration of fewer skilled workers rather than a high number of unproductive workers can be fruitful over the longer term.
The key recommendations are that the government should increase its focus to make the manufacturing sector more attractive; this should be done by conducting a benchmark analysis to determine the developments made, and by forming a new office for industry assessment. In addition, the government should create the field for increasing investment in the sector, promote collaboration between industries and local governments, set up a working group on the manufacturing sector to create awareness, endorse open markets, and diminish the expenses of tax compliance.
References
Baily, M., & Bosworth, B. (2014). US manufacturing: understanding its past and its potential future. Journal of Economic Perspectives, 28(1), 3-26.
Levinson, M. (2017). US manufacturing in international perspective. Web.
Nager, A., & Atkinson, R. (2015). The myth of America’s manufacturing renaissance: the real state of US manufacturing. Web.
US Bureau of Labor Statistics. (2017). Databases, tables & calculators by subject. Web.