Abstract
This study was designed to understand the mechanism of tissue invasion and drug resistance in AML, including the possible role of Epithelial-to-Mesenchymal (EMT) in AML progression. Four research questions guided the review. They strived to understand the mechanism that cancerous cells use to invade tissues in AML, find out the effects of EMT on AML progression and examine factors influencing cell migration patterns for cancerous cells in AML. The results indicate that therapeutic drugs induce a migratory EMT phenotype that may facilitate the interaction of AML cells with microglial cells. These findings mean that EMT causes drug resistance in AML treatment because of its ability to influence cell adhesiveness. In this regard, it affects the vulnerability of tissue membranes to invasion. Consequently, EMT has a strong effect on AML progression because it provides the right environment for the spread of cancerous cells through weakened cell adhesiveness. These findings were developed after reviewing factors that influence cell migration patterns by analysing the roundness, circulatory nature and aspect ratios of the cell membranes. Although the findings of this study are pivotal to understanding the mechanism of drug resistance, the focus has only been on tissue invasion. Broadly, there is a strong need to expand this scope of research because tissue invasion is a small part of AML research.
Introduction
Cancer often starts when normal cells grow out of control and affect other parts of the body. According to the American Cancer Society (2019), different types of the disease can affect the human body and acute myelogenous leukaemia (AML) is one of them. AML is among a broader group of blood cancers that start in the bone marrow and affect the normal functioning of blood cells (American Cancer Society 2019). Often, leukaemia starts in the white blood cells. However, they may alsooriginate from other blood cells, such as red blood cells (American Cancer Society 2019). Based on this characteristic, experts attribute AML to a deformity of cells that would have otherwise turned into white blood cells (American Cancer Society 2019). Different types of leukaemia affect varied groups of people or patients. Medical experts classify them based on whether they are acute (fast growing) or chronic (slow growing) (American Cancer Society 2019). Similarly, they categorisethese types of cancers depending on their origin in the body. Broadly, some of them start from myeloid cells, while others come from lymphoid cells (American Cancer Society 2019).
Reports indicate that about one million people around the world suffer from AML. Its associated mortality rate is 2.8 per 100,000 people (Maksimovic et al. 2018). The demographic distribution of this disease shows that some demographics have a higher risk of developing the cancer compared to others. For example, older males are at a higher risk of having the disease compared to other age groups (Maksimovic et al. 2018). Similarly, men are known to have a similarly higher risk of developing AML compared to their female counterparts (Döhner, Weisdorf & Bloomfield 2015).
AML often starts in the bone marrow where new blood cells originate. By doing so, it replaces bone marrow cells with leukaemia cells (Andreeff 2014). In turn, this phenomenon causes a reduction in the volume of red blood cells (Döhner, Weisdorf & Bloomfield 2015). Blood platelets and white blood cells may also decline significantlybecause of the same process, thereby increasing the risk of infection (Andreeff 2014). AML is known to quickly move into the blood. This makes it a high-risk factor for cancer growth because it allows AML cells to affect other parts of the body, such as the liver, spleen, lymph nodes and testicles (Andreeff 2014).
Patients who suffer from AML may present varied symptoms, including a heightened sense of tiredness, easy bleeding and shortness of breath (Döhner, Weisdorf & Bloomfield 2015). In some cases, patients may manifest other symptoms, such as an increased risk of infection and easy bruising (American Cancer Society 2019; Andreeff 2014). If victims do not receive treatment in good time, fatalities may occur in weeks or months (American Cancer Society 2019; Andreeff 2014).Different risk factors are associated with AML. They include smoking, exposure to harmful chemicals and chemotherapy (among others) (Andreeff 2014).However, bone marrow aspiration is one of the most commonly used techniques to diagnose AML. In most cases, blood tests may be used to get an accuratediagnosis (American Cancer Society 2019; Andreeff 2014).
Clinical Trials
Most studies that have addressed different aspects of research relating to the AML treatment have been based on widespread clinical trials. For example, the study by Schürch (2018) investigated the same research issues and it was based onseveral clinical trials to understand the role of therapeutic bodies in treating different forms of human cancers, including AML (using myeloid neoplasm). Most of these studies are based on experiments done on a rat’s tissue (Schürch2018). For example, Watanabe and Ernst (2016) investigated new gene programs linked to bad behaviour in managing Leukaemia in an experimental research that used a rat’s tissue as the specimen. Stavropoulou et al. (2016) also conducted an experiment that investigated the growth of AML using a mouse’s tissue as the specimen. Past studies that are linked to the current study have also conducted their experiments on cell-based research. For example, the study by Watanabe and Ernst (2016) was a cell-based research. Comparatively, a different research done by Singha et al. (2017) was also cell-based. It suggested that cancer cells, which originated from original tumours, posed a problem in the advancement of scientific evidence to manage EMT (Singha et al. 2017).
De Craene and Berx (2013) authored another study that was based on a cell-based experiment. The investigation showed that EMT had an unintentional effect on cancer progression through cell differentiation. The same findings were supported by Banyard and Bielenberg (2015) and Stavropoulou et al. (2016) who conducted a series of laboratory tests to investigate the spread and growth of metastatic cancer cells through a cell-based research. Both investigations showed that EMT played a significant role in the progression of cancer and in treating resistant neoplasms (Banyard & Bielenberg 2015).
The above-mentioned studies have been based on a review of empirical data. However, some studies have used secondary information to investigate the same research phenomenon. For example, the study by Quail and Joyce (2017), which highlighted strategies for minimising the growth of brain tumours, was based on a secondary review of past research materials. It demonstrated that a change the brain microenvironment could supress tumour progression. Similarly, a study by Singha et al. (2017), which explained the hurdles scholars faced in conducting research experiments that focus on metastatic developments of cancer cells, came up with its findings through a secondary literature review. Additionally, the research article authored by De Craene and Berx (2013), which investigated the effects of EMT on cancer progression and drug resistance, was also based on a review of past research studies.
Some studies have also underscored the importance of the micro environmental landscape in influencing tumour growth and cancer development. For example, Quail and Joyce (2017) highlighted the role of the brain microenvironment in inhibiting cancer progression. Schürch (2018) undertook a similar study to investigate the role of the microenvironment in influencing myeloid neoplasm. The investigation was largely based on an analysis of several past literatures to understand current developments and future directions in the treatment of cancer (Schürch 2018). Some studies that are related to the research topic have also highlighted the role of the human gene in controlling AML growth.
For example, the one by Stavropoulou et al. (2016) found that EMT-related genes could inhibit the growth of AML. Staudt et al. (2018) also investigated drug resistance for AML using genomics through an elaborate investigation of how the area of scientific research underpinned transformational AML. The investigation pointed out that about 2% of people have genetic alterations that are characteristic of malignancy in the genome (Staudt et al. 2018). Additional studies that are linked to the research issue have been based on a systematic review of the research topic because their evidence has been developedfrom well-designed and thoroughly researched papers. For example, a study authored by Singha et al. (2017) used a systematic approach to explain the sequence of events that define the mechanisms of EMT and its influence in reducing or increasing the rate of cancer progression. It found that EMT had the ability to supress cancer progression. Most of these studies rely on clinical test findings to support their recommendations.
Mechanism of Tissue Invasion
Researchers have drawn attention to the need to detect cancers early (Jiang et al. 2016). They argue that this is the best way of managing the disease (Pandya, Orgaz & Sanz-Moreno 2016). Despite advocating for early detection, most patients who seek medical attention on suspicion of cancer often report to medical facilities when the disease has already spread to other parts of their bodies (Jiang et al. 2015). In fact, 90% of the mortality cases associated with certain types of cancers, such as AML, is attributed to widespread cancer growth stemming from tissue invasion from the primary tumour area (Jiang et al. 2015).
Researchers have strived to understand the mechanism of tissue invasion in such cancers by reviewing how to treat patients who seek medical attention in late stages of cancer progression. Most of their findings have focused on the field of metastasis (Jiang et al. 2016; Pandya, Orgaz & Sanz-Moreno 2016). Although most of the associated data are yet to be fully documented, there is a consensus among several researchers that significant progress has been made in this field of science (metastasis), especially with regard to tissue invasion(Jiang et al. 2016; Pandya, Orgaz & Sanz-Moreno 2016). Challenges that have characterised this area of research are mostly associated with the complexity of understanding metastasis processes (Jiang et al. 2015). In addition, some of them stem from inadequate funding (Jiang et al. 2015). Nonetheless, a significant point of interest about cancer progression that has emerged from metastasis research is tissue invasion (Jiang et al. 2016; Pandya, Orgaz & Sanz-Moreno 2016). Notably, this area of research has shown that the process happens in multiple stages. Figure 1 below shows that tissue invasion happens in five stages.
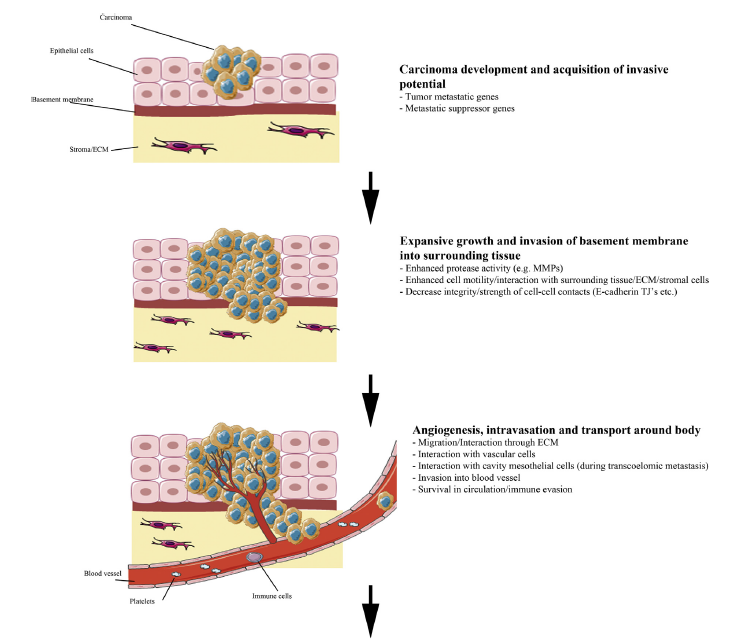
According to figure 1 above, the first stage of tissue invasion occurs when the carcinoma cells acquire invasive potential. The ability to penetrate the cell membrane is partly influenced by tumour metastatic and metastatic suppressor genes (Jiang et al. 2015). Nonetheless, the proliferation of the carcinoma genes often occurs in the epithelial cells, as highlighted in the first stage of development (see figure 1 above). During the initial stages of invasion, the carcinoma cells do not have an effect on the stroma because the invasion is marginal, as it has not yet permeated the basement membrane (Jiang et al. 2016; Pandya, Orgaz & Sanz-Moreno 2016). However, in the second stage of invasion, the carcinoma cells penetrate this membrane and start spreading to the stroma (Jiang et al. 2015). The invasion of the baseline membrane marks the point that the carcinoma cells start to spread to surrounding tissues in the body. The invasion process is often catalysed by enhanced protease activity and cell motility (Jiang et al. 2015). These two modalities of cell progression show how the carcinoma cells interact with surrounding tissues to reach stroma cells. When it happens, there is decreased intensity of cell-to-cell contacts (Jiang et al. 2015). The process is highlighted in the second stage of tissue invasion highlighted in figure 1 above.
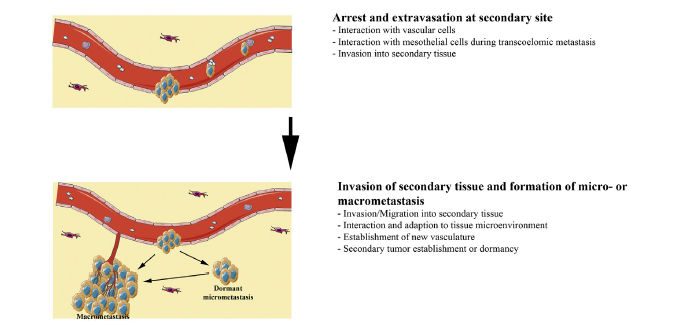
The angiogensis process characterises the third stage of tissue invasion where intravation occurs by allowing carcinoma cells to permeate the blood supply system and spread to other parts of the body (Jiang et al. 2015). At this stage of progression, there is a broad interaction of the carcinoma cells with cavity mesothelial and vascular cells (Jiang et al. 2015). In other words, the cancer cells start to move through the blood supply system and survive in circulation (Jiang et al. 2015). Through this process, extravasations could occur at a secondary site in the body. This process is highlighted in the fourth step of figure 1 above. At this stage of tissue invasion, interaction with vascular and mesothelial cells still occurs. Often, this stage of cancer progression is characterised by the invasion of carcinoma cells in the secondary tissues (Jiang et al. 2016; Pandya, Orgaz & Sanz-Moreno 2016).
In the last phase of tissue invasion described in figure 1 above, there is likely to be a formation of micrometastasis, which means that the carcinoma cells have established a new vasculature (Jiang et al. 2015). Stated differently, the secondary tumour is partly established at a secondary site and adapts to the tissue microenvironment. Overall, although the above-mentioned stages of tissues invasion appear direct and easy to follow, research studies have shown that there needs to be changes in cellular properties to support the different stages of tissue invasion (Jiang et al. 2015). However, the progression of the cancer may slow down when patients are given low toxicity drugs because they dismantle signalling pathways that aid in its progression. The process is linked with cell migration because a dismantled signal pathway limits the spread of cancerous cells.
Cell-Cell Adhesion
Cell-cell adhesion is one key area of research that has informed how tissue invasion in cancer occurs. Research has shown that intercellular structures play a significant role in determining how fast tissue invasion will occur, or whether it will occur at all (Jiang et al. 2016; Pandya, Orgaz & Sanz-Moreno 2016). Notably, abnormalities in intercellular structures play an important role in enhancing the potential for dissemination (Jiang et al. 2015). Genetic mutations or dysregulation could significantly influence how fast the primary tumours spread to secondary sites. This information has prompted some scientists to undertake further research byinvestigating the maintenance of tissue integrity as a preventive mechanism for curbing tissue invasion (Jiang et al. 2015). Most of them, have modelled their investigations on the claudin knockout model, which relies on experiments done on rats to come up with reliable clinical findings (Jiang et al. 2015). Their research investigations have also highlighted the role of cell-cell adhesion proteins in maintaining cell integrity during tissue invasion (Jiang et al. 2015).
EMT and Drug Resistance
Drug resistance poses a problem in cancer treatment. Shibue and Weinberg (2017) say there are two major types of drug resistance: intrinsic and acquired. Acquired resistance is caused by external factors involving treatment methods, while intrinsic resistance stems from patient-specific genetic factors (Shibue & Weinberg 2017). Such types of drug effects are associated with first-line chemotherapies and contribute to high cancer mortality rates (Jiang et al. 2015). Research studies that have focused on understanding factors affecting drug resistance centre on investigating molecular mechanisms that cause it in the first place (Si et al. 2019). Alternatively, past laboratory experiments focus on single-agent resistance levels, while current studies centre on understanding resistance through a multiple agency perspective (Shibue & Weinberg 2017).
Research studies have also shown that EMT plays a role in cancer growth. Some scholars, such as Du and Shim (2016), have also highlighted its effects on metastasis and drug resistance. Although there is contention regarding the causal relationship between EMT and metastasis, there is consensus that EMT contributes to drug resistance among cancer patients (Du & Shim 2016). Its effects on drug resistance stem from its influence on cancer pathways that affect its growth and development. Heery et al. (2017) explain that EMT has an effect on cells because it makes them similar to cancer stem cells. This similarity causes an effect on cell structures through drug efflux pumps and anti-apoptotic effects (Shibue & Weinberg 2017). Based on these outcomes, researchers have increasingly focused on EMT as a strategy for minimising drug resistance among cancer patients (Heery et al. 2017; Si et al. 2019).
Several researchers, including Shibue and Weinberg (2017), have provided evidence regarding the effects of EMT on drug resistance. They have also conducted experiments concerning the effects it has on different types of cancers and concluded that it causes drug resistance. For example, a study conducted by Beach and Bowtell (2016) to investigate the effects of EMT on patients who have pancreatic cancer showed that it contributed to drug resistance. This outcome was developed through laboratory tests, which suggested that EMT caused epithelial cells to lose their differentiated characteristics (Beach & Bowtell 2016). Therefore, it has an effect on cell-cell adhesion and the polarity of cell membranes.
Research studies have also shown that EMT is integral in regulating embryonic development (Shibue & Weinberg 2017; Beach & Bowtell 2016). This EMT function also supports adult tissue homeostasis (Jiang et al. 2016; Pandya, Orgaz & Sanz-Moreno 2016). Nonetheless, its activation could cause pathologic conditions that lead to drug resistance and increased tissue invasion (Shibue & Weinberg 2017; Beach & Bowtell 2016). Based on these findings, most of the scientific investigations that have investigated the functions of EMT demonstrate that it is a significant invasion driver (Shibue & Weinberg 2017; Beach & Bowtell 2016). EMT is also known to catalyse metastasis, especially in different types of cancers that are aggravated through tumor growth. Breast, prostrate, colorectal and pancreatic cancers outline the main type of diseases that share this characteristic (Jiang et al. 2015).
Treatment
Clinical Drugs
Chemotherapy is usually the first line of treatment for AML. Some common drugs used are Arsenic Trioxide, Cerubidine, and Cytarabine (ACS 2019). Other medications, such as dexamethasone are also used to manage the disease but the process of selecting the right drug is often defined by the stage of treatment (ACS 2019). The most common problem associated with the use of these drugs is tumor heterogeneity and the possible acquisition of drug resistance (Jiang et al. 2016; Pandya, Orgaz & Sanz-Moreno 2016).However, the main goal of using this treatment method is to induce remission. Patients may also receive radiation treatment to induce remission and in advanced cases, their therapies may include a stem cell transplant. However, the main type of genetic mutation that causes the cancer may influence the kind of treatment that doctors choose to use (Maksimovic et al. 2018). Typically, these mutations also affect a patient’s survival rate (Jiang et al. 2016; Pandya, Orgaz &Sanz-Moreno 2016).
The probability of treatment success also varies according to different demographic patterns because people who are aged below 65 years have a higher probability of success (35%) compared to patients who are above 65 years (10%) (Döhner, Weisdorf & Bloomfield 2015). Patients who cannot undergo intensive chemotherapy (because of poor health or other reasons) have the highest risk of treatment failure. In most cases, these people could only live for up to 10 months (Andreeff 2014). Although the survival rate for people who cannot undergo intensive chemotherapy is low, it is important to note that AML is curable. However, the chance of experiencing a full recovery depends on several factors, including cytogenetics, myelodysplastic syndrome and genotypes (Andreeff 2014).
Challenges in Research
Many researchers are still carrying out clinical trials in genotypic investigations to understand molecular alterations that have a prognostic impact. Consequently, different risk stratification schemas, such as FLT3-ITD and NPM1, are associated with the disease (Döhner, Weisdorf & Bloomfield 2015; Andreeff 2014). Based on advances in scientific evidence regarding the treatment of AML, the number of schemas should increase in the future. Alternatively, researchers are also undertaking clinical trials tounderstand the significance of different mutations ofAML (Jiang et al. 2016; Pandya, Orgaz & Sanz-Moreno 2016). These clinical trials are relevant to the understanding of existing treatment methods because they can prevent the occurrence of different types of mutations (Döhner, Weisdorf & Bloomfield 2015; Andreeff 2014). However, the prognostic importance of some mutated genes is not properly understood.
The process of diagnosing and classifying patients suffering from AML has taken different approaches, including the conventional morphologic methods, which have only recently been overtaken by the use of cytochemical methods (Andreeff 2014). Nonetheless, recent advances in research suggest that current methods for diagnosing and classifying AML incorporate an analysis of both chromosomal and somatically-acquired gene mutations (Andreeff 2014). Genetic classification has especially dominated disease classificationby providing consistencies in reportdescriptions and improvingoutcome predictions relating to AML diagnosis (Döhner, Weisdorf & Bloomfield 2015). Consequently, most researchers use it to influencetheir treatment decisions (Andreeff 2014).
Although AML mutations may affect any cytogenetic group of patients, most scientific advances in disease detection have had a significant impact on prognosis in at least 50% of patients who have AML (Andreeff 2014). This advancement in research has significantly improved prognostic outcomes among several groups of patients whose outcome riskhas been difficult to predict (Andreeff 2014). Consequently, there has been a shift in the characterisation of patients suffering from AML because instead of emerging as a homogenous group with equal or intermediate genetic risk, they appear as a diverse group of patients with different clinical outcomes (Andreeff 2014). The identification of molecular markers has been at the centre of most scientific advances relating to AML treatment because it hasprovided new insightsregarding the pathogenesis of the disease (Andreeff 2014). The identification of molecular markers has also contributed to the improvement of novel targeted therapies for managing the disease (Andreeff 2014).
Several global health agencies, such as the World Health Organization, have classified AML as a notable form of blood cancer, which is subject to clinical, morphologic, immunophenotypic and genetic features (Andreeff 2014). Particularly, the recurrence of genetic abnormalities in this type of cancer is central to the process of disease diagnosis (Maksimovic et al. 2018). These abnormalities have distinct genetic features that allow them to be classified into one group of AML, such as the “clinic-pathologic-genetic activity” (Andreeff 2014, p. 2). Researchers have also classified differences in AML morphology and immunophenotypes according to disease progression (Andreeff 2014).
AML Spreading and Metastasis
Brain metastasis occurs when cancerous cells are transported from the primary tumour into the brain matter. This process is associated with high cases of morbidity and mortality andthe invasion of the central nervous system sanctuary site (Santamaria et al. 2017). Characteristics of the blood-brain barrier contribute to high rates of failure associated with AML-targeted therapies because of theirlow permeability to chemotherapy agents (Basu et al. 2014). AML could present the samechallenge to affected patients. Victims of brain metastasis often present varied symptoms, including headaches, nausea and vomiting (Stavropoulou et al. 2016). Overall, there is scanty information about AML brain metastasis, which is characterised by the lack of sufficient knowledge regarding how malignant cells permeate the blood-brain barrier to survive in the unique anatomical site. Furthermore, there is scanty information available to explain the role of microglial cells in facilitating cancer metastasis in AML.
Existing research studies suggest that microglial cells form an important part of the brain’s immune system, as it is a naturally occurring component of the central nervous system. Therefore, in their natural state, they have anti-tumour functions. However, these cells can be easily polarized to create the opposite effect where they support the growth of tumour. Existing research explaining the role of microglial cells in AML suggest that they contribute to antiogenesis, dormancy and relapse of certain cancer cells. Therefore, in relation to other forms of brain metaststasis, microglial cells have a dual role in brain tumour progression because they could both abate or prevent growth.
The mechanism through which AML grows and spreads in the body is partly influenced by an understanding of its tissue invasion mechanisms. In the same breadth of analysis, drug resistance, in some groups of patients, often undermines AML treatment (Jiang et al. 2016; Pandya, Orgaz &Sanz-Moreno 2016).It is important to comprehend the role of the Epithelial-to-Mesenchymal (EMT) to understand how drug resistance among patients occur. EMT is a biological process that allows polarised epithelial cells to interact with cell baseline membranes to create changes in its biochemical components and enhance their migratory capacity (Expósito-Villén, Aránega & Franco 2018). EMT’sability to influence cell migration stems from a progressive loss of cell-to-cell contacts (Roche 2018b; Expósito-Villén, Aránega &Franco 2018). Its effects on actin cytoskeletal rearrangements are also a part of the changes that could occur on cell migratory capacity because they influence gene expression patterns, which enable cell migration (Expósito-Villén, Aránega & Franco 2018). Relative to this assertion, Expósito-Villén, Aránega and Franco (2018) say that epithelial cells are defined by the chemical components of their makeup.
The role of EMT in influencing cell migratory properties stems from its ability to make them acquire invasive and migratory properties by activating their latent embryonic programs (Roche 2018b). In other words, EMT allows epithelial cells to lose their cell polarity and consequently gain migratory properties. They can similarly acquire invasive properties to become mesenchymal stem cells (Liu & Lathia 2016). Stated differently, EMT helps to develop multipotent stromal cells, which could differentiate themselves into a variety of cell types (Roche 2018b). EMT also interacts with basementmembranes (via basal surfaces) to enhance resistance to apoptosis through the development of mesenchymal cell phenotypes (Expósito-Villén, Aránega & Franco 2018). Based on this understanding, EMT is involved in different forms of developmental and pathological events in AML treatment. In this regard, EMT occurs in different stages of embryonic development, such as gastrulation (Expósito-Villén, Aránega & Franco 2018). Its presence stems from its natural occurrence in normal embryonic development. It is also present in tissue regeneration and is an important part of wound healing processes (Roche 2018a; Roche 2018b).
The onset of metastasis requirestissue invasive therapies (Fan 2016). EMT enables this process by allowing carcinoma cells to break through the membrane because of heightened invasive properties of the cells (Fan 2016). The migration may spread further into the bloodstream through intravasation. When the cells exit the bloodstream, they form micro-metastases (Liu & Lathia 2016). The process is often associated with mesenchymal-epithelial transition (MET) through the interaction of EMT and MET processes to complete invasion-metastasis (Fan 2016). In the context of cancer progression, EMT has partly been associated with PD-L1 expression, which causes decreased efficiency and functioning of the immune system (Roche 2018b). Its effects could lead to the growth of cancer cells. Therefore, EMT plays a pivotal role in influencing the rate of tumour invasion by influencing immune functions to control the spread of cancer through decreased surveillance in advanced stages of cancer progression (Liu & Lathia 2016). Consequently, EMT provides a framework for which tumour cells can adapt to their environment and aid in the progression of cancer growth. They could also be used to understand the occurrence of AML.
Usually, EMT does not occur wholly in cancer cells. Therefore, some of themare only partially affected (Roche 2018a). This characteristic affectstumour cells because they are often in multiple transition stages, which may cause mixed epithelial genes (Roche 2018a). The hybrid cells, which have partial EMT often move as clusters and can be more aggressive than cancer cells, which have full EMT (Roche 2018a). EMT regulation is conducted using several signallingpathways in different biological events. The process is reversible and may lead to mesenchymal-to-epithelial transition (Roche 2018a). The reversal could affect circulatory cancer cells, thereby influencing the creation of secondary tumours in certain types of cancers (Roche 2018a).Nonetheless, EMT is pivotal in influencing different developmental processes of cancer progression, such as mesoderm formation. It is also useful in creating neural tube formations (Liu & Lathia 2016).
EMT Processes in AML
AMT processes are pivotal to understanding AML treatment because they are critical in the development of myeloid and lymphoid development (Liu & Lathia 2016). Therefore, evidence has shown that they play a critical role in the progression of leukaemia and lymphoma (Roche 2018a). In this regard, EMT has been used as a critical method for differentiating aggressive and malignant types oftumours. Based on this discussion, studies show that cells, which have undergone EMT, often manifest morphological changes, such as differences in cell polarity, which may influence cancer progression.
Although the materials reviewed in this study highlight current developments in AML cancer research, they poorly explain the function of mesenchymal cells in supporting tissue repair for AML. Notably, it is difficult to properly comprehendtheir role in influencing tumour invasiveness and metastasis in AML treatment (Fan 2016). This gap in research has also been highlighted by some studies, such as those authored byFerrao et al. (2015). They suggest that molecular cells and inhibitors influencing cancer growth and progression (which are seen in EMT) are still in clinical trial stages and the progress has not been well documented or updated in academic literature (Ferrao et al. 2015). This research strives to fill this gap.In addition, it is important to undertake this study because the research on AML treatment is still scanty and poorly reported. Furthermore, past studies need to be updated to further expand the body of literature surrounding the mechanism of tissues invasion and drug resistance in AML.
The findings of this study will be instrumental in better classifying patients into different AML groups. This way, it would be easier for healthcare practitioners to administer the appropriate kind of therapy on affected groups and adapt treatment methods to the right kind of patient. In this regard, the findings of this study will be instrumental in promoting the development of personalised therapeutic strategies for AML. The research aim and questions that guide the review are highlighted below.
Research Aim and Questions
Research Aim
To understand the mechanism of tissue invasion and drug resistance in AML and the possible role of EMT in AML progression
Research Questions
- What mechanism do cancerous cells in AML use to invade tissues?
- Does EMT contribute to drug resistance in the treatment of AML?
- What is the effect of EMT on AML progression?
- Do microglial cells influence the cell migration patterns for cancerous cells in AML?
Methodology
According to Collins and Cooper (2014), there are two main types of research approaches: qualitative and quantitative. The quantitative research approach was used in this study because we conducted investigations in a laboratory. Stated differently, the experimental nature of the investigations made it possible to quantify the effects of the variables analysed. Hemminki (2015), Bingham, Dean and Castillo (2019) affirm the link between the quantitative research approach and experimental research design by suggesting that the latter is one of the oldest methods of quantitative research. We adopted the experimental research design because tests were conducted under scientifically acceptable conditions. It also helped us to find out whether a change in the dependent variable (drug resistance in AML) was solely attributed to a corresponding change in the independent variable – mechanism of tissue invasion.
Leppäniemi (2014) defines this type of analysis as a cause-and-effect relationship whereby laboratory results were solely based on specific actions or changes made in the empirical setting. We did not use other designs under the quantitative research framework because they did not offer full control of the variables. Consequently, the selected method provided a stronger review of the variables compared to other research designs. Dhivya et al. (2016) support this view. Lastly, the experimental research design was selected for use because it offered targeted results (Green et al. 2017). This capability was invaluable to us because of the need to identify the effects of constant variables on the dependent and independent variables. For example, it helped to review the role of EMT in drug resistance.
Cell Lines
The experiments undertaken in this study were done using a mouse microglial cell line. They originated from theBV2 and the eGFP-MV4-11 cells. The purpose of using the cell line assessment was to assess disease progression or changes in protein components for the selected samples. The two drugs used in the experiment were Dnr and Cyt. Experiments were conducted over a 16-day period, which started on 24.5.2019 and ended on 27.6. 2019. The materials used for the experiment included a gun pipette
(5ml and 10ml pipette), haemocytometer, pipette tips (p1000,p100, p20, p10), incubator, two types of flasks (T25 and T75), micropipettes p1000,p100, p20, p10, microscope, marker, beaker for waste, tubes (15 ml and 50 ml) and a centrifuge machine. Others were a fluorescence plate reader (BioTekHL FLx800, serial number: 270946, LAMBDA excitation: 485/20 filter, LAMBDA emission: 528/20 filter; Gen S 2.04 software), aspirator machine, Pasteur tips, and a capturing cells device (Nicon eclipse Ti, equipped with 37degrees and 5% Co2 environmental chambers).
The experiment was conducted by observing specific rules related to health and safety. Relative to this assertion, Green et al. (2017) say the main goal of observing health and safety procedures in a laboratory is to prevent injury or the contamination of cell specimens. To meet this goal, we worked on the surface of the laboratory tables after they were cleaned with IMS (70%) and tissue paper. All the required equipments were also sterilised with IMS 70% before being placed on the table. For example, the gun pipette and micropipette were sanitised in this manner but the micropipette tips, racks, chemical tubes/beakers, 5ml and 10ml pipettes and flasks did not need further cleaning as they were already sanitised. We also had to clean hands and dress them with gloves every time before using the equipments or touching the samples. This action was aimed at avoiding contamination.
Once we opened the lids of the above-mentioned tubes, they were put upside down and away from contamination. In addition, the 5ml or 10ml Pipettes always had covers to prevent the entry of foreign materials. Furthermore, the gun pipette was never tilted upwards to prevent breakage. Alternatively, any liquid drops or spillage were cleaned with IMS 70% immediately but for the incubator, doors were closed immediately to maintain the right level of CO2. We also made sure that the centrifuge machine had balanced liquids to prevent breakage. Lastly, the haemocytometer chambers were always cleaned immediately after use. After observing these safety procedures, we embarked on the tests.
AML Cell Line
The experiment involved the eGFP-MV4-11. It is a human leukaemia cell line, which has been used in several experiments around the world to investigate blood cell formations (Ferrao et al. 2015). It proliferates continuously when in a cultural medium with a doubling time of up to 48 hours (American Cancer Society 2019; Andreeff 2014). The cell-line was derived from a 56-year-old woman who was originally diagnosed with AML. It is important to understand that the proliferation of HL-60 cells occurs through transference. The presence of receptors on cell surfaces also influenced the rate of its proliferation. Overall, Zhang, Gu and Chen (2019) say that the eGFP-MV4-11 continues to provide a constant source of human cells of studying AML. Its application has often been documented in experiments that require an aqueous environment (American Cancer Society 2019; Andreeff 2014).
Cell Morphology
On the first day of experimentation, the BV2 were placed in cells for a few days to investigate whether they proliferated under specific conditions, or not. The BV2 cell line was macroglial and the culture medium was comprised of DMEM/F-12 (1:1) (1x): Dulbecco’s modified Eagle medium comprised of F-12 nutrient mixture (HAM), L-glutamine, and 15mM (HEPES). It was also combined with 10% FBS, which was essential for the maintenance and growth of cultured cells.
Culturing Procedure
The culture medium was yellow and the instrument used to make the observation was EBV DMEM/F-12. Gibco Company manufactured it. Its reference number was 11039-021. For purpose of harvesting the cells, we followed a 12-step process. The first one was defined by the use of the aspirate Pasteur for the entire medium in the flask (ebv2). Later, 2ml of trypsin was added into the flask before it was covered and incubated. Afterwards, we quenched the trypsin reaction with the same culture media and tapped the bottle to get cells off the sides. The next step involved adding 10ml of media to the flask with a 10ml pipette. The cells were later suspended and transferred to a 15ml tube where they were centrifuged at 15000rpm for five minutes. Afterwards, the content was removed but the supernatant was left inside the tube. We suspended the cells with 1ml of ebvdmem/f-12 medium (to mix them fully) and transferred 1/10th (100microliter) with p100 to the flask. The last step involved adding an extra 7ml cultural medium to the flask containing the cells before incubation.
The cells had to be in 85-100% confluency before being used in the experiment. Trypsin is a serine protease and it helped to cleave cell adhesion proteins to promote cell detachment. The EDTA 0.05% was also used as a chemical (calcium chelator) that prevents the activity of cell adhesion molecules, thereby promoting cell detachment. The BV2 cells were transferred into a beaker and then with gun pipette, trypsin was put in the original flask of BV2 and the pipette discarded. Thereafter, a flask was placed in the incubator for five minutes (at 37degrees and 5% CO2) and with 5ml. In addition, EBV DMEM/F-12 Media was transferred to the flask and then the vial tube, which was developed by Gibco Company (reference number 11039-021). To determine the volume of ml in 2 x 10^5, we used the following equation: 2 x 10^5 / 4 x 10^5 = 0.5ml.
For the culturing cells, we cleaned the chambers with IMS 70% and placed the slide on top. Afterwards, 5ml of RPMI culture media was transferred to the tube with supernatant. Lastly, an aliquot was inserted to the chambers and counted.
The values for the counting cells were: TL: 72, TR: 80, BL: 76, and BR: 71. The average was 7.4 x 10^5 cells/ml.Alternatively, the total number of cells in the 7ml tube was derived using the following equation: (7.4 x 10^5) x 7 = 5180000 cells.
The BV2 cells were seeded in 96 well plates. We seeded 10,000 cells per well and it was expected that by after three days, they would have reached their desired confluency level (this estimated time plan was subject to the growth rate of the cells). On the first day, the experiment, eGFP-MV4-11 cell was seeded alone, but on the second day, BV2 cells were added. On the third day, we aspirated the medium from the BV2 cells and seeded them in a cultured volume of 400 µL RPMI. The growth rate was determined by the general-purpose cultural medium, which aided in the growth of microorganisms. The cells were cultured for four days, while the densities of the wells were 4,000, 7,000, and 13,000 cells in 200 μl cell culture media. The seeded cells were later incubated for about 17 hours. Zhou et al. (2017) say that typically, low number of cells should be cultured when the experiment period lasts for more than three days. Our strategy aligned with this recommendation. As part of the final procedure of assessment, the cells were gently lifted from their culture vessels and placed on the 96-well filter bottom. Thereafter simulation occurred as desired. At the end of the process, the cell culture medium was removed from the bottom of the well. This process happened using gentle aspiration and by holstering through a vacuum manifold.
Isolation Procedure
To separate the mixture and get the pellets of cells, we centrifuged the cells in the vial tubes (15000RPM for 5 minutes at a temperature of 25 degrees). Thereafter, the supernatant liquid in the vial tube was transferred to a beaker and tilted at one go). The pellets were left to settle and the contents (EBV DMEM/F-12) transferred to the tube. We later suspended the contents with a 5ml pipette 10 and transferred it into the haemocytometer chambers. Lastly, the cells under the microscope were counted under a 10x magnification.
On the second day of experimentation, we cleaned the haemocytometer with IMS 70% and then placed the slide on the chamber. A aliquot of the cells in the flask were also taken to the chambers, using 20 microliter pipette and the cells counted under a microscope with the 10x magnification lens. The healthy ones were smooth and round while the abnormal ones were spiky and/or with a dark appearance. Only the healthy cells were counted. After doing so, we calculated the average number needed per squareand multiplied it by 104 to determine the number of cells/ml required. This was also known as initial concentration.
After determining the cell suspension needed, we took a T25 flask, wrote the initials and dated it with the cell line. Thereafter, 3.7ml cell suspension was transferred with the 5ml pipette to the flask and 3.3ml medium. The densities of the wells were 4,000, 7,000, and 13,000 cells and the volume of the culture media was in 200 μl. The medium used was RPMI-1640 with l-glutamine and sodium bicarbonate, and 10% FCS or FBS. The contents were later suspended and incubated at 37°c at 5% CO2 for three days. RPMI was a growth medium used when formulating the cell culture and it was combined with 10% FCS.
On the third day of experimentation, eGFP-MOV4-11 cell numbers were determined as described above and 3 flasks with 7ml volume with a concentration of 2 x 10^5 cells/ml were seeded. Then, two T25 flasks containing eGFP-MV4-11 cells were prepared. Flask 1 contained untreated cells and flask 2, cell treated with 500nM cytarabine. Thereafter, incubation happened for 3 days at 37degrees and 5% CO2.On the fourth day, BV2 cells were harvested using 0.05% Trypsin/EDTA as described above.On the 5th day of experimentation, weexposed the cells to calcium serum for purposes of proliferation (rpmi-1640 medium: l-glutamine and sodium, LOT number: RNBH2463. Microglia bv2 cells: dmem/f-12 medium). To do so, two T25 flasks with 7ml in each at 4 x 10^5 cells/ml were prepared so that flask 1 was for control (it contained 2.5ml cell suspension and 4.5ml media without any drug) and the second one was cytarabine (the cytarabine contained 2.5ml cell suspension and 4.5ml media and 0.875 microlitre drug). There was a need to calculate the volume of media using the formula: C1V1=C2V2. The process of rearranging the equation and keying in the numbers yielded a result of 2.5 ml (v1 = 2.5ml). This number was derived by following the calculations below.
2.5ml = 4 x 10^5 cells/ml (7ml) / 1.08 x 10^6 cell/ml
To find out how much Media was required, we subtracted 2.5 from 7 to get 4.5ml. (7-2.5=4.5ml). Therefore, 2.5ml cell suspension and 4.5ml media was needed. Similarly, the volume of Cytarabine drug needed was 0.875microliter. The incubation process took three days and the amount of Cytarabine drug needed was 0.875microliter. The calculations are shown in day three of experimentation. Flask 1 was the control experiment; it contained 2.5ml cell suspension, while 4.5ml media was drug-free. Flask 2 was Cytarabine, which contained 2.5ml cell suspension, 4.5ml media and 0.875 microlitre drug. Lastly, the contents were incubated for three days.
Assessing Changes in Cell Morphology
On the sixth day of experimentation, we sought to investigate changes in cell morphology by setting a cell line EGFP of mv4-11 and the culture medium (RPMI) with 10% FBS. There was a need to culture the cells with microglia because they became motile in high concentrations. The purpose of doing so was to determine whether the cells were migratory or motile after administering the two drugs in AML. At the trypsinization stage, we followed 12 steps, which included aspirating culture media in the flask (ebv2), adding 2ml trypsin in it using a 5ml pipette, incubating for approximately 2 minutes and detaching the cells. Thereafter, we added 10ml eagle medium to the flask with a 10ml pipette, suspended the cells with a pipette and transferred all the contents to the 15ml tube. This process allowed for centrifugation at 15000RPM for 5minutes at 25degrees (room temperature) after which the liquid in the tube was discarded but the supernatant was left. To maintain the cells, a 5ml pipette (1ml DMEM/F-12 media) was added to the tube. The media was suspended with the supernatant and an extra 4ml media added to the tube. Lastly, the haemocytometer was setup and an aliquot added to the chambers. Cell counting followed.
Considering the values of TR, TL, middle and average were 111, 108, 106, and the average being 1.08 x 10^6 cells/ml, it was important to determine the volume of final suspension because we had 30 wells and wanted to seed 10,000 cells per well (each well had 200microliter). The number of total cells was derived using the formula below.
30×10000 = 300000
Consequently, the main question asked was: If there is 1.08 x 10^6 cells in 1ml, how many ml would be for 300000??
1.08 x 10^6 —> 1ml
300000 —> x
The answer was derived as highlighted below.
300000/1.08 x 10^6 = 0.27ml or 270microliter
Based on the above outcome, the final volume of suspension used was 6ml, after following the calculations provided below.
6-0.27=5.73ml of bv2 media.
Afterwards, we tested the AML cells and Bv2 in a tube mix using 5.73ml media and 270microliter cell suspension. To do so, 200microliter was taken from the mixed tube and transferred to the plate (the plate needed to be divided into 4×6 (A-D, 7-12). The plate was incubated and to grow and maintain cells, 200microliter of the suspension was transferred from the original tube to the flask, while 7ml media was added using a 10ml pipette. The content was suspended and incubated thereafter.
The seventh day of experimentation was a continuation of the processes outlined in the sixth stage. Throughout the process, wewere still keen on investigating whether the cells changed or proliferated by adding RPMI to microglia cells. Three steps were followed to achieve this objective. The first one involved transferring media in the treated and control flask to a 15ml tube, using a 15ml pipette and a pipette gun. The second step involved suspending both tubes and the last step concerned setting up the haemocytometer and counting the cells. Doing so required a careful review of the volumes of concentrations included in the experiments.
The values for TR, TL, middle and average values in the control experiment were 210, 205, 202, and 20.5 x10^5 cells/ml. Comparatively, the value for the treated (Cyt) for BR, BL, middle and average values were 57, 64, 58 and 5.9 x 10^5 cells/ml. The final concentration was derived using the formula C1V1=C2V2. Therefore, to obtain the value of v2, the formula was rearranged to v2= C1V1/C2. The computation is as outlined below.
v2: 30.75ml = 20.5 x 10^5 cells/ml (6ml) / 4 x 10^5 cells/ml
Based on an ascertainment of the value of v2, the media was suspended with 1ml and the final calculations are outlined below:
30.75-1= 29.75 RPMI media
For the treated part (Cyt), we had to ascertain the value of v2 and it was computed when the values for c1, c2, and v1 were 5.9 x 10⁵ cells/ml, 4 x 10⁵ cells/ml, and 6ml, respectively.
v2= C1V1/C2
The value of v2 was derived by following the calculation below
5.9 x 10^5 cells/ml n(6ml) / 4 x 10^5 cells/ml = 8.85ml.
To ascertain the stock concentration of Dnr needed, 10micromolar was added in each well at 100nM, while 1.5ml RPMI was added to the Dnr tube at 200nM. Using the formula v1=C2V2/c1, the value of v1 was established as outlined below.
V1 (0.03ml (30microliter) = 200nM (1.5ml) / 10microMolar
The stock concentration of v2 was 4mM at 2micromolar concentration and it was derived using the calculations below:
V1 (0.00075ml (0.75microliter) = 2micromolar (1.5ml) / 4mM
Broadly, the amount of Dnr needed was 30microliter and Cyt was 0.75microliter. Two new 15ml tubes were taken and labelled with the initials, name, and date of drugs. Thereafter 1.5ml RPMI media was added to both tubes (in Cyt tube 0.875microliter was added and in Dnr tube 30microliter was added). Later, 100microliter of Dnr was included in row C and 100microliter Cyt to row D. The content was incubated thereafter.
The seventh step highlighted above produced two flasks which had concentrations of 4 x 10^4 cells/ml and 7ml of culture. The concentration of Dnr drug was 20nM and Cyt was 500nM. A 5ml pipette was used to suspend the treated and control flasks and an aliquot of liquid was taken from the flask and inserted to the chambers (from the control flask). A determination of the amount and cell content to mix was done using the equation: C1V1=C2V2. The values for C1 C2, V1, and v2 were 18.46 x 10^5 cells/ml, 4 x 10^5 cells/ml, x, and 7ml, respectively.
By rearranging the formula to v1=C2V2/C1, and inputting the above-mentioned values, a quantity of1.51ml was obtained (v1: 1.51ml) using the calculation below:
18.46 x 10^5 cells/ml (7ml) / 4 x 10^5 cells/ml
To obtain the final volume of mixture, we subtracted 1.5ml from the results (7-1.51=5.49ml). This finding meant that 1.51ml cell suspension was needed and 5.49ml RPMI media.
To find out the stock concentration of Cyt, 4mM, with a final concentration of 500nM and a final volume of 7ml was sought. The model C1V1=C2V2 was used to make the calculations and the values of c1, c2, and v2 were 4mM, 500nM (converted to mM which is 0.0005), and 7ml. After rearranging the equation, the model v1=C2V2/c1 emerged. The volume of Cyt was 0.000875ml or 0.875microliter and the calculations are highlighted below
0.875microliter = 500nM (7ml) / 4mM
Alternatively, the stock concentration of Dnr (10microMolar) was obtained with a final solution of 20nM and a volume of 7ml. Using C1V1=C2V2 and the values of c1, c2, and v2 being 10micromolar, 20nM (converted to micromolar, which is 0.02micromolar), and 7ml, the quantity of Dnr used was 0.014ml or 14microliter based on the rearranged equation v1=C2V2/c1. The calculations are provided below.
0.014ml = 20nM (7ml) / 10micromolar
On the 9th day of experimentation, we sought to find out whether the Cyt killed the AML cells or stopped its proliferation based on the presence of a pinkish colour, which suggests that no waste was produced, or the absence of pH. Comparatively, a yellow colour meant that waste was produced and a high pH value observed. We followed three steps in this stage of assessment. The first one involved the transfer of media in the treated and control flask to a 15ml tube, using a 10ml pipette and a pipette gun. The second step required us to suspend both tubes and the last one involved setting up the haemocytometer to count the cells.
There were two sets of mixtures assessed on this day of experimentation: control and treated (Cyt). The desired concentration was 4 x 10^5 cells/ml using the initial volume of 6ml. The values of c1, C2, and V1 were 6.8 x 10^5 cells/ml, 4 x 10^5 cells/ml, and 6ml. Using the model C1V1=C2V2 and inputting the values highlighted above, the value of V2 emerged as 10.2ml after following the calculations below:
v2 10.2ml = 6.8 x 10^5 cells/ml (6ml) / 4 x 10^5 cells/ml
However, there was a need to dilute the concentration further to get an equal value because the original mixture was higher than 4 x 10^5. To do so, we added 4.2ml fresh RPMI media (10.2-6=4.2ml).The concentrations of c1, c2, and v1 for the treated part were 2.6 x 10^5 cells/ml, 4 x 10^5 cells/ml, and 6ml, respectively. By rearranging the formula to get v2, we came up with the following equation: v2= C1V1/C2. Based on this formula, the value of v2 was 3.9ml by following the calculations below
3.9ml = 2.6 x 10^5 cells/ml (6ml) / 4 x 10^5 cells/ml
The concentration for the Cyt was lower than 4 x 10^5. Therefore, there was a need to centrifuge it to get equal values. Thereafter, a fresh medium was added and centrifuged at 15000rpm for five minutes. Thereafter, we discarded the liquid in the Cyt flask and added 3.9ml fresh RPMI to the same flask with supernatant and suspended the content. Thereafter, all BV2 cells were aspirated in the plate and then as done in Day 7, 200microlitre RPMI was added to the first row.
Row A had only RPMI culture media (200microliter), while row B included the addition of 100microliter RPMI media. Comparatively, row C contained Dnr at 200nM (v2= 100nm) and row D had Cyt at 2microMolar (v2= 1micromolar). Alternatively, 3×3 wells were untreated and treated as seen in the table provided on day 7. The first row (A) was filled with 200microlitre RPMI media and then the wells were divided to 3×3 as shown before. The wells were also filled with untreated, treated, untreated and treated with 100microliter. The amounts of Dnr and Cyt drugs were calculated in day 7. The amount of Dnr needed was 30microliter and the Cyt was 0.75microliter.
We followed three steps of experimentation on the 10th day of analysis. The first one involved using 5ml pipette and suspending the AML cells. Thereafter, a small amount was transferred from the flask into the chambers before counting the cells. For the seeding part, we only followed two steps which involved preparing two T25 flasks with 7ml in each (at 4 x 10^5 cells/ml) so that flask 1 was control and flask 2 was Cytarabine. The second step involved doing calculations to establish the initial volume of media needed.
These calculations were done similar to the other days highlighted above using the equation C1V1=C2V2. The values of C1, C2, and V2 were 1.43 x 10^6, 4 x 10^5 cells/ml, and 7ml. A rearranged equation (to get the value of v1) was formulated as follows: v1=c2v2/c1. The calculations were as outlined below.
4 x 10^5 cells/ml (7ml) / 1.43 x 10^6 = 1.9ml.
A determination of the amount of media required was done by subtracting 7 from 1.9 to get 5.1 (7-1.9=5.1). Therefore, 1.9ml cell suspension and 5.1ml media was used. Comparatively, the volume of Cytarabine drug needed was 0.875microliter (calculations are shown in day three).
On the 11th day of experimentation, we followed 14 steps of analysis. They included aspirating the culture Media in the flask (ebv2), adding 2ml trypsin in it using a 5 ml pipette, incubating the contents for approximately 2 minutes, and once the cells were detached, we tapped the flask to enhance the process. Thereafter, 10ml eagle medium was added to the flask with a 10ml pipette, the cells suspended with a pipette, all contents transferred to the 15ml tube, centrifuged at 15000RPM for 5minutes at 25degrees (room temperature), and then the liquid in the tube discarded to a beaker but the supernatant left intact. The last five steps involved using 5ml pipette to add 1ml DMEM/F-12 media to the tube to maintain cells, suspending media with the supernatant, adding an extra 4ml media to the tube, setting up the haemocytometer, adding an aliquot to the chambers, and finally counting the cells.
In the seeding flask, the values of TR, TL, middle and average concentrates were 186, 185, 170, and 18 x 10^5 cells/ml, respectively. As mentioned before, we had 30 wells that each contained 10000 cells per well for the seeding flask. Therefore, there were 30×10000 = 300000 cells in total. However, we sought to find out how many ml would be needed for 300000 cells. The question was answered through the following calculations:
300000/18 x 10^5 = 0.16ml or 160 microliter
This finding meant that 0.16 cell suspension was needed.
On the 12th day of experimentation, we transferred the media in the treated and control flasks to a 15ml tube using a 10ml pipette and a pipette gun. Both tubes were suspended and a haemocytometer used to count cells. The TR, TL, middle and average values for the control flask were 143, 134, 146, and 14.1 x 10^5 cells/ml. Comparatively, the BR, BL, middle and average values for the treated (Cyt) flask were 36, 32, 40, and 3.6 x 10^5 cells/ml. To get the value of v2 for the control part, the model v2= C1V1/C2 was used and the calculations were undertaken as shown below:
21.15ml = 14.1 x 10^5 cells/ml (6ml) / 4 x 10^5 cells/ml
However, the available concentration was more than 4 x 10^5. Therefore, we had to dilute it to get an equal solution by adding 15.15ml fresh RPMI media using the calculations below:
21.15-6=15.15ml
Comparatively, to get the value of v2 for the control (Cyt), the following formula was used v2= C1V1/C2 and the calculations provided below.
3.6 x 10^5 cells/ml (6ml) /4 x 10^5 cells/ml = 5.4ml
For Cyt, the concentration was lower than 4 x 10^5, so there was a need to centrifuge it first to get the same concentration and fresh medium added afterwards. Thereafter, we discarded the liquid in the Cyt flask and added 5.4ml fresh RPMI to it. In addition, 15.15ml fresh RPMI media was added to the control flask and all bv2 cells aspirated in the plate. Afterwards, as done in day 7, 200microlitre RPMI was added in the first row. Row A had only RPMI culture media (200microliter), while row B included the addition of 100microliter RPMI media. In row C, 100microliter of Dnr was added and in row D 100microliter Cyt was included. Thereafter, we divided the wells to 3×3 and filled them with untreated or treated 100microliter, as highlighted in day 7. The amount of Dnr and Cyt drugs used were calculated in day 7 (the amount of Dnr needed was 30microliter and Cyt was 0.75microliter, with 1.5ml fresh RPMI). Afterwards, we took two new 15ml tubes, labelled them with initials, date and name of drugs before incubation. For the seeding cells, the EGFP flask was suspended. From this content, 0.5ml was in the flask and fresh 7ml RPMI added to the original content. The solution was later suspended.
On the 13th day of experimentation, we used a 5ml pipette and suspended AML cells (EGFP MV4-11 flask). A small amount of cells from the flask was also transferred into the chambers and the cell counting process commenced afterwards. For seeding purposes, two T25 flasks were prepared with 7ml in each at 4 x 10^5 cells/ml. Therefore, flask 1 was control and flask 2 was Cytarabine.
Calculations to find out the initial volume are provided below.
V1 = C2v2/C1
4ml = 4 x 10^5 cells/ml (14ml) /1.4 x 10^6 cells/ml
To find out how much media was required, we subtracted 4 from 14 to get 10ml (14-4=10ml). So 4ml cell suspension (2ml in each tube) and 10ml RPMI media (5ml in each tube) was needed. Comparatively, the amount of Cytarabine drug needed was 0.875microliter and the calculations are fully shown in day three. Flask 1 was control and it contained 2ml cell suspension and 5ml media without any drug. Comparatively, Flask 2 was Cytarabine and it contained 2ml cell suspension, 5ml media and 0.875 microlitre drug. Thereafter, we incubated the contents for three days. However, for purposes of maintain the cells, a 0.5ml pipette was suspended into the flask and another one of 7ml RPMI added using a 10ml pipette. The contents were also suspended and incubated.
On the 14th day of experimentation, we aspirated culture media in the T75 flask (ebv2) and added 4ml 0.05% EDTA to it with a 5ml pipette. Thereafter, the solution was incubated for approximately 2 minutes and once the cells were detached, the flask was tapped to further detach the cells. Afterwards, 10ml was added to the eagle medium (DMEM/F-12) in the flask with a 10ml pipette and the cells suspended with a pipette. The solution was transferred to the 15ml tube (the volume was approximately 14ml) and centrifuged at 15000RPM for 5 minutes at 25 degrees (room temperature). We later poured out the liquid in the tube to a beaker and left the supernatant.
Using a 5ml pipette, 1ml DMEM/F-12 media was added to the tube to maintain cells and the media suspended with the supernatant. An extra 4ml DMEM/F-12 media was also added to the tube (the total volume was 5ml), the haemocytometer set up and an aliquot added to the chambers. Cell counting commenced afterwards. The values for TR, TL, BL, and BR were 95, 84, 80 and 75, respectively, while the average was 8.3 x 10^5 cells/ml. For the seeding flask, 300000 cells were assessed.
We sought to find out how many ml would be for 300000 using the calculations below
300000/8.3 x 10^5 cells/ml = 0.36ml or 360microliter
Therefore, 0.36ml cell suspension was needed, while the final volume was 6ml. In other words, 6 -0.36 = 5.64ml of bv2 media (0.36ml cell suspension and 5.64ml bv2 media). Thereafter, using a p200 pipette, we suspended 360microliter into 15ml tube and then with a 5ml pipette, transferred 5.64ml of DMEM/F-12 media to it. Incubation was the last step undertaken but before doing so using p200 pipette, we poured 200microliter into the plate (4×6 wells).
On the last day of experimentation, we transferred the media in the treated and control flask to a 15ml tube, using a 10ml pipette and a pipette gun. There were two sets of experiments: control and treated (Cyt). The solutions for the control part were TR, TL, middle, and average and they were 120, 110, 116, and 11.5 x 10^5 cells/ml, respectively. The concentrates for the treated part were bottom right (BR), bottom left (BL), middle and average were 47, 34, 50, and 4.3 x 10⁵ cells/ml. To get the value of v2 for the control, part, we had to compute the values of c1, c2, and v1, which were 11.5 x 10⁵ cells/ml, 4 x 10⁵ cells/ml, and 6.5ml, respectively. So rearranging the equation to v2= C1V1/C2 and putting the values into the equation we will get v2: 18.7ml using the calculation below:
18.7 ml = 11.5 x 10^5 cells/ml (6.5ml) / 4 x 10⁵ cells/ml
Since the concentration was more than 4 x 10⁵, dilution had to occur by adding 12.2ml fresh RPMI media (18.7-6.5=12.2ml). The values of c1, c2, and v1 for the control part were 4.3 x 10⁵ cells/ml, 4 x 10^5 cells/ml, and 6.5ml, respectively. To obtain the value of v2, the equation had to be rearranged to v2= C1V1/C2. The value of v2 was obtained by following the calculations below:
v2: 6.9ml = 4.3 x 10⁵ cells/ml (6.5ml) / 4 x 10⁵ cells/ml
Since the concentration was more than 4 x 10⁵, we had to dilute it by adding 0.4ml (400microliter) and fresh RPMI media (6.9-6.5=0.4ml). Thereafter, fresh RPMI medium was added to the tubes (control: 12.2ml and Cyt: 0.4ml) and all BV2 cells aspirated in the plate. As done on the 7th day of experimentation, 200microlitre RPMI was added in the first row. Broadly, row A had only RPMI culture media (200microliter), but 100microliter RPMI of the content was added to row B. Similarly, we added 100microliter Dnr to row C and a similar quantity of Cyt to row D. Thereafter, the wells were divided to 3×3 as shown before, and the wells filled by untreated, treated, untreated and treated with 100microliter. The amount of Dnr and Cyt drugs were calculated in day 7, whereby fixed values were used for preparing the drugs. The amount of Dnr needed was 30microliter and Cyt was 0.75microliter, with 1.5ml fresh RPMI. Before incubation, we took two new 15ml tubes, labelled them with initials, date and name of drugs. The experiment ended at this point.
Image Analysis
The data was analysed by assessing changes in cell components. For example, the differences in shape, sizes and motility of the cells were investigated throughout the different stages of assessment. These changes were observed when one or both of the drugs were used and the results compared. The image analysis was done using Fiji application and Microsoft Excel software. We used Nikon TiElipse microscope at 10 X to generate the images. Broadly, the overall data analysis process was done using Fiji application and Microsoft Excel. The Fiji application was used because it contained many useful plug-ins for assessing the images. The Microsoft Excel method was also used because of its flexibility in aggregating data. In addition, it helped to identify the standard error and deviation for the data obtained.
The results showed a comprehensive analysis of images and visualisation tools in a format designed for optimum usability and efficiency. The first stage of analysis involved the use of streamlined workflow tools to visualise the samples. Some of them were edited at this stage. The second step involved the segmentation and classification of images. This step of analysis also involved comprehensive image processing functions. For example, auto-alignment was used for reviewing overlays and removing ambiguous backgrounds to reveal critical cell features. When the results of one image were satisfactory, the same analytical technique was applied to a different set of images, which were obtained from undertaking other types of treatment. The process of measuring the images was done by analysing the findings using different measurementtools. For example, distance, angles and area were evaluated to determine cell shapes. The cells were also categorised in terms of their area, length or shape. The images were sorted and displayed based on size and roundness. The images obtained were calculated using brightness values from the formula V=(R+G+B)/3. This methodology was developed from the parameters explained in Fiji handbooks. Lastly, as affirmed by Kolar (2015), we undertook an ethical assessment by abiding by the university’s rules of conducting research.
Assessing Shape of Microglial Cells
We investigated whether the presence of microglial cells changed the shape parameter under study by analysing the cells’ area of spreading, circularity profiles, aspect ratios (AR), and roundness. The roundness of cells was defined by the measure of elongation. Elongation was assessed by calculating the distance between the length and width of the cell boundaries. The result was a measure of object elongation. The value of measurement was between a 0 and 1. A measurement closer to 1 means that the cells were either square or circular. However, when the value was far from 1, it meant that it had more elongation. This analysis is defined using the formula below
Elongation = width bounding-box / length bounding box
Elongation was also measured by analysing the maximum region thickness, while the roundness of a cell was calculated as the ratio of the area of an object to the area of a circle (which shares the same convex perimeter). A circular object will have a value of 1, while the value of an object that departs from this index will be less than 1. We computed the aspect ratio by measuring the cell’s height with its width. The following formula shows how it was done
Aspect ratio = height / width.
Results
To recap, the aim of the analysis we conducted was to check what would happen to the AML cells once they reached the brain microenvironment. Specifically, the focus of investigation was to understand the effects of themicroglial environment on AML cells. Consequently, in this section of the report, we will investigate whether the presence of BV2 microglial cells changed the shape parameters under study by finding out whether pre-treatment with Cytarabine altered the cell shape. Two possibilities could emerge from the investigations: the cells change shape (meaning there was migration) or they were not migratory and remainednear microglial cells.It was vital to undertake this review because evaluating changing cell shapes helped us to understand the invasive properties of their membranes and, by extension, the probability of the transfer of cancer cells.
Do BV2 Microglial Cells Change the Shape of eGFP-MV4-11 AML cells?
Figure 2 below shows the results obtained when investigating whether BV2microglial cells changed the shape of eGFP-MV4-11 AML cells after accounting for all the above-mentioned dimensions.
Figure 2 below shows the results for the area investigation.
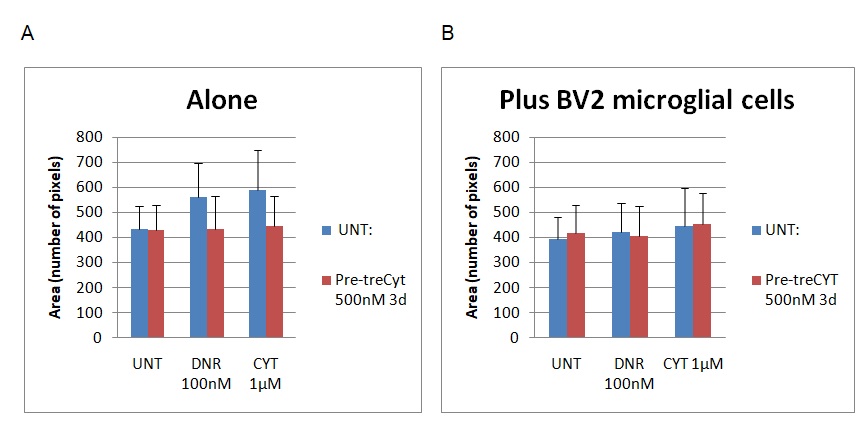
The statistics identified above were assessed based on the arbitrary unit as the main index of measurement. In the context of this analysis, the arbitrary unit is the vertical measurement of the cells. The graph on the left (graph A) shows the results of the cell area without BV2 microglial cells, while the one of the right (graph B) shows the results after adding the BV2 component. The cell dimensions were reviewed based on the number of pixels characterising the cell structure (see Y-axis). The values ranged from 0 to 800. According to figure 2 above, the addition of BV2 microglial cells caused changes in the area under assessment by reducing the number of pixels on the UNT, Dnr, and Cyt columns by 20 pixels. The lowest difference was observed on the CYT column because the pixels only slightly decreased from 449 to 447. Here, “UNT” refers to untreated material, while Dnr and Cyt refer to the two drugs in the experiment (Daunorubicin and Cytarabine). The changes were statistically significant because the p<0.5.
Figure 3 below outlines the findings of the circulatory assessment.
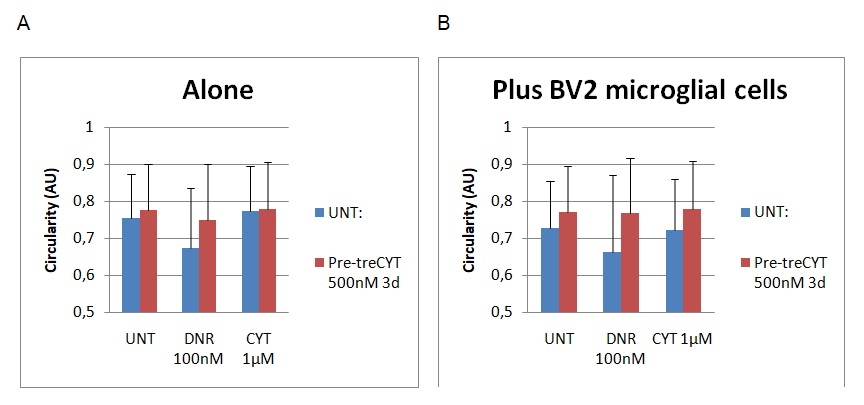
Graph A shows the results for the cell dimensions before BV2 treatment, while graph B shows a different set of results after the addition of BV2 microglial cells. The circulatory nature of the cells was reported after examining values from 0.5 to 1 (on the Y-axis). The results showed a slight decrease in the circularity shape of the cells after the addition of BV2 microglial cells because the UNT, Dnr and Cyt columns registered marginal differences in value. The biggest changes were observed on the Dnr and Cyt columns where the cell’s circular nature decreased from 0.78 to 0.65 on the Dnr column and 0.79 to 0.71 on the Cyt column. Again, it is important to remember that “UNT” refers to untreated material, while Dnr and Cyt refer to the two drugs in the experiment (Daunorubicin and Cytarabine). The changes were statistically significant because p<0.5.
The findings of the AR assessment are provided in figure 4 below.
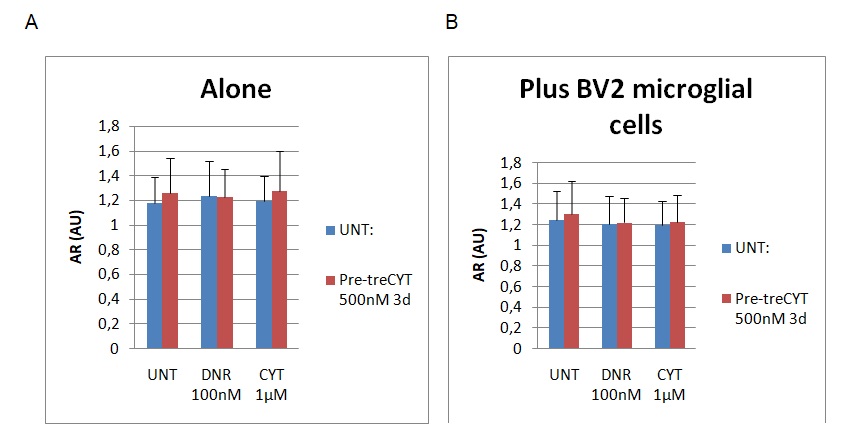
Graph A represents the findings of the AR assessment without the addition of BV2 microglial cells, while graph B represents the findings of the assessment after the addition of BV2. The AR values were measured using a scale of 0 to 1.8, whereby 0 represented the least value, while the highest value of aspect ratio was 1.8. Figure 4 above also shows slight reductions on the cell shape based on the AR column after adding BV2 microglial cells (see graph B). For example, the AR decreased from 1.3 to 1.2, while marginal differences in AR were observed on the DNR and CYT columns (their values ranged around 1.2). To recap, “UNT” refers to untreated material, while Dnr and Cyt refer to the two drugs in the experiment (Daunorubicin and Cytarabine). The changes were statistically significant because the p<0.5.
The last dimension of cell function analysed was roundness. Figure 5 below shows the findings of the dimensions before and after the addition of BV2 microglial cells.
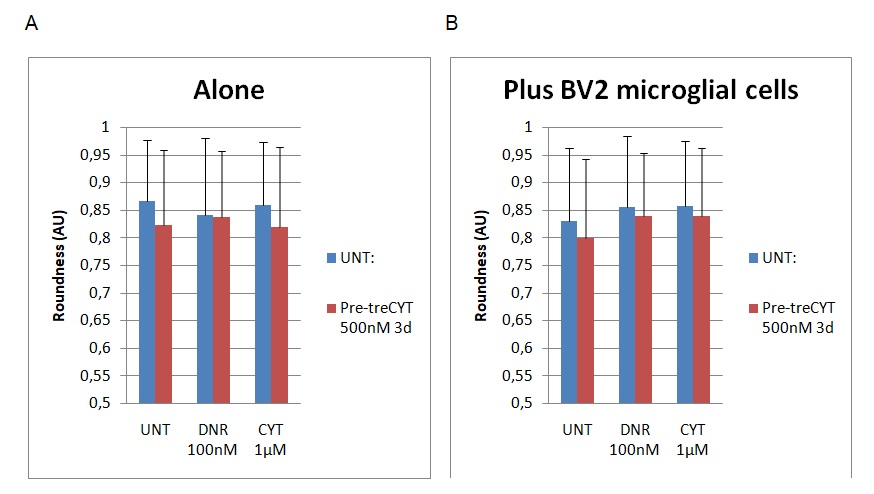
The findings highlighted in graph A show the dimensions of cell roundness before the addition of BV2. However, graph B shows a different set of findings after the addition of BV2 microglial cells. Figure 5 above shows that the roundness of the cells declined slightly from 0.88 to 0.82 because of the addition of BV2 microglial cells in the UNT group. The addition of the Dnr increased cell roundness from 0.83 to 0.87. A similar trend was observed through the addition of CYT to the experimental group because the value changed from 0.84 to 0.87. To recap, “UNT” refers to untreated material, while Dnr and Cyt refer to the two drugs in the experiment (Daunorubicin and Cytarabine). The difference in the roundness of the cells was statistically significant because the p<0.5. Therefore, based on the findings highlighted above, the presence of microglial cells slightly altered cell shape by making it more elongated.
Does Pre-Treatment with Cytarabine Alter the Cell Shape?
Another area of assessment undertaken in the investigation is a determination of whether pre-treatment with Cytarabine altered the cell shape. The findings are presented in figure 6 below.
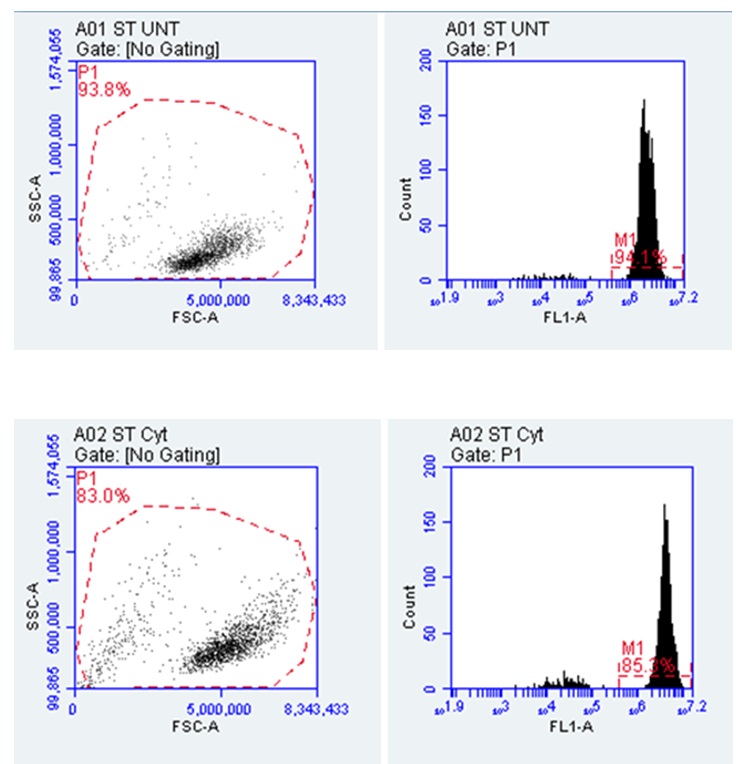
Figure 5 above shows that the percentage of cell viability reduced from 94% to 85% after pre-treatment with Cytarabine. The viability of the cells is informed by the fact that dead cells are often associated with false positive results because of their links to reagents (Salman et al. 2019). This is why Salman et al. (2019) suggest that dead cells have to be removed from the flow cymetry data before analysis. The results from figure 5 show that the cells are viable because of changes in granularity, which are occasioned by differences in SSC-A values on the Y-axis. This outcome affects the cytoplasmic complexity of the cells, meaning that they could change the permeability and fluidity of the cells to cause migration. Changes in the cytoplasmic complexity were also affirmed by changes in the cell area, which decreased from 93.8% to 83%. This change in numbers means that there is a slight difference in yield, which could also alter the cytoplasmic complexity by a small margin. Alternatively, studies by Suarez-Carmona et al. (2019) demonstrate that the strongest correlations between the yield and the cell area should occur between 25% and 45%. Therefore the statistics obtained in this study mean that pre-treatment with Cytarabine slightly decreased the cell surface area.
Broadly, the cell shapes observed were measured by reviewing the imaging data, size and granularity of the flow cytometry. A numerical assessment of the findings is presented below.
Table 1. Cells Changing Shape after Days of Treatment (Source: Developed by Author). Table 1 above shows that the P1 for the FSC-A increased from 4,413,555.77 to 4,895,028.90. The P1 values for the SSC-A also increased from 283,910.14 to 408,693.21. The changes in the value of FSC-A means that there were significant changes in cell size while changes in the value of SSC-A indicated cell complexity. The change in the value of SSC-A also implies changes in the granularity of the cells. These changes in P1 value imply that the Cyt treatment significantly altered the shape of the cells. The percentage change for Plot 1 (A01 ST UNT) was greater that a similar change in percentage for A02 ST Cyt because the latter changed from 100% to 83%, while the former changed from 100% to 93.7%. These statistics mean that the biggest area change in cell size was observed after the administration of Cyt. These findings were obtained after scaling the FSC-A correctly.
The results indicate an increase in cell size and cytoplasmic complexity that suggest a possible increase in cell differentiation. These effects could potentially lead to cell migration and the spread of AML. Confirmation of cell migration involves a review of changes in cell structure from a round to a protrusive or ellipsoidal shape supported by variations in FSC-A and SSC-A values. The changes are often linked to the formation of cell protrusions and cell polarity – processes that are associated with cell movements and an increase in their circumference (Jiang et al. 2016; Pandya, Orgaz& Sanz-Moreno 2016).
Discussion
As seen from the experiments highlighted in this study, EMT plays a moderating role in regulating AML progression because it could increase the rate of cancer progression by converting tumours to be highly invasive cancer cells. The research is backed by evidence, which shows how EMT markers have influencedthe progression of specific cancers and tumours (Chen, Liao & Yang 2018). Based on a combination of existing evidence and the findings of this study, it is plausible to see the role of EMT in influencing malignant cell migration. To recap, our study strived to understand the mechanism of tissue invasion and drug resistance in AML and the possible role of EMT in AML progression through sustained treatment using Dnr and Cyt.
Firstly, we considered the presence of Dnr, which is a common chemotherapydrug for the treatment of cancer. Its relevance to this study is informed by its widespread use in the treatment of AML (its application also spreads to other types of cancers, including acute lymphocytic leukemia (ALL) and chronic myelogenous leukemia (CML)) (Chen, Liao & Yang 2018). Its effects on the cell morphology may stem from its inherent attribute to block certain cell functions, such as topoisomerase. This effect means that it has the potential to slow the growth of cancer cells, just as in the case of AML.
The effects of Dnr on the cell morphology could be linked with its mechanism of action, which is defined by the interaction with deoxyribonucleic acid (DNA) (National Cancer Institute 2019). Its ability to influence molecular biosynthesis could also explain its effects on the cell structures observed in the experiment. This effect means that the rate of cell progression will be enhanced. In this regard, Dnr has the ability to break the DNA chain of progression, which would influence cancer progression. Stated differently, the progress of cell replication could be significantly impeded. However, the use of this drug in the wider area of AML treatment should be reviewed with caution because studies have linked Dnr with fatal cardiac outcomes (Chen, Liao & Yang 2018).
Secondly, Cytabarine was used as another drug treatment for AML because of its link with Dnr. Indeed, most types of Dnr treatment also involve Cyt (Chen, Liao & Yang 2018). A combination of both drugs is assumed to form the backbone of induction therapy (National Cancer Institute 2019). Although, Cytcould have toxic effects on humans, its cytosine and arabinose bases make it an effective metabolic agent. This property could be largely used to explain its effects on the cell structure during the experiments. Similar to Dnr, Cytalso has the ability to interfere with human DNA, thereby explaining why it may be useful in AML treatment. Therefore, rapidly dividing cells that are dependent on a similar rate of DNA replication are most affected by Cyt. Here, itis important to point out that Cyt is a unique drug in AML treatment because it affects the sugar components of cell structures, while other treatments simply affect the base (Chen, Liao & Yang 2018). Although the two drugs made significant changes to the cell structures, Santamaria et al. (2017) caution that their administration is subject to the type of cancer under review and its stages of progression. The efficacy of these drugs in cancer treatment is partly associated with their success in treating the blastic phase of AML (Chen, Liao & Yang 2018).
The data obtained in this study suggest that changes in the P1 and FSC-A values connoted changes in cell shapes, which were possibly influenced by the presence of Cyt and Dnr. Their effects on microglial cells, which often cause inflammation on the central nervous system, could explain their possible incremental effect on cell parameters (Stavropoulou et al. 2016). However, changes in cell shape may not necessarily imply variations in brain metastasis because the latter is often regulated by the blood-brain barrier, which is typically impermeable to chemotherapy agents (Stavropoulou et al. 2016). Therefore, assessments linked to brain metastasis need to be focused on the nature of the broader central nervous system. Relative to this assertion, it is important to point out that the role of microglial cells in explaining neuropathological conditions for cell migration is still poorly understood.
As demonstrated from the experiment results, the treatment of the cell tissue using Daunorubicin and Cytarabine caused significant changes to the cell shapes. This outcome means that the above-mentioned drugs could alter the mechanism of cell adhesion and perhaps tissue invasion. In other words, the use of Cyt and Dnr may infuse EMT-phenotypes, which may cause drug resistance among AML patients (Santamaria et al. 2017; Stavropoulou et al. 2016). Therefore, the phenomenon could explain why some patients develop drug resistance in AML treatment. Subject to this observation, the expressions of Dnr and Cyt in the experiments could mean that they influence membrane extensions and the migratory ability of AML cancer cells. However, they suggested that such interactions depended on the polymerization of the cells. Stated differently, the migratory expression of Dnr and Cyt documented in this study is used to explain the migratory capacity of cancer cells. When both drugs (Cyt and Dnr) are used together, they create migratory pathways that are similar to EMT-phenotypes. This interaction promotes migration and the interaction of cancer cells with stroma cells.
A study by Basu et al. (2014) suggests that Cyt and Dnr may inhibit cell progression by slowing down the rate of migration. The samereport also suggests that the two drugs may influence a cell’s DNA synthesis rate (Basu et al. 2014). However, we do not anticipate that these possible effects of Dnr and Cyt could explain the changes in cell shape observed in the experiments because the findings of Basu et al. (2014) above were observed when the drugs were administered in high dosages. These findings draw attention to the possible role of EMT in influencing cell activity.
EMT can affect the nature of cells, meaning that it has an impact on cell growth. Researchers, such as Zhou et al. (2017), Chen, Liao and Yang (2018) who say that the dynamism of EMT may convert epithelial cells to mesenchymal phenotype have supported this assertion. Here, it is important to point out that EMT does not exist as a complete formation in cancer cellsbecause tumor cells may occur in different transitional states. It is projected that such cells move in partial EMT. Based on the cell structure changes observed in the experiments, EMTappears to have an effect on cell adhesion. Therefore, it possibly has an influence on drug effectiveness during AML treatment.
Cellular polarity may also be affected by the EMT and contribute to its effects as well. In more extreme cases, EMT has been known to remodel the cytoskeleton and create changes in the adhesion of cell matrix (Chen, Liao & Yang 2018). Based on these findings, we could assume that EMT has an effect on the migratory properties of a cell. This effect is likely to affect its invasive properties. Nonetheless, there is a need to develop more knowledge on the role of EMT in influencing drug resistance. The mechanism through which EMT affects the migratory environment should be further explored as well (all aspects of this study were focused on understanding the cell migratory environment and the mechanism through which tissue invasion happens).
Broadly, the findings of this study show that the use of Dnr and Cyt drugs may affect cell response to drugs. However, this finding comes as no surprise because the two drugs have been implicated in differential responses to chemotherapy (Chen, Liao & Yang 2018). Therefore, they are relevant inunderstandingthe role of EMT-like phenotypes in AML treatmentthrough a similar mechanism of promoting drug resistance. Here, it could be deduced that the EMT regulates the cultural environment of the cells by repressing epithelial genes, which regulate cell adhesion. Furthermore, EMT has been linked to metastatic dissemination through the functional changes it mediates in the cell structure of cancerous cells. Interestingly, EMT has been shown to regulate cell polarity and adhesion (Chen, Liao & Yang 2018). The process allows them to gain migratory properties, thereby redefining the invasive properties of the cancerous cells. Typically, they are associated with the production of mesenchymal stem cells, which can replicate into a variety of cells. Based on this analysis, the EMT emerges as an essential developmental ingredient, especially for the metastasis case of cancer progression.
Broadly, the initiation of metastasis in AML requires invasion that EMT helps to accomplish. Therefore, when carcinoma cells in AML lose cell adhesion, they penetrate the cell basement membrane because of its invasive properties. The process of intravation also allows it to enter the blood stream. It is expected that these circulating tumour cells will exit the blood stream and form micrometastases. These metastatic sites may pave the way for further cloning and growth of the cells. Therefore, the role of EMT could be deemed to involve the initiation and completion of the invasion process. At this stage of development, AML cancer cells may undergo other stages of growth to optimise their survival.
Studies that have explored the role of EMT in prostate cancer growth have arrived at the above-mentioned conclusion because they demonstrated that it helps tumour cells to adapt to their microenvironment, thereby promoting the resurgence and progression of cancer (Santamaria et al. 2017; Stavropoulou et al. (2016). Current research is exploring the production of inhibitors that would slow down the process but clinical trials are not comprehensive enough to support the development of comprehensive findings. Nonetheless, several studies have established the link between EMT and drug resistance (Jiang et al. 2015; Stavropoulou et al. 2016). In addition, inflation, which has ordinarily been associated with the progression of cancer, has also been linked with inflammation-induced EMT (Santamaria et al. 2017; Stavropoulou et al. (2016). Based on these findings, we are persuaded to believe that EMT allows cells to gain a migratory phenotype. The same outcome could be associated with multiple immunosuppression and drug resistance.
Independent studies suggest that cells, which undergo EMT often, assume stem cell-like properties (Santamaria et al. 2017; Stavropoulou et al. (2016). The process has been associated with the rise of cancer stem cells (Jiang et al. 2015). Consequently, EMT emerges as a danger to cancer patients. Its undesirability is characterised by its ability to help cancerous cells to enter the blood stream and spread by gaining stem cell-like properties (Stavropoulou et al. 2016). Nonetheless, it is important to recognise the place of current research in this area of analysis because they divert our attention from the invasive properties of EMT to its role in promoting resistance to chemotherapy drugs. Overall, based on an analysis of the research materials highlighted in this study, we find that that DNR and Cyt may be inducing a migratory phenotype in AML cells.
Conclusion
As highlighted in chapter one of this investigation, the aim of this study was to understand the mechanism of tissue invasion and drug resistance in AML and to evaluate the possible role of EMT in AML progression. The review was guided by four research questions, which focused on investigating whether EMT contributes to drug resistance in the treatment of AML, finding out the effects of EMT on AML progression, exploring factors that influence cell migration patterns for cancerous cells in AML and examining mechanisms that cancerous cells in AML use to invade tissues.
Chemotherapy is the most common treatment for AML, while Cyt and Dnr drugs are commonly administered when such treatments are initiated. The commonality of Cyt and Dnr in chemotherapy explains why we used the two drugs in the experiments. Since AML is caused by the rapid spread of cancerous cells across cell tissues (through the blood stream), there was a need to understand how to minimise its incidences based on a review of the invasive properties of cancerous cell membranes. Based on the above-mentioned insights, we demonstrated that drug resistance is the leading cause of poor AML treatment. In other words, the treatment of AML continues to be problematic because of drug resistance issues. As a result, many people die because of the ineffectiveness of existing treatment methods.
Overall, the experiments undertaken in this study were based on an analysis of cell lines and observations were done over several days. The review was predicated on understanding how Dnr and Cyt treatments affect the efficacy of existing therapies, based on existing pieces of evidence, which show howcurrent therapies have failed to show promising results, depending on their low levels of success in preventing cancer progression. In addition, current knowledge suggests that existing chemotherapy techniques have posted poor results, in terms of reducing the incidences of remission or even causing it in the first place. Consequently, a growing body of literature has strived to explore the mechanism of existing therapies, especially in defining tissues invasion, with the aim of improving treatment success. This study stems from this line of investigation.
Our findings suggested that EMT causes drug resistance in AML treatment because of its ability to influence cell adhesiveness by promoting an elongated shape related to migrating cells (as those undergoing and EMT-like phenotype in AML). In this regard, EMT has a strong effect on AML progression because it provided the right environment for the spread of cancerous cells through weakened cell adhesiveness. These findings were developed after reviewing factors that influence cell migration patterns, which were assessed by analysing the roundness, circulatory nature and aspect ratios of the cells. The evidence showed that an elongated shape related to increased migratory activity. Although the findings of this study are pivotal to understanding the mechanism of drug resistance, the focus has only been on tissue invasion. There is a strong need to expand this scope of research because tissue invasion is a small part of AML research.
Reference List
ACS 2019, Targeted therapy drugs for acute myeloid leukemia (AML), Web.
American Cancer Society 2019, What is acute myeloid leukaemia (AML), Web.
Andreeff, M 2014, Targeted therapy of acute myeloid leukaemia, Springer, New York, NY.
Banyard, J & Bielenberg, DR 2015, The role of EMT and MET in cancer dissemination’, Connective Tissue Research, vol. 56, no. 5, pp. 403-13.
Basu, SK, Remick, SC, Monga, M & Gibson, LF 2014, ‘Breaking and entering into the CNS: clues from solid tumor and nonmalignant models with relevance to hematopoietic malignancies’, Clinical & Experimental Metastasis, vol. 31, no. 2, pp. 257-267.
Beach, JA & Bowtell, DL 2016, ‘Commentary on epithelial–to–mesenchymal transition contributes to drug resistance in pancreatic cancer’, Cancer Research, vol. 26, no. 4, pp. 7075-7077.
Bingham, AJ, Dean, S & Castillo, J 2019, ‘Qualitative comparative analysis in educational policy research: procedures, processes, and possibilities’, Methodological Innovations, vol. 6, no. 1, pp. 1-10.
Chen, SC, Liao, TT & Yang, MH 2018, ‘Emerging roles of epithelial-mesenchymal transition in hematological malignancies’, Journal of Biomedical Sciences, vol. 25, no. 1, pp. 37-42.
Collins, CS & Cooper, JE 2014, ‘Emotional intelligence and the qualitative researcher’, International Journal of Qualitative Methods, vol. 2, no. 1, pp. 88-103.
De Craene, B & Berx, G 2013, ‘Regulatory networks defining EMT during cancer initiation and progression’, Nature Reviews Cancer, vol. 13, no. 2, pp. 97-110.
Dhivya, S, Khandelwal, N, Abraham, SK & Premkumar, K 2016, ‘Impact of anthocyanidins on mitoxantrone-induced cytotoxicity and genotoxicity: an in vitro and in vivo analysis’, Integrative Cancer Therapies, vol. 3, no. 2, pp. 525-534.
Döhner, H, Weisdorf, DJ & Bloomfield, CD 2015, ‘Acute myeloid leukemia’, The New England Journal of Medicine, vol. 373, no. 12, pp. 1136-52.
Du, B & Shim, JS 2016, ‘Targeting epithelial-mesenchymal transition (EMT) to overcome drug resistance in cancer’, Molecules, vol. 21, no. 7, p. 965.
Expósito-Villén, A, Aránega, A & Franco, D 2018, ‘Functional role of non-coding RNAS during epithelial-to-mesenchymal transition’, Non-coding RNA, vol. 4, no. 2, p. 14.
Fan, H (ed.) 2016, Circulating tumor cells: isolation and analysis, John Wiley & Sons, London.
Ferrao, TP, Behren, A, Anderson, R & Thompson, E (eds) 2015, Cellular and phenotypic plasticity in cancer, Frontiers Media SA, New York, NY.
Green, LK, Zareie, P, Templeton, N, Keyzers, RA, Connor, B & La Flamme, AC 2017, ‘Enhanced disease reduction using clozapine, an atypical antipsychotic agent, and glatiramer acetate combination therapy in experimental autoimmune encephalomyelitis’, Multiple Sclerosis Journal – Experimental, Translational and Clinical, vol. 4, no. 1, pp. 1-10.
Heery, R, Finn, SP, Cuffe, S & Gray, SG 2017, ‘Long non-coding RNAS: key regulators of epithelial-mesenchymal transition, tumour drug resistance and cancer stem cells’, Cancers, vol. 9, no. 4, p. 38.
Hemminki, E 2015, ‘Experimental research in public health’, Scandinavian Journal of Public Health, vol. 43, no. 5, pp. 445-446.
Jiang, C, Li, X, Zhao, H & Liu, H 2016, ‘Long non-coding RNAs: potential new biomarkers for predicting tumor invasion and metastasis’, Molecular Cancer, vol. 15, no. 1, p. 62.
Jiang, WG, Sanders, SA, Katoh, M, Ungefroren, H, Gieseler, F & Prince, M 2015, Tissue invasion and metastasis: molecular, biological and clinical perspectives. Seminars in Cancer Biology, vol. 35, no. 1, pp. 244-275.
Kolar, R 2015, ‘How long must they suffer? Success and failure of our efforts to end animal tragedies in laboratories’, Alternatives to Laboratory Animals, vol. 43, no. 2, pp. 129-143.
Leppäniemi, A 2014, ‘What can we learn from a critically ill mouse?’, Scandinavian Journal of Surgery, vol. 103, no. 4, pp. 225-225.
Liu, H & Lathia, JD 2016, Cancer stem cells: targeting the roots of cancer, seeds of metastasis, and sources of therapy resistance, Elsevier, London.
Maksimovic, N, Zaric, M, Gazibara, T, Trajkovic, G, Maric, G, Miljus, D, SuvajdzicVukovic, N, Tomin, D, Virijevic, M, KisicTepavcevic, D & Pekmezovic, T 2018, ‘Incidence and mortality patterns of acute myeloid leukemia in Belgrade, Serbia (1999⁻2013)’, Medicina, vol. 54, no. 1, p. 5.
National Cancer Institute 2019, Drugs approved for leukemia, Web.
Pandya, P, Orgaz, JL & Sanz-Moreno, V 2016, ‘Modes of invasion during tumour dissemination’, Molecular Oncology, vol. 11, no.1, pp. 5-27.
Quail, DF& Joyce, JA 2017, ‘The microenvironmental landscape of brain tumors’, Cancer Cell, vol. 31, no. 3, pp. 326-341.
Roche, J 2018a, ‘The epithelial-to-mesenchymal transition in cancer’, Cancers, vol. 10, no. 2, p. 52.
Roche, J (ed.) 2018b, The epithelial-to-mesenchymal transition (EMT) in cancer, MDPI, New York, NY.
Salman, H, Shuai, X, Nguyen-Lefebvre, AT, Giri, B, Ren, M, Rauchman, M, Robbins, L, Hou, W, Korkaya, H & Ma, Y 2019, ‘SALL1 expression in acute myeloid leukemia’, Oncotarget, vol. 15, no. 9, pp. 7442-7452.
Santamaria, PG, Moreno-Bueno, G, Portillo, F & Cano, A 2017, ‘EMT: present and future in clinical oncology’, Molecular Oncology, vol. 11, no. 7, pp. 718-738.
Schürch CM 2018, ‘Therapeutic antibodies for myeloid neoplasms-current developments and future directions’, Frontiers in Oncology, vol. 8, no. 152, pp. 1-33.
Shibue, T & Weinberg, RA 2017, ‘EMT, CSCs, and drug resistance: the mechanistic link and clinical implications’, Nature Reviews. Clinical Oncology, vol. 14, no. 10, pp. 611-629.
Si, W, Shen, J, Zheng, H & Fan, W 2019, ‘The role and mechanisms of action of microRNAs in cancer drug resistance’, Clinical Epigenetics, vol. 11, no. 1, p. 25.
Singha, M, Yellea, N, Venugopala, C & Singh, S 2017, EMT: mechanisms and therapeutic implications’, Pharmacology and Therapeutics, vol. 182, no. 2, pp. 80-94.
Staudt, D, Murray, HC, McLachlan, T, Alvaro, F, Enjeti, AK, Verrills, NM & Dun, MD 2018, ‘Targeting oncogenic signaling in mutant flt3 acute myeloid leukemia: the path to least resistance’, International Journal of Molecular Sciences, vol. 19, no. 10, p. 3198.
Stavropoulou, V, Kaspar, S, Brault, L, Sanders, MA, Juge, S, Morettini, S,
Tzankov, A, Iacovino, M, Lau, I, Milne, TA, Royo, H, Kyba, M, Valk, PJ, Peters, A & Schwaller, J 2016, ‘MLL-AF9 expression in hematopoietic stem cells drives a highly invasive AML expressing EMT-related genes linked to poor outcomes,’ Cancer Cell, vol. 30, no. 1, pp. 43-58.
Suarez-Carmona, M, Lesage, J, Cataldo, D & Gilles, C 2019, ‘EMT and inflammation: inseparable actors of cancer progression’, Molecular Oncology, vol. 11, no. 7, pp. 805-823.
Watanabe, T & Ernst, P 2016, ‘Context, context, context: new gene programs linked to bad behavior in MLL-AF9-initiated leukemia’, Cancer Cell, vol. 30, no. 1, pp. 3-5.
Zhang, J, Gu, Y & Chen, B 2019, ‘Mechanisms of drug resistance in acute myeloid leukemia’, Oncology Targets Therapy, vol. 11, no. 12, pp.1937-1945.
Zhou, P, Li, B, Liu, F, Zhang, M, Wang, Q, Liu, Y, Yao, Y & Li D 2017, ‘The epithelial to mesenchymal transition (EMT) and cancer stem cells: implication for treatment resistance in pancreatic cancer’, Molecular Cancer, vol. 16, no. 1, pp. 52-57.