Introduction
The fundamental nature of the flow of oil, gas, and water in a three-phase stage characterizes the transportation of petroleum mostly from offshore hydrocarbon production and transportation points to onshore storage. In the production stages, water plays a significant role in the regulation of pressure. Pressure changes are critical in the three-stage flow of the fluids (Akbar, Plummer & Ghiaasiaan 2003, p.2). The three-phase flow takes place at the same time within the same pipe because water is injected into the fluids at the early stages. The three-phase flow behavioral characteristics arise because of the injection of water at latter stages within the wells, with natural gas and oil streams combining to influence the multiphase oil flow (Akbar, Plummer & Ghiaasiaan 2003, p.3). The flow patterns of the oil, gas, and water in the multiphase stages need to be understood to provide the basis for comprehending the multiphase flow of the oil, gas, and water from offshore to onshore storage reservoirs (Akbar, Plummer & Ghiaasiaan 2003, p.50). An accurate model on the flow of fluids in pipes which could result from this study could provide information about proper management techniques during the production and transportation of oil and gas from offshore regions to storage reservoirs. It could further enable the injection of water into a flowing stream of oil and gas to enhance the transportation of oil and gas. Injecting water to maintain appropriate pressure leads to the three-phase flow of water, oil, and gas in wellbores, sub-sea production lines, surface gathering systems, gas lift wells, and pumping systems in surface gathering lines (Balasubramanian & Kandlikar 2003, p.7). Toward that end, the oil-gas-water three-phase experimental flows on vertical and horizontal pipes have been conducted and observations made leading to the classification of the flow patterns into three phase flow patterns.
With the emerging behavioral flow line patterns, complex problems are experienced with the flow of oil, gas, and water at the production and transportation phases. The fundamental nature of the problems experienced with the flow of the fluids requires a clear understanding to design better oil and gas production and transportation systems and associated pipeline design parameters that directly influence the pressure gradient, the flow patterns, and other problems which include the formulation of hydrates and emulsions, and wax and asphaltene deposition (Bonjour & Lallemand 1998, p.4). To comprehend the behavioral characteristics of the fluids in the multiphase flow stages and solve the flow associated problems, the flow of the fluids is observed at the same time in the experimental setup. Previous research has shown that most experimental models were conducted based on low viscosity oils with the first experimental research conducted using horizontal pipes with appropriate test pressures of 5 bars, 38.0 m long pipe, and 7.62 cm ID pipe (Hibiki & Mishima, 2000, p.4). Observations showed that fluids with different viscosity provided different flow behavioral patterns, with different models showing different results.
The current study aims to design an experimental system for oil/ water/gas three-phase flows to model and obtain experimental data that could enable the ability to predict fluid flow patterns, pressure drops during the production and transportation phases, and obtain the general agreement among the different flow patterns.
Aim
To design an experimental system for oil /water/gas three-phase flow system.
Objectives
- To study the emerging flow patterns of the multiphase flow of oil/water/gas
- To study spatial distribution, pressure gradient, turbulence, and the multiphase flow
Literature Review
The fundamental nature of the flow patterns of oil-water, and gas from the production points and transportation to offshore storage facilities presents a number of problems and challenges that need to be addressed based on accurate, modeling of the flow patterns of oil, water, and gas in a multiphase flow. The current study is to provide a reliable design of an experimental system for oil-water–gas three-phase flows which is a fundamental solution in applications such as designing water-lubricated pipes, artificial lift methods, production strings in wells, and water lubricated pipelines. Of critical concern is the flow of oil, gas, and water in the same piping system during the production and transportation of oil and gas from offshore storage facilities.
Research has shown a significant number of multiphase flow experiments have been conducted using oil, water, and gas with a gap in experimenting with the dynamic flow characteristics of oil, gas, and water emerging. A clear comprehension of the behavior of water/oil/gas in motion provides a basis for determining solutions related to water-caused corrosion problems on the transportation pipes. That is in addition to determining the performance of separation facilities, and multiphase pumping systems.
Flow patterns through helically coiled pipes
Experimental studies of the multiphase flow have shown that the flow structure of the water and oil mixture varied significantly from that of oil and gas. The underlying cause of the differences in the flow patterns is due to the large momentum transfer capacity, lower free energy at the interfaces because of the shorter interfacial formations, the small buoyancy effects experienced during the fluid flow, and the existence of smaller dispersed phase droplet sizes. In addition, the effects causing the differences in the flow characteristics of the fluid mixtures are mainly due to the diverse properties of the oil, water, and gas. In context, the viscosity of the oil/water mixture varies significantly between very high and very low figures. One of the experiments conducted to determine the characteristics and structure of the flow of oil, water, and gas mixture is carried out using two helically coiled tubes with the coil diameter inner diameter of 39 mm and coil diameters of 265 and 522.5 mm. the results, when analyzed showed oil to be dispersed in water when gas and liquid intermittent was used, and oil dispersal in the slug and film when the condition for gas and liquid intermittent flow was made.
High Viscosity three-phase oil/water/gas flow
One of the sources of knowledge on the flow characteristics of oil, water, and gas in a three-phase flow constituting vertical and horizontal pipes, compared with other models with the experimental study was an experiment conducted by (Xu 1999, p.23). The context of the study of the flow of oil, water, and gas is based on the heavy oil, bitumen, and extra heavy oil shown to constitute 70% of the oil reserves in the world (Wilmarth & Ishii 1997, p. 23). That is in addition to the commonality in the occurrence of the extra heavy oils around the world, presenting similar challenges associated with the multiphase flow of oil, water, and gas in a three-phase flow model, which has been proven to be important in the industry. In this case, the study shows that water is introduced along the production and transportation phases to better enhance the transportation process. In addition, the introduction of water in the multiphase flow is to connate water condensation or in other cases the use of water steam injection to enhance the recovery of oil and at the last stages of production (Wilmarth & Ishii 1997, p. 23).
Studies show that the multiphase flow of oil, water, and gas shows strong variations between heavy and low viscosity oils. That has also been an observed case when experimental results have been compared with other experimental models from previous research. With little research done in the area of multiphase flow of heavy oils, it has been shown that the behavior of heavy oils, gas, and water in a multiphase flow model, the significant discrepancies shown between the models call for further experimental research.
Investigations on the flow of heavy oils in both horizontal and vertical pipes show different flow patterns with gas and oil. On the other hand, a combined flow of gas, oil, and water introduces further differences in the flow characteristics, showing a viscosity of 34.95 Pas (Wilmarth & Ishii 1997, p. 23). The presence of oil, water, and gas in horizontal pipes evidently contributes to an increase in the loss of pressure, with the presence of gas having further implications in the loss of pressure in the three-phase flow model. The study implies that the presence of gas in the multiphase flow of the oil, water, and gas has strong implications in pressure reductions during the transportation of oil and gas to offshore storage reservoirs. Studies on the implications of water in the behavioral flow characteristics of oil and gas show that when water is introduced into the stream of oil and gas, a significant reduction in the friction experienced between the fluids and the pipes, reducing the pressure loss due to lubrication. The observations are typical for horizontal and vertical pipes. In this context, the presence of gas is to reduce pressure, while the presence of water is to reduce friction and increase the pressure within the pipe transporting the fluids.
Further research has shown that the flow of gas and oil in vertical piping systems is further influenced by the effects of gravity, which reduces the multiphase flow to a bare minimum of 5% when compared with a single flow (Zhao & Rezkallah 1993, p.34). In a typical experiment where two fluids were used with 0.9 and “1.2 Pa, results showed the superficial velocity of air to increase with a corresponding increase in the total pressure drop” (Zhao and Rezkallah 1993, p.34). In an experimental setup to extract data to compare with other models, tests conducted with high-pressure multiphase flow loop using s system previously used by Zhao and Rezkallah (1993, p.34) consisting of three main system components which were water, oil, and gas, and another three auxiliary systems which included glycol temperature control and data acquisition system, and other air instrumentation, the experiment was conducted with the use of test fluid that included refined mineral oil Lubsoil, ND-50, tap water that is extensively filtered, and natural gas supply. In the setup, the flow of oil and gas was examined based on making observations on the pressure gradient (Xu, Cheng & Zhao 1999, p.3). The pressure gradient was measured based on measurements taken on two different pressure transducers, with the functionality of one pressure transducer used in a single-phase flow oil pipe viscosimeter, aimed at providing data on the viscosity of oil and pressure drop due to longitudinal pipe orientation.
In the setup, it was determined to use a liquid holdup measured on 7.4 m in the longitudinal direction. In this case, the two quick closing pipes were used to provide trap the flowing fluids inside this section to ensure effective measurements on the behavior of the fluids were taken. During the flow process, the water, oil, and gas mixture could be allowed a 5 minute period to separate before raising the pipe to a vertical position, which is gradually drained above the quickly closing pipe (Zhao & Bi 2001, p.34). The pressure of the resulting oil and Water that has been drained and trapped inside the enclosure is measured by taking the resulting pressure readings. In addition, in the experiential setup, observations on the flow patterns were made by examining the behavior of the fluids using an installed camera based on readings from a high-speed video camera and a shutter speed of 1000 frames per second and a maximum shutter speed of 100,000 fps, but having a reduced resolution (Zhao & Bi 2001, p.34). In addition to that, the test matrix consisted of the use of high viscosity oil, water, gas mixtures at superficial speeds ranging between 0.1 and 1 m/s. that was in addition to using a steady pressure of 2.59 MPa and live viscosity oils of 0.15, 0.28, and “0.57 Pas under corresponding temperatures of 37.8 26.7” (Xu 1999, p.3), and 15.60C.
The Patterns of Flow
Images captured with a high-speed camera resulting from the experiment were analyzed. The purpose of the high-speed video camera was to make real-time observations of the three-phase flow patterns of the oil, gas, and water combined, both in the vertical and horizontal directions (Xu 1999, p.3). The evolving flow patterns were based on the classification of the fluids with the flow characteristics done individually for each of the fluids so that each of the combinations of the substances in the study of the gas/liquid flow and the water/oil flow was studied (NtJdler & Mewes, 1995, p.22; Wongwises & Pipathattakul 2006, p.10).
In context, the results of the flow patterns of the oil, water, and gas mixtures showed oil to be dispersed in the slug of the body. Observations made at the bottom of the slug indicated a continuous layer of water, a situation created due to the turbulence of the fluids. In addition, the turbulence level directly influenced the amount of water and the underlying layer that was created. It was further revealed that water and oil were stratified in the film region. Further evidence showed that little or no gas bubbles were trapped in the oil film (NtJdler & Mewes 1995, p.22). A critical analysis of the causes of the flow patterns was due to the low superficial velocity of the gas combined with the low superficial velocity of the oil and water used in the experiment. On the other hand, further results based on an intermittent flow of oil, water, and gas revealed that water could be dispersed within the film and slug body showing a dormant flow pattern, due to the intermittent flow approach used in the experiment. In this case, the study was conducted using a horizontal pipe with a gas velocity of 2 m/s. there is the evident observation that shows that the flow is accompanied by liquid hold-ups which is the direct reason for an increase in the intensity of the turbulence of the flow of the oil, water, and gas in the body of the slug body and the film region. The resulting effect of the increase in turbulence is the disappearance at the bottom of the free water layer which also causes the stratified water layers to change to the oil in water dispersion. One of the factors that influence the observed behavior is the flow rate of the oil droplets, which become distributed across the entire region of the film (Osamasali & Chang 1988, p.34).
Experimental results based on the use of oil and gas further show a flow pattern that is intermittent. In this case, the water dispersion occurs in the oil in the context of the slug and the body of the film used in the experiment. However, some limitations in the water pump; experimental data was limited to examining the flow patterns in the horizontal piping system. In this case, the result showed the presence of a high frictional pressure gradient in the section for taking measurements within the system used to conduct the experiment. Here, changes in the superficial velocity of the oil, gas, and water in the horizontal piping have an effect on the flow pattern of the fluids, causing a change from intermittent to stratified flow. Further results show that if the superficial velocity of the gas is kept at a constant, then the flow pattern of the fluids changes accordingly (Xu 1999, p.45). An increase in the superficial pressure causes changes in the behavioral patterns of the flow of the fluid depending on the pattern developed and the pressure applied. The results further indicate that gas maintains its presence in the liquid film making the pressure fall downwards which is later picked by the upcoming slug. The resulting behavior is an increase of the frictional pressure gradient in the positive direction.
Pressure Gradient
A difference in pressure gradient between vertical and horizontal pipes is based on the influence due to gravity. In this case, horizontal pipes do not experience pressure gradient due to gravity as is possible with vertical pipes, but experience flow pressure gradient due to friction developed between the fluids and the pipe when contact is created. In this case, the flow characteristics are influenced by a negligible pressure gradient (Osamasali & Chang 1988, p.45). That shows the contrast with vertical pipes which experience both the friction and gravitational effects on the flow characteristics of the fluids. In that context, both the vertical and horizontal flow patterns of the fluids show that increase increasing the pressure of the fluids with respect to an increase in the fluid pressure. Additional results show an increase in pressure within the oil’s continuous region satisfying the findings that when water is injected into the flow stream of oil, there is an observed decrease in the pressure gradient (NtJdler & Mewes 1995, p.56).
An analogy of the decrease in the oil pressure is due to the increase in the lubricating effects of the water that forms a narrow film between the oil and the pipe, reducing the friction between the oil and the pipe. In effect, reducing the flow of water into the pipe directly affects the pressure gradient of the oil. Further observations indicate that the presence of injected water affects the pressure gradient of the oil flowing in the pipe with an optimum value beyond which the maximum value of the pressure gradient is attained before it starts decreasing (Rezkallah 1996, p.5). In addition, the amount of water injected into the system does not reduce the pressure of the flowing oil when injected into the contiguous region of the oil. In addition, the relationship between the minimum pressure gradient and its relationship with the superficial velocities is that when the water cut is low, the pressure gradient is at its minimum. The behavioral movement of the pressure gradient seems to be directly correlated with the superficial velocities, with minimum and maximum values of the water directly influencing the flow characteristics of the oil and gas in the multiphase flow environment.
Classification of the three-phase patterns
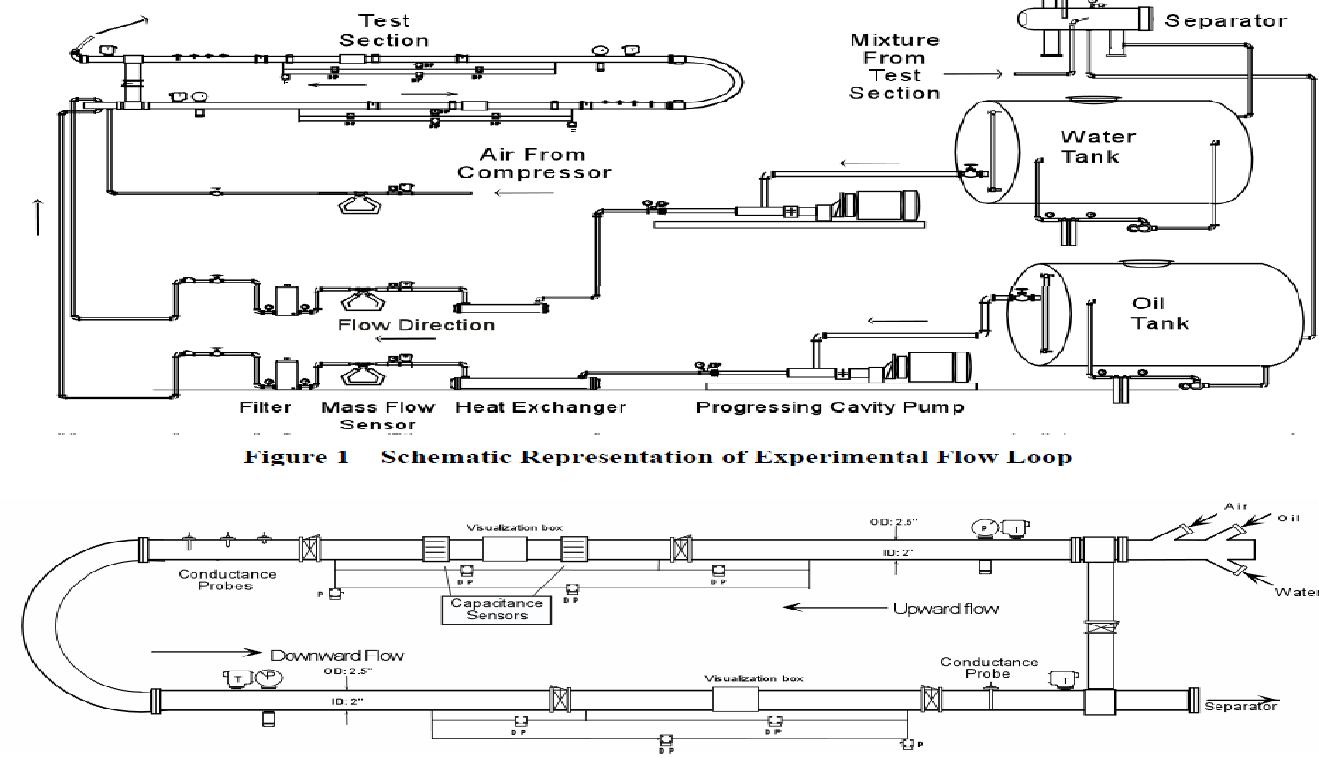
As mentioned in the above discussion, the classification of the flow patterns is critical when designing a system because the multiphase flow is a combination of three fluids flowing through the same pipe at the same time. It is also evident that the flow is characteristics of fluid flow in the oil industry. In addition, transporting the gas-oil-water mixture presents complex problems that solutions have to be searched for based on experimental setups (Wilmarth & Ishii 1994, p.44). In practice, a combination of oil, water, and gas is crucial for classification to improve the flow of fluids from the production to storage reservoirs. Studies show that the classification of oil, water, and gas is into 12 patterns using the setup shown in figure 1 below.
In the study, horizontal pipes were stratified accordingly into stratified smooth (SS), elongated bubble (EB), slug flow (SF), and stratified wavy (SW). Observations were made on the oil-water flow pattern using a horizontal pipe after the stratification process. Conditions were that, when the water and oil in the pipe flowed separately, then it was stratified,
Theoretical Framework
In this theoretical framework, the study undertakes to discuss in detail the underlying theoretical concepts of the fundamentals of multiphase flows of water/oil/gas which consists of more than one component. In this case, the experimental methodology and analytical approaches of addressing the multiphase flow models provide the basis for predicting the behavioral nature of the flow characteristics of the fluids to provide the predictive capability and physical understanding of the subject (NtJdler & Mewes 1995, p.45; Brennen 2005, p. 34). In context, two models are examined to inform the study. These include the two-fluid models and the trajectory model. In context, the study is based on models developed preciously to demonstrate the concept of the flow of fluids either in vertically or horizontally positioned pipes (Wilmarth & Ishii 1994, p.56). It is critical to note that any of the three approaches which include the use of laboratory-sized experimental models, mathematical analysis of the models, or computational models can be used. One of the critical elements that affect the flow patterns of the fluids is turbulence (Osamasali & Chang 1988, p. 34).
Turbulence
Evidence shows that the addition of particles to a fluid in motion as has been shown in the experiments of the injection of water into the flow of oil creates unsteady motion of the particles and leads to a complex non-uniform spatial distribution of the particles injected into the fluid stream and the hosting fluid particles (Brennen 2005, p. 4). That might further lead to particle segregation, particle agglomeration, and fission. Typically, the resulting behavioral characteristics of the particles are evidently different for droplets and bubbles (Brennen 2005, p. 9). In addition, it has been proven that the turbulence of the fluid in motion can be modified by the introduction of particles with different characteristics such as the introduction of water into the flowing stream of slug or oil (Brennen 2005, p. 13). In this case, dampening or improving the turbulence is based on the characteristics of the particles introduced or injected into the flowing stream of oil and gas. In mathematics, turbulence has been defined and presented using Kolmogorov’s length and time scale defined by the equation:
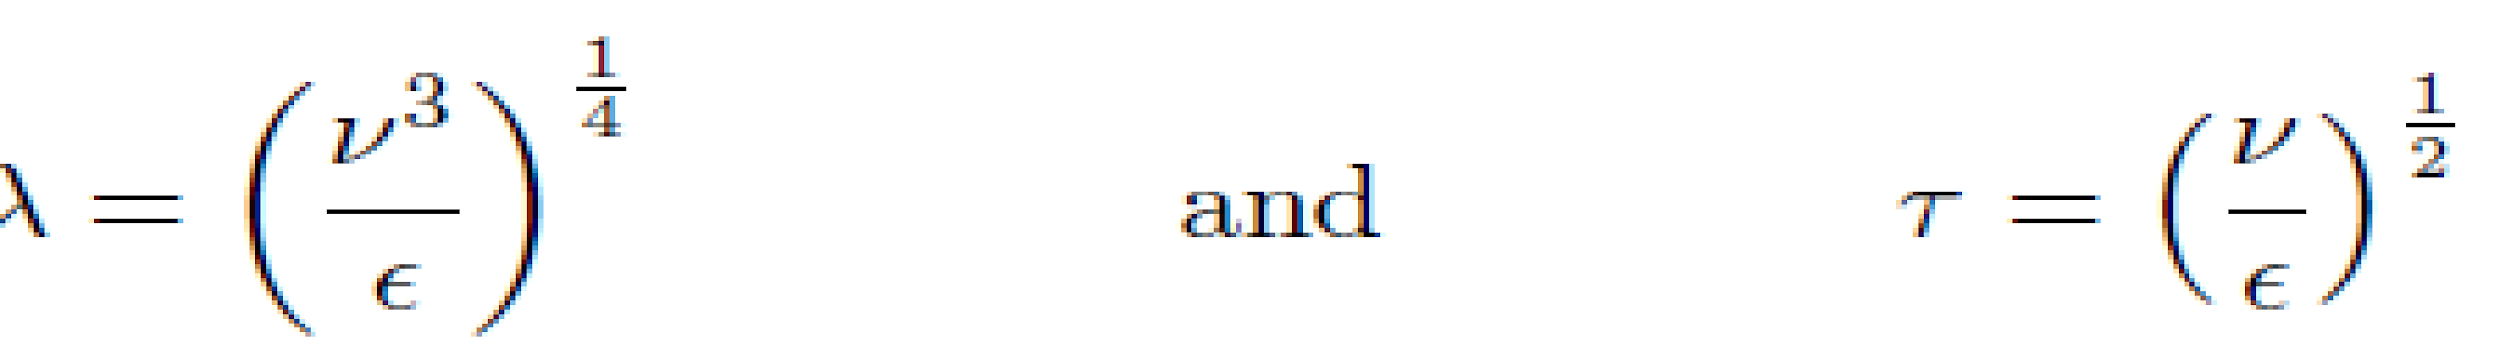
In the above equation, € is the mean rate of dissipation for each unit mass of the fluid while v is the kinematic velocity of the fluid. The relationship between € and U3/l is that of direct proportionality, with u representing the typical velocity of the fluid and l the dimensions of the flow. When both values have been combined, the resulting equations are as follows.
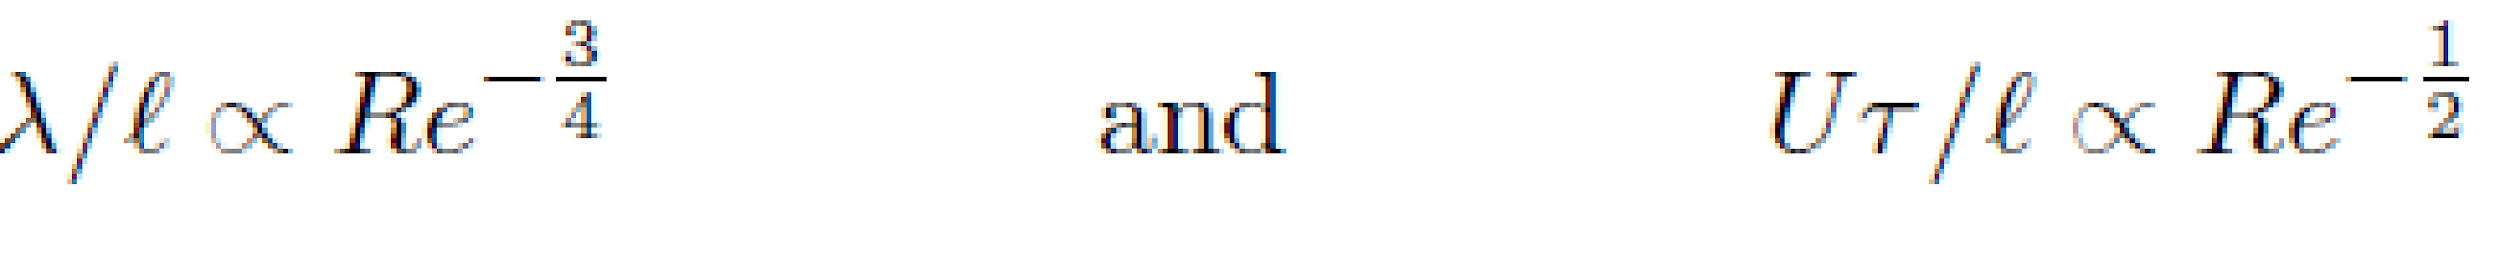
Equation 2
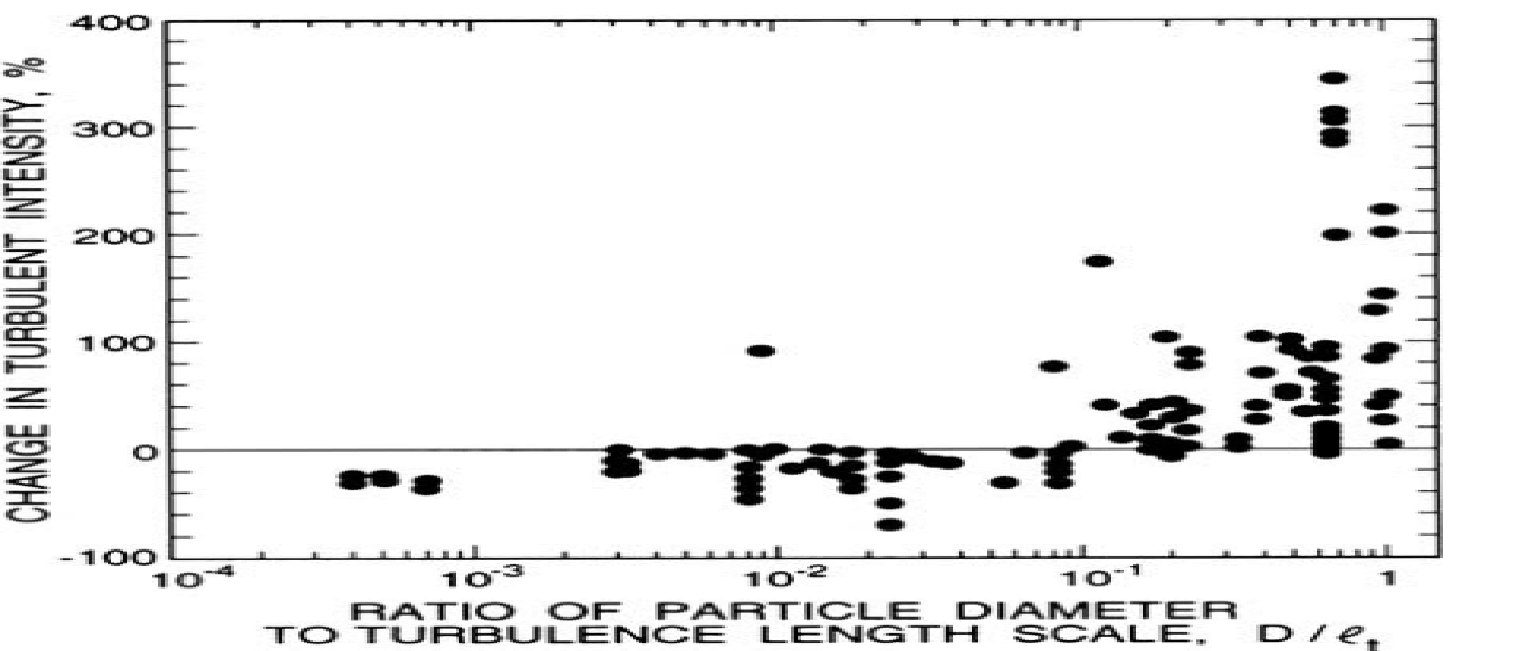
It is important to note at this point the complexity of taking measurements of the fluid flow in addition to the difficulty of resolving the flow. In practice, previous researchers collected data from a wide range of pipes and jets with turbulent flow characteristics, with oil, water, and gas combined, and tabulated the results as shown in the figure below. It is critical to note the behavior in the percentage changes in turbulence with changes in particle size (Wilmarth & Ishii 1997, 23). The turbulence intensity here becomes a function of the turbulence length.
The explanation according to the results noted on the graph is that decreasing the size of the particles in the fluid turbulent length scale in relation to the tends to make them flow in the direction of the turbulent motion of the fluid consequently reducing the turbulence of the fluid because the energy of the particles has been absorbed. The result shows that the turbulence reduction and the ratio of the particles are related as a function of each other in the expression, 1 below.
St = mp/ 6Rμτ
Based on the literature review, where it was discovered that injecting water into the flowing fluid affects the fluid flow before a maximum value is attained, which then reduces to a bare minimum, it is clear from the study that the effect is influenced by the particle size, the pipe orientation, and the St value attained during the flow. In addition, the particle concentration affects the turbulence changes observed with the fluid. In addition, research shows a significant difference and effect of the size of the particle and the kinetic energy of the particles, the rate of viscous dissipation when D/l is small, depends on the mass fraction of the particles. Therefore, the smaller-sized particles follow the turbulence and tend to create a minimum effect on the flow turbulence (Satitchaicharoen & Wongwises 2004, p.34).
On the other hand, the effects of relative motion have a strong implication on the effects of large particles on the flow turbulence of a fluid. That is because large particles have been observed not to follow the direction of the turbulence because they produce a wake which has an overall effect of increasing the turbulence of a fluid in motion. However, further studies on the behavior of gaseous molecules show that they tend to accumulate in the shear zones because they are thrown out of the more intense particles because of centrifugal forces in the strong vortices of a fluid. Unlike gases and other particles, bubbles have been shown to accumulate at the central point of the vortices.
Effect on turbulence stability
A comprehensive understanding of the effects particles have on the transition to turbulence by delaying or promoting the transition comes out distinctly from the above theoretical concept. It has been established from previous studies in theory that when the relaxation time (tu) of a particle is small compared with l/u as shown mathematically above, findings show that the particle can destabilize the flow. When the condition, tu>l/u holds, then the particle stabilizes the flow (Kelessidis & Dukler 1989, p.45). On the other hand, the behavioral characteristics of bubbles are that the effect on the turbulence of a fluid depends on the magnitude of the most unstable frequency in addition to the natural frequency of the fluid. It is possible to have some regions or ranges of instability in the fluid flow due to frequency ranges of the pipe (Kelessidis & Dukler 1989, p.45).
Findings based on the theoretical analysis shows that when the typical time of the fluid motion is associated with the response times of the fluid motion, which includes the natural period of the volume oscillation and the relaxation time are relatively short, the particles have an altering effect on the properties of the fluid they have been injected into. Typically, the overall effect is on the fluid comprehensibility, viscosity, and effective density.
Magnitude of relative motion
The motion of the particles in the fluid borrows form the impact and response of molecules when in contact with relatively moving molecules. It is critical to make qualitative estimates of the magnitude of the relative motion of the particles in multiphase flow to provide evidence of the characteristic behavior of the oil/water/gas particles in a pipe. Suppose there is a general steady flowing fluid with a velocity U and dimension l. Suppose the fluid is flowing in a converging nozzle of length l having a mean axial velocity U, the fluid acceleration is equivalently expressed as U2/l if the flow occurs in time l/u acquiring a velocity of w relative to the fluid in question. It is critical at this time to identify the time required and if it is sufficient to for the particle in question to acquire its terminal velocity. Qualitative estimates indicate that the time required if tu<l/U and Wm/U is:
A quasistatic regime is attained if WR/νC<<1 and WR/νC >>1, but when the condition holds, WR/νc, then it is a transient regime. Various regimes can be analyzed from the schematic diagram shown below.
In the above figure, the relative motion of the particles and the movement of the fluid relative to each other are illustrated in the graph.
According to the diagram, the shaded region has been shown to be a function Y which has a value in the range of 0 < Y < 1.Observations show that the changes in the quasi regimes as one moves deeper into the regions, there is a drastic drop in the magnitude of the relative velocities. In this case, a homogenous flow can only be attained if the X<<Y2 condition is attained (Lahey & Ohkawa 1989, p.45).
Particle concentration
In theory and practice, the concentrations of the particles have an effect on the flow characteristics of the fluid and eventually in the multiphase flow characteristics. If the concentration of the particles in a multiphase flow is low, then the particles have been shown to have minimal effect on the continuous motion of the particles. On the other hand, if the concentration of the particles increases, there is the likelihood of new and complex flow patterns emerging. Here, there is the likelihood of an increase in the number of collisions with other fluids eventually altering the behavior of the flow of the molecules (Mishima & Ishii 1984, p.23).
The theoretical framework is wide and there is a need to conduct further research on the effects particle concentrations have on the behavioral characteristics of the particles of fluid in multiphase flow, the equation of flow of particles, the lubricating effect of water in a multiphase flow, the equations of motion, and film characteristics in a multiphase fluid flow environment.
Methodology
The method used in the design will be based on an experimental setup consisting of oil, water, and the gas used to conduct the study on the three-phase flow. The components in the design setup include:
- The cooling loop
- The main experimental loop
- Data Acquisition system (DAQ)
Description of the New Experimental Apparatus
The new experimental flow system of oil, water, and gas three-phase will consist of:
- The main experimental loop
- The cooling loop
- The DAQ (Data Acquisition System)
The main Experimental loop
The main test loop consists of (Figure -):
- Air compressor.
- 10 m3 coated tank for water (Electric heater, platinum resistance temperature, and stirrer installed in the tank).
- 10 m3 coated tank for oil (Electric heater, platinum resistance temperature, and stirrer installed in the tank).
- Tank as a buffer
- Screw pump.
- Processing cavity pump.
- A small orifice plate flow meter.
- Orifice plate flow meter (Medium).
- A large meter (Orifice plate flow meter)
- Water flow meter
- Gear flow meter
- Test section 1
- Observation glass 1
- Test section 2
- Observation glass 2
- Separator
- High-speed video recording system” Photron fastcam SA2”.
- PC – based data acquisition system “DAQ MASTER MX100 Style S3”.
A number of valves, pressure transducers, platinum resistance temperature, differential pressure transducer, and rotameter were also installed. The main experimental loop consisted of an oil and water supply system and a single air supply system. In order to further separate the oil from water not been separated by the separator, 10 m3 coated tank with internal baffles will be used with 30 minutes minimum residence time for water and oil tank (some dispersions that cannot be separated by the oil, water and gas separator, but the separation can be attained using natural gravitational force in the 10m3 tank for 30 minutes). In order to heat the oil and water to the desired test temperature, the electric heater is installed in both the water and oil tank. The stirrer installed in both the oil and water tanks is used to stir the liquid to maintain a uniform temperature of the liquid.
A pump and compressor are used to circulate the three-phase mixture with specified oil, water, and gas inlet temperature phases and superficial velocities (corresponding to certain average volume void fraction) to the main experimental loop system. These circulators (pumps and compressor) are:
- The air compressor (with a nominal flow rate of 160 m3/h) is used to deliver air to the experimental system. In order to keep the pressure and airflow rate stable, the buffer tank is installed behind the air compressor. In order to avoid the excessive air flow rate and control the air flow rate to the desired test value, the side valve beside the buffer tank is used to ventilate the air into the atmosphere. An orifice plate flow meter placed after the buffer tank measures the air flow rate into the system. To ensure accurate measurements of the rate of flow of air for airflow rates are taken, three calibrated orifice plate flow meters are installed in the experimental loop to take values ranging from the low to the high values. The platinum resistance thermometer is installed after the orifice plate flow meter to monitor and achieve a desired air test temperature.
- The screw pump (nominal power of 4 kW and a rotation velocity of 960 rpm) is used to deliver the water from the 10m3 water tank installed before the screw pump of the experimental system to circulate it back to the water tank after the separation process. The purpose of the bypass is to valve provide a mechanism to avoid excessive pumping of oil and enable the oil flow to be controlled to the desired flow rate. The rate of flow of oil is measured using the gear flow meter. The platinum resistance thermometer is installed after the water flow meter to monitor and achieve a desired air test temperature.
- The progressing cavity pump is used to deliver the oil from the 19 m3 oil tank installed before the pump to the experimental system and to circulate it back to the oil tank after the separation process. The purpose of the bypass valve provides a mechanism to avoid excessive pumping of oil and enable the oil flow to be controlled to the desired flow rate. The rate of flow of oil is measured using the gear flow meter. The platinum resistance thermometer is installed after the gear flow meter to monitor and achieve the desired air test temperature.
- The mixture of water, oil, and air are used by the 11 m mixer to completely mix and produce the uniform oil – water – gas three-phase mixture temperatures to be achieved. The oil-water–gas is thoroughly dispersed in the liquid before the mixture is delivered into the test section where the mixture heat transfer, pressure drop, and flow pattern can be measured in the horizontal test tube and observed through the glass. The desired test mixture ratio can be achieved with the specified gas phase and liquid phase superficial velocities by adjusting the flow rates of oil, water, and gas.
- Inside the test section, the cooling water is injected into the annular channel covering the test tube to exchange heat with the gas–liquid two-phase flow. In order to measure the flow rate of cooling water, a rotameter is installed. The valves are used to control the flow rate to the desired test level. Measurement of the inlet and outlet temperature of cooling water can be achieved by installing the Platinum resistance thermometers on the inlet and outlet of the cooling system. After the test section, a glass tube is installed in order to observe the flow regime. Flow pattern identification is recorded by high-speed camera “Photron fastcam SA2”.
- The mixture then flows into the horizontal condenser coalesced with oil, water, and gas in the three-phase separator (the outer diameter is 0.41 m and has a length of 1.52). The dispersed phase concentration at the outlet is about 30 ppm. Only about half of the total flow rate (0.01m3/s of oil/water mixture) will be handled by the separator. Therefore, additional separation and filters to remove the remaining dispersed phase tracer will be needed. The thermal insulation materials assure that the heat loss is less than 0.5% in all test runs by insulating the whole experimental test system with thermal insulation materials such as foam.
Description of the Test Section
The structure, dimension, and location of the test section (figure -):
- The test section is a smooth circular tube made of API X 52 steel. The inside diameter of the test section is 40 mm and the outside diameter of the test section is 48 mm. A measure of the tube’s relative roughness is 0.001.
- The cooling liquid flow channel and measurement parameters are indicated by:
- T for temperatures
- P for pressure
- DP for pressure drop
- The test section is installed on the experimental rig platform which can be bent to a 90o inclination angle by using Tentsuki type hydraulic system (figure -).
Parameters for measurements
The parameters for measurement in the test s as follows:
- The rate of flow of each of oil, water, and gas.
- The Inlet and outlet temperatures of the mixture.
- The inlet and outlet temperatures and flow rate of the cooling water flowing through the annular channels.
- The pressure used at the outlet test section is measured using a pressure transducer).
- The pressure difference of the transducer provides the readings for pressure drop.
The measurements data is then collected and recorded with the PC – based data acquisition system “DAQ MASTER MX100 Style S3”. The measured results are then stored on the computer disks for further processing.
The fluid for the test
The test fluid used in the experiments consists of distilled water/tap water, diesel oil/mineral oil/petrol oil/kerosene/mixture of mineral oils, air.
The Matrix for the test
The values used in the experiment for oil, water, and gas in the three-phase flow test follow below:
- Superficial velocity of oil = 0.006 to 0.24 m/s
- Superficial velocity of water = 0.002 to 0.66 m/s
- A gas superficial velocity of 0.15 to 50 m/s is used.
Findings
The aim of the study was to design an experimental system for oil /water/gas three-phase flow systems and study several behavioral aspects of the fluid flow in the pipes, to obtain results that could be applied in the oil and gas industry. In this case, the study could be beneficial in the production and transportation of oil and gas from offshore production to onshore storage facilities in the petroleum industry.
The three phase flow, in this case, consists of the flow of water, oil, and gas which is non-uniform and temporary because of the non-uniformity of the properties of the oil, water, and gas in relation to the density, viscosity, and other liquid properties. The observation on the irregular behavior is based on the high-speed video camera integrated into the system to make first-hand observations of the changes in the behavior of the fluids with changing conditions. In addition, because the input water fraction in the experiment was taken as 50%, the water injected into the system always takes a continuous phase, with oil appearing as continuously dispersed. In this experiment, the flow pattern was water-based. Analyses of the findings are illustrated in diagram 7 below.
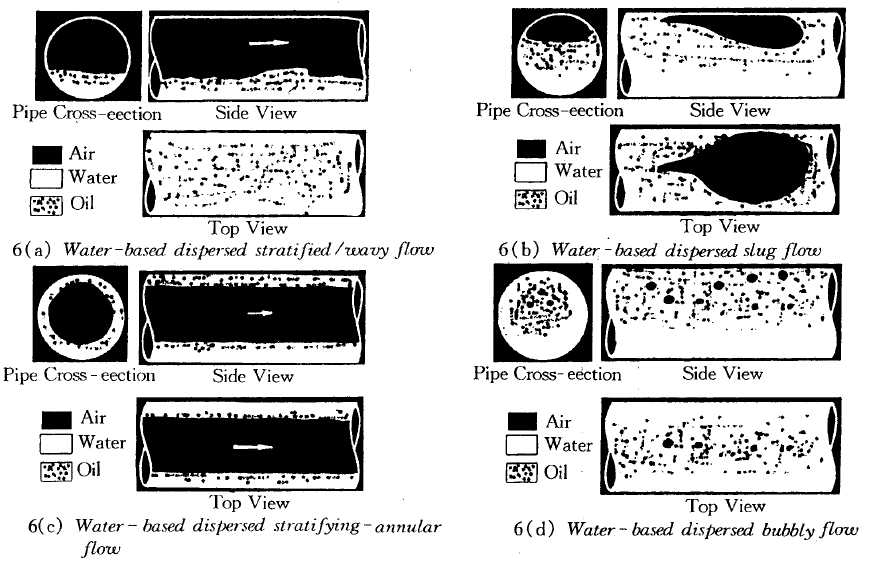
As shown in figure 7 above, the flow pattern observed were classified into:
For dispersed wavy water-based flow, water and gas appear to be completely separated particularly when a helical tube is used in the study. In this case, water rarely wets the upper part of the pipe, with most of the liquid that rises and hits the top section not having any impact on the actual movement of the fluid at all. On the other hand, air bubbles with distinct tails were observed when a water-based slug flow was studied, during the high and low flow rates. In addition, increasing the rate of flow of the fluids, froth could be generated and replace the oil gradually. On the other hand, when the superficial velocity was kept low, for vertically positioned pipes, the role of gravity significantly led to the segregation of the phases. That was in addition to acquiring a drop-free wavy interface. In context, when the mixture velocity is increased in the multiphase flow, there is an increase in the number of droplets, and with the forces barely sufficient to maintain the flow of the droplets, they soon settle letting the flow of oil remain continuous. Larger water droplets appear with a clockwise movement nearer the boundary of the transition line. In addition, the variations in the concentration of oil lead to different modifications of the transition lines. In addition, when the amount of oil flowing in a pipe increases, oil droplets’ coalescence increases, reducing the local turbulence with the surrounding water.
Further findings indicate that when the velocity of the water increases particularly in the water-dominated region, there is an observed increase in the disruption of the oil layer leading to the dispersion of oil in water in the form of a thin film. For the water hold up, there is slippage occurs in the stratified region when the holdup ratio reaches a maximum of about 1.4 before a decrease in the DO/WW is approached.
Conclusion
In conclusion, it is evident that the flow three phase experiments is one of the best approaches of studying the behavior of oil, water, and gas in a three phase flow mechanism that is common in the petroleum industry. The design provides ample evidence of the stratified flow, dispersion of oil in water over a water layer, emulsion of water in oil, stratified with some mixing at the interface segregated, or oil-dominated flow patterns. In this case, water plays a dominant role in the lubrication of the flow reducing consequently the frictional pressure due to the flow of the fluids. The study further confirms that injecting water into the flow of oil is beneficial, especially for horizontal pipes. Further findings indicate the horizontal pressure gradient to reduce when the water cut is attained at 40-50% of the horizontal gas pressure gradient. However, because of the dominant effect of gravitational forces, water injection on the total pressure in vertical pipes is minimal. In addition, for horizontal pipes, the pressure drop is further associated with the flow patterns of the fluid and the gas, further indicating the dependence of the behavior of the fluids on the behavior of the water and the gas in the three-phase flow patterns. However, the flow of oil and water in the experiment and more complex, with changes in the flow patterns always resulting from changes in the amount of water and the combination of the fluid flowing through a pipe at any one given time.
References
Akbar, M K, Plummer, D A S & Ghiaasiaan, M 2003, ‘On gas–liquid twophase flow regimes in micro-channels’, International Journal of Multiphase Flow vol. 29, pp.855–865
Balasubramanian, P & Kandlikar, S G 2003, ‘High speed photographic observation of flow patterns during flow boiling in single rectangular minichannel’, ASME Summer Heat Transfer Conference July 21–23, Las Vegas, Nevada, USA.
Brennen, C E 2005, Fundamentals of Multiphase Flows, Web.
Bonjour, J & Lallemand, M 1998, ‘Flow patterns during boiling in a narrow space between two vertical surfaces’, International Journal of Multiphase Flow vol. 24, pp. 947–960.
Hibiki, T & Mishima, K 2000, Flow regime transition criteria for upward two-phase flow in vertical narrow rectangular channels, Nuclear Engineering and Design, vol. 203 pp. 117–131.
Kelessidis, V C & Dukler, A E 1989, Modeling flow pattern transitions for upward gas–liquid flow in vertical concentric annuli, International Journal of Multiphase Flow vol. 15, pp.173–191.
Lahey, R T & Ohkawa, K 1989, An experimental investigation of phase distribution in an eccentric annulus, International Journal of Multiphase flow vol. 15, pp. 447–457.
Mishima, K & Ishii, M 1984, Flow regime transition criteria for upward twophase flow in vertical tubes, International Journal of Heat and Mass Transfer vol. 27, pp.723–737.
NtJdler, N & Mewes, D 1995, Intermittent Three-Phase Flow of Oil, Water and Gas in Horizontal Pipes, Proceedings of the Fifth (1995) International Offshore and Polar Engineering Conference.The Hague, The Netherlands, June 11-16, 1995.
Osamasali, S I & Chang, J S 1988, Two-phase flow regime transition in a horizontal pipe and annulus flow under gas–liquid two-phase flow, ASME FED vol. 72, pp.63–69.
Premoli, A, Francesco, D & Prina, A 1971, A dimensionless correlation for determining the density of two-phase mixtures, Lo Termotecnica vol. 25, pp. 17–26.
Rezkallah, K S 1996, Weber number based flow pattern maps for liquid–gas flows at microgravity, International Journal of Multiphase Flow vol. 22, pp.1265–1270.
Satitchaicharoen, P & Wongwises, S 2004, Two-phase flow pattern maps for vertical upward gas–liquid flow in mini-gap channels, International Journal of Multiphase Flow vol. 30, pp.225–236.
Wilmarth, T & Ishii, M 1994, Two-phase flow regime in narrow rectangular vertical and horizontal channels, International Journal of Heat and Mass Transfer vol. 37 pp.1749–1758.
Wilmarth, T & Ishii, M 1997, Interfacial area concentration and void fraction of two-phase flow in narrow rectangular vertical channels, Journal of Fluid Engineering vol. 19, pp. 916–922.
Wongwises, S, & Pipathattakul, M 2006, Flow pattern, pressure drop and void fraction of two-phase gas–liquid flow in an inclined narrow annular channel. Experimental Thermal and Fluid Science vol. 30, pp. 345–354.
Xu, J 1999, Experimental study on gas–liquid two-phase flow regimes in rectangular channels with mini gaps, International Journal of Heat and Fluid Flow vol. 20, pp, 422–428.
Xu, J, Cheng, P & Zhao, T S 1999, Gas–liquid two-phase flow regimes in rectangular channels with mini/micro gaps, International Journal of Multiphase Flow vol. 25, pp.411–432.
Zhao,TS & Bi, Q C 2001, Co-current air–water two-phase flow patterns in vertical triangular micro-channels, International Journal of Multiphase Flow vol. 27, pp. 765–782.
Zhao, L, & Rezkallah, K S 1993, Gas–liquid flow patterns at microgravity condition, International Journal Multiphase Flow vol. 19, 751–763.