Introduction
This chapter intends to describe the methodology selected for conducting the study. The chapter clarifies what paradigm, research design, and methodological approach are chosen by the researcher. The description of the selected population, sample size, and the used instrumentation are also provided in the chapter. The aspects of the data collection and methods applied for the data analysis are discussed in detail. Thus, the chapter presents a clear justification of the chosen methods and approaches with the focus on their effectiveness to achieve the research purposes and answer the research questions, as well as to test the set hypotheses. Much attention is paid to the issues of the methods’ reliability and validity to guarantee the appropriateness and accuracy of the selected methodology. The chapter is concluded with a discussion of ethical considerations and the issue of confidentiality.
Research Philosophy
Research philosophy can be discussed as the lenses with the help of which researchers use their reasoning, develop the investigation of phenomena, and analyze the relationships. As a result of using specific lenses or paradigms as grounds for making certain assumptions, a researcher can gain knowledge regarding the concrete problem (Krauss 2005; Saunders, Lewis & Thornhill 2009). From this point, a paradigm is a perspective or a framework that is used by a researcher to receive the certain knowledge, and this perspective reflects a researcher’s visions and beliefs regarding the real world and relationships in it (Neuman 2013). In his work, a researcher can adopt different paradigms that are consistent with the stated research questions and expected findings, and that can influence the practical discussion of the problem (Saunders et al. 2009; Sreejesh,
Mohapatra & Anusree 2014). Thus, researchers determine such main paradigms as positivism, interpretivism, and pragmatism (Neuman 2013). These paradigms are important to determine what data collection tools and data analysis approaches will be selected for the study.
Positivist Paradigm
Positivism is a philosophy that emphasises the significance of the objective data received with the help of the scientific research. The main premises made by positivists are that the reality should be studied through discoveries and objective conclusions regarding the nature of the observed phenomena (Krauss 2005; Wahyuni 2012). The main focus is on examining the actual properties and attributes that phenomena have, as well as on the identification of relationships between these phenomena. The positivist paradigm is important when it is necessary to test hypotheses and refer to the statistical analysis of the data related to the social and business processes (Gill & Johnson 2010; Krauss 2005; Saunders et al. 2009). From this perspective, positivists choose to transform the data received with the help of surveys into the objective findings while applying different theories (Neuman 2013; Shepherd & Challenger 2013; Sreejesh et al. 2014). The positivist philosophy allows for providing the justification for the assumptions and hypotheses made by researchers during the process of examining the reality. As a result, choosing this paradigm, the researcher uses the possibility to make generalisations with references to the study results.
Interpretivist Paradigm
Interpretivism is a paradigm that is based on collecting and evaluating the individuals’ beliefs, visions, and ideas. In contrast to positivism, the focus is on the subjective interpretation of the collected data (Morgan 2007; Saunders et al. 2009). Thus, the data and findings are usually seen through the perspective of the social relations, and individuals’ perceptions play the more important role in forming the social construct than the analysis of the objective reality (Wahyuni 2012). The interpretivist paradigm is characterised by the necessity of interacting with the participants of the study (Sreejesh et al. 2014; Wahyuni 2012, p. 71). This paradigm is actively used for qualitative and phenomenological studies when it is necessary to communicate with participants, observe them, and focus on their visions, opinions, and ideas.
This philosophy is based on the idea that products of the humans’ thought and vision can be interpreted. The focus is on the subjective data and recollections of persons’ experiences that are important in order to find connections between certain phenomena (Saunders et al. 2009). In this case, much attention is paid not only to individuals’ interpretations of the world around them but also to the researchers’ interpretations of the collected data (Krauss 2005). It is important to note that these data are often used in order to formulate the theory based on the findings. This approach is typical of the inductive reasoning (Saunders et al. 2009; Shepherd & Challenger 2013). This paradigm is actively used when researchers need to represent the actual visions and ideas of participants, and the subjective interpretation plays the critical role to address the research objectives.
Pragmatist Paradigm
When researchers need to apply the approaches typical of both quantitative and qualitative methods, they are inclined to use a pragmatist paradigm. According to researchers, the combination of two philosophies allows for the development of the new improved approach (Krauss 2005; Neuman 2013). There are many situations when the application of only qualitative or only quantitative strategies cannot lead to the expected results. In this case, researchers choose to justify their predictions and test hypotheses with the focus on the combined paradigm (Gill & Johnson 2010; Sreejesh et al. 2014). The users of the pragmatic paradigm agree that the use of more than one paradigm and associated methods allows for testing the analysis in terms of its accuracy and relevance (Wahyuni 2012, p. 71). Furthermore, the supporters of this philosophy are also inclined to concentrate on one approach that is regarded as most appropriate in the concrete case (Walliman 2010). From this point, the appropriateness is the main factor to choose the methodology according to the pragmatic philosophy.
Paradigm Applied to the Study
The choice of the paradigm is important to determine what methods will be used in the study in order to test hypotheses and provide the answers to the research questions. In spite of the fact that both paradigms are characterised by certain strengths and weaknesses, for this study, positivism is selected because it allows for examining the objective data with references to the statistical analysis in order to receive the most accurate findings. In addition, the positivist paradigm is often used in order to provide the background for studying the relationships between factors and variables, and it is based on the application of quantitative methods (Krauss 2005; Sreejesh et al. 2014). The positivist paradigm can be effectively applied to the analysis of the numerical data that reflect the participants’ perceptions, attitudes, and behaviours. Therefore, in order to analyse the objective data, it is reasonable to use the positivist philosophy that is easily correlated with the quantitative method and statistical analysis (Shepherd & Challenger 2013).
A researcher refers to the positivist paradigm when it is necessary to find the predicted relationships between variables and explain them with references to the numerical data (Saunders et al. 2009). In this case, it is possible to avoid the subjectivity and focus on accurate findings received as results of the specific tests. The interpretivist paradigm cannot be used in this study because of the specifics of gathered data and the necessity of conducting the statistical analysis (Krauss 2005). Thus, for the current study, the interpretivist paradigm is discussed as not appropriate because it does not involve using the numerical data (Gill & Johnson 2010). Instead, the philosophy is relevant to be used for the qualitative research when it is necessary to focus on interviews and field studies.
Research Design
A research design is a focus that is selected by the researcher in order to make his or her study reliable and appropriate to answer the set research question. Researchers pay much attention to selecting the design because it explains the approaches chosen for the problem investigation (Saunders et al. 2009). It is possible to identify such research designs as exploratory, descriptive, and causal designs that should be discussed in detail with the focus on the approach applied in this study.
Exploratory Research
The exploratory research design is used by researchers when they aim at examining the problem or issue that was not investigated previously. This design is utilised to cover gaps in the existing knowledge. According to Saunders et al. (2009, p. 139), this research is “particularly useful if you wish to clarify your understanding of a problem, such as if you are unsure of the precise nature of the problem.” Researchers are interested in formulating the problem, and they explore the context related to the area that requires the further research (Neuman 2013). In order to clarify some concepts, researchers start with conducting the literature review and selecting the participants who can add to their knowledge regarding the problem or idea. It is important to note that this design allows for exploring the issue without influencing the research process with the bias that can be caused by possible assumptions (Gill & Johnson 2010; Sreejesh et al. 2014). The focus on this design is relevant when a researcher intends to explore the problem in detail and reveal the aspects that were not previously discussed in the literature. Therefore, the exploratory research design is usually associated with the qualitative methodology and such approaches to collecting the data as focus groups and interviews.
Descriptive Research
A descriptive research design is used when it is necessary to describe and analyse the features or aspects of the certain phenomenon, relationship, or individual. In order to describe a phenomenon or a specific problem, it is necessary to collect the data regarding the aspects or details of this phenomenon. This research design allows for gathering the objective data without changing their nature (Sreejesh et al. 2014). As a result, it is possible to concentrate on the collection of the accurate and representative information. Saunders et al. (2009, p. 140) state that the descriptive research is often perceived as “an extension of, or a forerunner to, a piece of exploratory research or, more often, a piece of explanatory research” because the further evaluation of the described data is often required. The descriptive research design can be used for depicting characteristics of participants, as well as relationships between variables, without providing the causes of developing such relationships (Gill & Johnson 2010; Neuman 2013). From this point, a descriptive research aims at describing the existing relationships between variables without changing conditions.
Causal Research
A causal research design is also known as an explanatory one because the main aim of this research is to explain how certain variables can influence the other ones. A researcher’s purpose in this case is to test a theory with the focus on the causal relationships between variables (Neuman 2013). In this context, a researcher can choose to test not only one relationship but also a variety of causal relationships in the study (Saunders et al. 2009). The aspects that are explored during the research are the direction of relationships, their positive or negative character, and their intensity in terms of significant or non-significant effects of one variable on others. From this point, the main focus is also on measuring variables or constructs and their aspects in order to conclude about the relevance of stated hypotheses and projected relationships (Neuman 2013; Sreejesh et al. 2014). The casual research is also based on the use of the probability sampling in order to find the support for hypotheses and generalise the received results (Saunders et al. 2009). The reference to the quantitative data and statistical analysis allows for receiving the answer to the nature and causes of the relationship between the stated variables (Gill & Johnson 2010). In this case, concrete variables and relationships are stated and predicted by investigators, and they work on developing the hypothesis that can be appropriate to explain the studied problem.
Research Design Utilised in the Study
In the context of this study, the exploratory research is not suitable because it is based on the interpretive philosophy, and the use of qualitative methods is expected. In its turn, the causal research design is usually based on conducting experiments that are not planned for this study (Saunders et al. 2009). The purpose of this study is to find the relationships between variables and address the hypotheses. Therefore, for this study, the descriptive research design is used because it is correlated with the positivist philosophy, and it is appropriate to utilise the quantitative methods, such as questionnaires and statistical analysis (Gill & Johnson 2010; Neuman 2013). The descriptive research allows for describing the participants or certain phenomena with the help of analysing the objective and numerical data (Saunders et al. 2009). This design is suitable to answer the research questions and provide an investigator with more information regarding the topic in terms of supporting the assumptions with the statistical data (Sreejesh et al. 2014). In order to understand how HRM practices (independent variables) can influence employees’ behaviours and the retention problem (the dependent variable), it is appropriate to focus on this type of research. In spite of the fact that it is possible to suggest that the current study is causal in its nature, the tools available with references to the causal design are not enough to explain the relationship between variables in detail, with the focus on causes.
Research Approaches
Researchers are inclined to focus on such two types of research approaches as deductive and inductive approaches that are usually correlated with different types of philosophies (Neuman 2013). Positivists usually choose the deductive approach, and they also focus on the quantitative methodology. On the contrary, interpretivists usually choose the inductive approach and the qualitative methodology (Walliman 2010). In their turn, pragmatists can use the mixed methods approach and focus on both deductive and inductive approaches. Therefore, it is important to determine the difference between these two approaches.
Deductive Approach
The deductive approach means that a researcher is interested in testing the existing hypotheses and theories on which they are based. As a result, the development of the research and argument follows such steps as the focus on the theory, the formulation of hypotheses, the process of collecting the data and testing the hypotheses, and the formulation of the conclusion that is based on the collected data and other associated findings (Walliman 2010). In this context, the deductive approach is used in order to support the certain theory of the researcher (Gill & Johnson 2010; Neuman 2013). Moreover, the deductive approach is also used in order to examine the relationship between certain variables (Sreejesh et al. 2014). The possibility of basing the research on a certain theory and assumptions allows for using it in social and business studies where it is necessary to demonstrate how the certain theory explains specific relationships that are usually predicted with references to assumptions or hypotheses (Saunders et al. 2009). Researchers choose the deductive approach when it is necessary to test the existence of the relationship between variables. For this purpose, the researcher needs to collect the data and examine them with the help of statistical or other types of analysis (Sreejesh et al. 2014). Therefore, the quantitative methodology is most appropriate for positivists who refer to the deductive approach while investigating a phenomenon or a problem (Gill & Johnson 2010). It is important to state that the reference to the deductive reasoning allows for the focus on objective data, and it is also possible to make the general conclusions regarding the phenomenon or relationships.
Inductive Approach
The inductive approach means applying the method of reasoning and testing the information that is opposite to the deductive one. While selecting the inductive approach for the research, an investigator is focused on participants’ ideas, visions, opinions, beliefs, and experiences that are collected with the help of interviews, focus groups, and other phenomenological methods (Neuman 2013). In this case, an investigator develops the theory referring to the data that were collected (Walliman 2010). Therefore, the process of working on the research has the following stages: the formulation of hypotheses or research questions, the collection of the data with the focus on the participants’ experiences and visions, the analysis of the data, and the formulation of the theory with the focus on the collected data (Gill & Johnson 2010). When researchers use the inductive approach, they formulate certain theories while referring to the information they can see, hear, or observe while working with participants. In this case, they interpret the data (Sreejesh et al. 2014). Therefore, the process of creating new theories related to the collected data is associated with the interpretivist paradigm, inductive approach, and the choice of the qualitative methodology.
Approach Referred to in the Study
In this study, the use of the positivist paradigm with the focus on the descriptive research explains the choice of the deductive approach in order to plan the study and build the argument (Gill & Johnson 2010). The focus of this study is on testing the relationship between variables while taking theories that can explain the possible relationship into account. The discussion of the theories that are used in management in order to explain the relationship between managerial practices and employees’ attitudes and behaviours led to formulating specific questions and hypotheses for this research (Saunders et al. 2009). This approach can be discussed as deductive, and it allows for focusing on collecting the appropriate data and testing it with the help of quantitative methods. In this case, it is possible to test the hypotheses and find accurate answers to the stated research questions that are supported by actual numbers (Neuman 2013; Sreejesh et al. 2014). For this study, the choice of the deductive approach is reasonable because it is necessary to examine the relationship between independent and dependent variables and to find how this relationship is supported by the theories existing and developing in the field of human resource management.
It is also important to pay attention to the fact that the study applies the deductive approach because it is effective to be used for the purpose of finding answers to the stated research questions and hypotheses that are formulated within the certain conceptual framework (Neuman 2013). The deductive reasoning is important in order to make general conclusions with references to the collected data (Saunders et al. 2009). In this study, it is significant to find whether it is possible to generalise the relationship between HRM practices and the further employees’ behaviours. Therefore, the deductive approach is most effective to be used in order to address the objectives of this study. This descriptive research is based on the positivist philosophy, and the choice of the deductive approach seems to be reasonable in order to meet the research aims.
Research Method
The choice of the philosophy, research design, and research approach leads to selecting the methodology that is correlated with the chosen characteristics of the study. Researchers usually choose between qualitative methodology and quantitative methodology.
Qualitative Methodology
The qualitative methodology is used when it is necessary to formulate the theory with references to the results of the study. According to Creswell (2009, p. 4), qualitative methodology is applied by researchers for “exploring and understanding the meaning individuals or groups ascribe to a social or human problem.” In this case, the qualitative methods, such as interviews, phenomenology, focus groups, and ethnography, are mainly utilised by researchers who are focused on the interpretivist paradigm and who plan to use the inductive reasoning in their study (Gill & Johnson 2010; Saunders et al. 2009). A researcher receives an opportunity to learn directly from respondents while focusing on details that are extremely important to them and require the further investigation.
Such qualitative methods as interviews and focus groups are usually face-to-face, and the results can be discussed as subjective in their nature because they depend on the researchers’ interpretation. Still, such data allow for the in-depth understanding of the participants’ ideas and thoughts (Sreejesh et al. 2014). Interviews that are used for such research can be non-structured, semi-structured, and structured in order to provide the researcher with an opportunity to collect the required data easily (Neuman 2013; Saunders et al. 2009). Researchers also prefer to contact participants in their natural settings in order to have an opportunity to observe behaviours in a situation that is familiar to an individual (Creswell 2009; Saunders et al. 2009). However, for this study, the qualitative methodology is not appropriate since it is not effective to cover the large sample and provide the findings that can be generalised in order to support the certain hypothesis or theory (Gill & Johnson 2010). Still, for some types of research, the qualitative methodology can be regarded as the best choice because it allows for the detailed discussion of the phenomenon. Qualitative methods are used for the complex observation that is not available in quantitative studies.
In this context, the qualitative methods are usually viewed as time-consuming, and they require the researcher’s focus on discussing only one detail or aspect of the problem or a case. Thus, it is important to note that case studies are also typical methods that are used for qualitative researches (Buchanan & Bryman 2007; Sreejesh et al. 2014). Nevertheless, it is also necessary to note that many researchers prefer to combine the quantitative and qualitative methods in their studies in order to use the advantages of both approaches (Bryman 2006). In this case, the human behaviour is studied in detail, and the findings that are represented in the form of narratives are often used to support the general numerical results related to the study.
Quantitative Methodology
The quantitative methodology is characterised by collecting the numerical data in order to prove the stated hypotheses. Therefore, according to Walliman (2010, p. 72), the quantitative methodology is based on the analysis of the quantitative data that “can be measured, more or less accurately because it contains some form of magnitude, usually expressed in numbers.” The quantitative methods are applied by researchers in cases when it is important to understand and discuss the relationship between identified variables (Will, Bertrand & Fransoo 2002). The main purpose of the quantitative methodology is to describe the phenomena or participants and test hypotheses with references to the collected data. Therefore, this method is used in the descriptive and causal research. From this point, quantitative methods are used when it is necessary to establish the existence of relationships and describe them (descriptive research) and when it is necessary to explain the causes of these relationships (causal research) (Bryman 2006; Gill & Johnson 2010). When causes of relationships are planned to be determined by researchers, experiments are used in order to use a treatment in relation to participants and study changes in reactions (Neuman 2013; Will et al. 2002). Therefore, the quantitative methodology is used when concrete answers to research questions are required.
Furthermore, it is also important to note that the quantitative methodology has its origins in the deductive reasoning when theories are tested with the help of formulating hypotheses and analysing the data. Researchers collect the information about participants and phenomena with the help of structured instruments that are relevant to present the numerical data (Saunders et al. 2009). The structured instruments are effective when the large group of subjects is involved in the study (Bryman 2006; Sreejesh et al. 2014). In order to analyse the gathered numerical data, it is relevant to use the statistical analysis tools that are most appropriate to investigate the large set of numbers that are usually gathered by researchers during the study process.
It is possible to state that researchers choose the quantitative methodology and strategies in order to have an opportunity to generalise the received results. In this case, the results of the study can be applied to the large population because the conclusions are based on the accurate analysis of numbers and objective data. Other investigators can repeat the study while using the same instruments (Bryman 2006; Neuman 2013; Saunders et al. 2009). From this point, the use of quantitative methodology allows for conducting studies the results of which can be interpreted to determine certain trends, relationships, and generalisations.
Justification for Using Quantitative Methodology
The quantitative methodology is used in this research because it is appropriate to support the deductive reasoning while testing the theory and hypotheses. In addition, the use of quantitative methods is associated with the analysis of the numerical data. The objective results received after the analysis of the data allow for making generalisations regarding the hypotheses and explored relationships. From this point, the quantitative methodology is directly related to the principles of positivist philosophy and descriptive research (Creswell 2009; Saunders et al. 2009). In their studies on the relationship between HRM practices and employees’ reactions and behaviours, the majority of researchers applied the quantitative methodology. Thus, this method is used by Dhiman and Mohanty (2010), Bulut and Culha (2010), Yamamoto (2013) and Kashyap and Rangnekar (2014). The use of the quantitative methodology allows for exploring the social and business phenomena with references to the objective analysis of facts and features. In addition, quantitative studies are characterised by the high level of reliability (Saunders et al. 2009).
The quantitative study is important when a researcher plans to find the answers to questions regarding the relationship between variables. The reason is that the statistical analysis tools are actively used in order to find the relationship between constructs, and it is almost impossible to conclude about the nature of these correlations without references to the statistics (Gill & Johnson 2010; Neuman 2013). Therefore, while focusing on examining the relationship between variables, a researcher plan to collect the numerical data and use specific tools for the data analysis (Bryman 2006; Sreejesh et al. 2014). In this study, it is important to collect the data regarding the employees’ perceptions and visions of the HRM practices applied in public and semi-private organisations. The goal is to find the possible relationship between the nature of HRM practices and the employees’ perceptions, attitudes, and behaviours leading to the retention or turnover. However, in order to make general conclusions regarding the relationship, it is necessary to ensure that the collected data are objective. The transformation of the subjective data into the objective data means representing the perceptions and attitudes of employees with the help of numbers (Neuman 2013). These numerical data can be analysed with the help of quantitative methods.
Quantitative Methodology Strategies
The strategies that are used in the context of the quantitative methodology in order to collect the information are appropriate to gather the numerical data and address the large sample size. In this research, the focus is on the cross-sectional study that is used in contrast to the longitudinal study in order to observe and work with participants during a set period of time (Neuman 2013). The cross-sectional study is actively used in the field of social studies, economics, business, and management (Saunders et al. 2009). Thus, the cross-sectional quantitative study is selected by researchers in order to investigate the phenomenon related to the concrete time point (Gill & Johnson 2010). This variant of the quantitative study should also be applied to this research because the focus is on examining employees’ perceptions regarding the HRM practices and possible turnover intentions after the HRM practices were implemented in organisations. However, it is also important to note that the cross-sectional quantitative study can be performed with the focus on several different strategies or methods that are mostly experiments and surveys.
Experiments
Experiments are often used when it is necessary to test the certain theory and hypothesis. The important part of the experiment is the comparison of results related to the treatment and control groups in order to support or disprove the hypothesis (Neuman 2013; Saunders et al. 2009). The empirical research is based on the idea that certain changes will be observed in relation to the experimental group when the study is completed (Sreejesh et al. 2014; Walliman 2010). Researchers use this method in order to determine how certain independent variables or interventions can influence the dependent variables or participants. This method is applied in natural sciences and psychology among other fields (Saunders et al. 2009).
However, this quantitative strategy of developing the study is not appropriate for the research in the field of management or economics. It is possible to distinguish between true experiments and quasi-experiments that are not based on the random assignment of the population to the study (Creswell 2009; Walliman 2010). Researchers can be discussed as conducting true experiments when they divide the population into the control and treatment groups, and the treatment group is influenced in order to observe possible changes in the persons’ behaviors, as it is typical of the social and management research (Saunders et al. 2009). Quasi-experiments are also based on the idea of influencing participants in order to stimulate or provoke the expected changes, but in this case, the dependence on the control group is minimal, and the assignment to the treatment group is not random.
Surveys
Surveys are used in order to collect the data that cannot be received with the help of observations or experiments. Surveys provide “a quantitative or numeric description of trends, attitudes, or opinions of a population by studying a sample of that population” (Creswell 2009, p. 12). This strategy allows for the collection of large amount of data that are presented in the standard and usually numerical form. Surveys are often used in the research in a form of a questionnaire that is necessary in order to obtain the data regarding the participants’ thoughts and perceptions and represent this information in numbers (Saunders et al. 2009). In this context, the survey based on the questionnaire contributes to acquiring the data that can be analysed with the help of statistical tools (Sreejesh et al. 2014). For the current research, the use of a survey is a reasonable strategy because the study applies the deductive approach.
As a result, in order to test hypotheses, it is necessary to collect the data regarding the participants’ views on HRM practices and their turnover intentions, but this information should be presented in the form of numbers. In this context, the use of the survey is the most appropriate approach (Saunders et al. 2009). The use of surveys allows for addressing the large population during the certain time period (Scandura & Williams 2000). Surveys based on questionnaires often include the information indicating the time that is necessary in order to fill in the survey form. Online surveys are actively used today because, in contrast to traditional questionnaire-based surveys, these online forms are appropriate to be filled in by a large number of persons simultaneously, and results can become available to the researcher after the survey is completed (Gill & Johnson 2010; Neuman 2013). Currently, many researchers use electronic versions of questionnaires in order to distribute them with the help of e-mail (Saunders et al. 2009). These surveys combine the advantages of traditional hard copies of surveys and online surveys because the time necessary for re-sending the questionnaire is saved, and a participant can send a questionnaire to the researcher at any time.
Population and Sample
In order to collect the accurate data for the quantitative study, it is necessary to determine the population and guarantee that the selected sample is representative in terms of involving employees from both public and semi-private sectors of Qatar. Much attention should be paid to selecting the population for the study with the focus on the appropriate sampling technique, as well as on the pre-determined sample size.
Sampling Population
The focus of the study is on the population working in public and semi-private organisations that operate in the State of Qatar. In order to address the objectives of the research, three organisations are selected from the public sector, and four organisations are selected from the semi-private sector. The populations from the following three public organisations were invited to participate in the study: the Ministry of Finance, the Ministry of Environment, and the Ministry of Administrative Development Labour and Social Affairs. The Ministry of Finance was established in 1960. Currently, the ministry employs more than 3500 employees (Ministry of Finance 2016). The Ministry of Environment was established in 2008, and the regular number of employees includes about 2500 persons (Ministry of Environment 2015). The Ministry of Administrative Development Labour and Social Affairs was established in order to support the law authorities in terms of determining the labour regulations for nationals and migrant workers in Qatar. The number of employees in the ministry is about 800 persons (Ministry of Administrative Development Labour and Social Affairs 2016).
In order to examine tendencies in the semi-private sector organisations and compare the results with the public sector organisations, it was necessary to focus on such industries as the petrochemical industry, the gas industry, the sphere of education and social affairs, and the sphere of real estate and general investments. Qatar Chemical Company Ltd (Q-Chem) represents the petrochemical industry that is actively supported by the Qatar’s Government. The organisation is large, and more than 3500 employees work in the organisation’s facilities (Qatar Chemical Company Ltd 2016). The gas industry is represented by RasGas Qatar Company that was established in 2001. The organisation became one of the leading producers of the liquefied natural gas in the region, and the staff is represented by more than 1200 employees (RasGas 2013). The employees of Qatar Foundation were also invited to participate in the study. Qatar Foundation specialises in developing educational initiatives and operates in the field of social affairs (Qatar Foundation 2016). Barwa Company is the leading real estate company in Qatar; therefore, its employees were also invited to join the study (Barwa Company 2016).
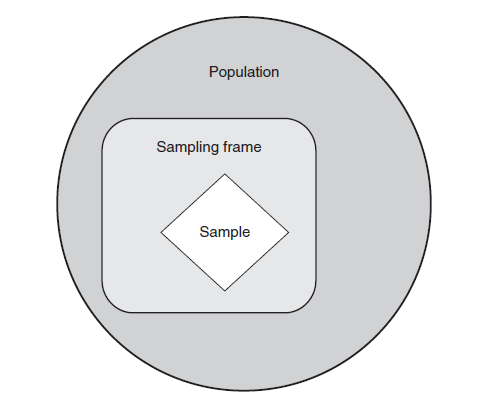
The main goal of selecting a sample for the study is to guarantee its representativeness in order to generalise the received results and support the theory or tested hypotheses. The sampling technique can be discussed from the point of a sampling frame within which participants can be involved in the study as a sample. Thus, a sampling frame determines what sample should be selected from the population (Figure 1). It is possible to determine two main types of sampling that are the probability or random sampling and non-probability sampling (Saunders et al. 2009). The main difference is that probability sampling is used when it is necessary to guarantee that any respondent, phenomenon, or event can be equally involved in the study (Gill & Johnson 2010; Sreejesh et al. 2014; Walliman 2010). In spite of the fact that random sampling is used with the target population, all persons have equal chances to be involved in the study.
Probability sampling methods are often used by researchers in quantitative studies because they want to guarantee the accuracy of unbiased results that can be generalised for the larger population (Neuman 2013). In this case, the selection of respondents is realised with the help of tables of random numbers or software to choose random figures (Saunders et al. 2009; Walliman 2010). Depending on the purpose of the study, the probability sampling can be not only random but also systematic, stratified, and cluster, and these types differ in terms of parameters selected by the researcher for his or her study.
Non-probability sampling is an approach to selecting respondents when the random choice is changed with the selection of participants according to the purposive, snowball, opportunity or convenience, and the experts’ judgment sampling techniques (Walliman 2010). The purposive sampling is selected when the researcher is focused on the concrete purpose for the study, and he or she is concentrated on addressing the certain number of respondents having the expected characteristics (Bell & Bryman 2007; Gill & Johnson 2010). Therefore, the choice of participants begins with identifying the qualities of the population and characteristics of the targeted groups. In this study, there are two main groups, including the employees working in public and semi-private organisations in Qatar. The next step is the identification of the number of respondents who need to be addressed in order to collect the data and respond to the research questions.
The snowball sampling is a method that is used when a researcher aims to research a large number of respondents through the system of referrals. The target group of respondents, who have certain qualities or experiences determined by the researcher, is asked to inform other persons who have the same qualities about the possibility to participate in the study (Neuman 2013; Saunders et al. 2009). This sampling technique is often used in the qualitative studies based on the phenomenology and focus groups. While applying the opportunity sampling technique, a researcher chooses to target the participants who are available or can be reached easily. Volunteers often take part in such studies (Gill & Johnson 2010; Sreejesh et al. 2014). In the experts’ judgment sampling, the choice of respondents depends on the experts’ evaluations, and they conclude whether the proposed sample is representative and addresses the goals of the research (Neuman 2013; Walliman 2010).
For this study, the non-probability purposive sampling technique is more appropriate than the probability sampling in spite of the fact that non-probability methods are used in quantitative studies more often. The reason is in the fact that non-probability purposive sampling allows for concentrating on respondents from the particular organisations, and this approach is comparably less expensive than the probability sampling (Gill & Johnson 2010; Neuman 2013). Furthermore, the purposive sampling does not mean that the representativeness of the sample becomes lower. In this study, the goal of the research is to investigate the perceptions and behaviours of employees from public and semi-private organisations in Qatar. The setting determines difficulties with contacting employees working in public and semi-private organisations who would agree to participate in the study. Therefore, it is necessary to contact managers and seek the permission before starting the research.
As a result, when it is necessary to target the concrete sample, the non-probability purposive sampling technique is an appropriate choice that can guarantee the work with the selected group of persons (Saunders et al. 2009). In addition, the selection of the purposive sampling is based on the fact that a researcher has an opportunity to determine an actual number of participants who are expected to represent the chosen group (Sreejesh et al. 2014). In spite of the fact that the opportunity to generalise the results is limited in this case, in this study, the purposive sampling allows for answering the concrete research questions regarding the situation in the public and semi-private sectors of Qatar.
Sample Size
Representativeness in terms of quantitative studies is achieved with the focus on involving a large number of participants in the research in order to provide an investigator with opportunities to generalise the results (Neuman 2013). In order to determine the actual sample size, it is necessary to focus on the population size, the margin of error, the confidence level, and the expected response rate (Sreejesh et al. 2014). In this study, the overall population size equals the number of employees who work in three public sector organisations and four semi-private organisations. The overall number of workers employed in these seven organisations is 15,500 employees. The selected margin of error is 5% that means that a researcher expects that the score of responses will be within the range of minus 5% and plus 5% (Arya, Antonisamy & Kumar, 2012; Tejada & Punzalan, 2012). The confidence level on which it is important to focus on is 99% because this level accentuates the choice of the margin of error. The expected response rate is 20%. The reason to focus on this response rate is that researchers usually refer to the 15-20% response rate as acceptable when the response rate below 10% is regarded as low. The response rate that is higher than 30% is discussed as high, and the rate higher than 50% is discussed as very high (Baruch & Holtom 2008; Deutskens et al. 2004).
In order to calculate the sample size that is appropriate for this study with the focus on the determined factors, it is necessary to apply the following formula that is known as Cochran’s formula:
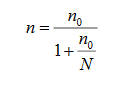
In this formula, n is the required sample size, and N is the population size. It is important to state that n0 can be found using the following formula:
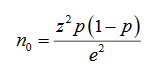
In this formula, z is used to determine the standard normal variation with the focus on the confidence level according to the z-score table, p is the population proportion (prevalence, p = 0.5), and e is the margin of error (Arya et al. 2012; Tejada & Punzalan, 2012). It is important to apply the presented formulas to calculate the sample size for this study:
- no = 2.582*0.5*(1-0.5)/0.052 = 6.6564*0.25/0.0025 = 665.64
- n = 665.64/(1+(665.64/15,500)) = ~ 637
- number of persons to invite = sample size/response rate = 637/0.2 = 3185
According to the calculations for the overall sample size, it is possible to conclude that the required sample size is minimum 637 employees, and questionnaires need to be distributed to 3185 employees in seven organisations. In order to ensure that the provided answers of respondents represent the visions of the studied population, it is necessary to calculate the sample size for each organisation according to the number of employees. While applying the discussed formulas to the population size in each organisation, it is possible to obtain the results presented in Table 1.
Table 1. Percentage of Employees to Be Involved in the Study according to the Organisation’s Size:
In order to address the requirements for the minimal sample size, it is reasonable to invite 3645 respondents and expect the 20% response rate. Such sample size will be considered as statistically acceptable (Table 2). It is important to note that a sample size of 783 employees is acceptable for this study because it is higher than 637 employees determined as appropriate for the research and because the response rate is more than 20%.
Table 2. The Sample Size and Questionnaire Distribution:
Setting
For this study, the selected setting is the State of Qatar. It is important to focus on the public sector of the country, as well as on the semi-private sector, in order to test the set hypotheses. In this study, the public sector is represented by the Ministry of Finance, the Ministry of Environment, and the Ministry of Administrative Development Labor and Social Affairs because the approaches to managing employees in these ministries are different, but they address the main general standards of the human resource management stated according to Qatar’s 2009 HRM Policy (Ministry of Administrative Development Labour and Social Affairs 2016; Ministry of Environment 2015; Ministry of Finance 2016). The selected ministries are responsible for providing the support to the public in terms of formulating the economic, environment, and labour policy while covering the large part of the public sector in Qatar (Ibrahim & Harrigan 2012).
The semi-private sector of Qatar develops actively because the government-owned organisations and companies that are partially owned by the government became more attractive to investors as reliable and reputable organisations. Ibrahim and Harrigan (2012, p. 2) state that “large financial dividends have followed from Qatar’s investments in oil and gas, and its macroeconomic achievements have been impressive.” In this context, it is important to focus on the leaders in the petrochemical and gas industries. Qatar Chemical Company Ltd (Q-Chem) is owned by petrochemical companies and Qatar Petroleum (Qatar Chemical Company Ltd 2016). The company is supported by the Government of Qatar in order to develop the standards of the competitive petrochemical industry in the country.
RasGas Qatar Company is one of the largest companies that produce liquefied natural gas (LNG) in Qatar (RasGas 2013). The LNG sector needs to be represented in the study as this industry develops rapidly in Qatar, and the country is “the largest exporter of LNG and GTLs in the world, with a supply chain that spans the globe” (Ibrahim & Harrigan 2012, p. 2). The petrochemical and LNG producing organisations are discussed today as attractive industries in Qatar because of the investment tendencies, and this setting requires the further examination. Much attention should also be paid to Qatar Foundation that contributes to the educational and social development in Qatar (Ibrahim & Harrigan 2012, p. 3; Qatar Foundation 2016). The next type of organisations that should be discussed in the study is the real estate and general investments companies. Barwa Company is one of the organisations that are leaders in the sphere of the real estate in Qatar, and the development of this semi-private organisation reflects the general tendencies in the country (Barwa Company 2016).
Instrumentation
Researchers can use a variety of structured instruments in order to collect the data for the study. A survey method is directly associated with the quantitative study, and it is possible to conduct a survey while using questionnaires or online surveys. For this study, it is appropriate to use a questionnaire as the main data collection instrument. The reason is in the necessity of providing hard and soft copies of questionnaires for the participants in contrast to the use of online surveys.
Justification to Use a Questionnaire
Researchers are inclined to pay much attention to selecting instruments in order to collect the data for the study. The reason is that the appropriate instrument can be discussed as a guarantee of receiving credible results to make relevant conclusions regarding the studied relationship. Questionnaires are specific instruments that are used in order to collect the data that are usually presented in a form of numbers or structured answers to open-ended and close-ended questions (Gill & Johnson 2010). From this point, questionnaires are practical tools. Questionnaires can be provided as hard copies or online versions or soft copies that can be completed by a large number of respondents (Sreejesh et al. 2014). Online questionnaires presented as surveys are often used in marketing and management, but the response rate for questionnaires that are provided to respondents personally is often higher because they have an opportunity to ask a researcher about the purpose of the research and clarify important issues (Neuman 2013).
The use of questionnaires is important when researchers plan to receive the accurate data and assess subjects’ perceptions in order to make generalisations related to the findings. Questionnaires are often discussed as appropriate tools in contrast to structured and semi-structured interviews that make respondents spend more time on answering questions. Furthermore, the use of a questionnaire allows for adapting items that were used in the previous studies and which reliability is approved (Saunders et al. 2009). While using a questionnaire, it is possible to gather large amount of information and save the time and resources of a researcher and respondents. Thus, one of the advantages is the possibility to administer a questionnaire easy, following the structured format, and analyse the results while using the software in order to save the time and resources. In addition, questionnaires can be distributed not only by a researcher but also by other persons involved in the study and informed regarding the plan and purpose of the research (Gill & Johnson 2010; Van Aken 2005). In this study, questionnaires are distributed to employees by managers in selected organisations.
In his work, Tangthong (2014) notes that the use of questionnaires to explore the employees’ attitudes toward HRM practices is appropriate in order to identify the associated tendencies in perceptions and behaviours. In their study, Abdullah, Ahsan, and Alam (2009) state that the relationship between the employees’ performance and commitment and HRM practices that influenced them can be found only with the help of a questionnaire that is useful to indicate workers’ ideas and visions. Hong et al. (2012) and Rahman et al. (2013) also state that the use of questionnaires guarantees that participants’ answers are collected easily and in a time-efficient manner. From this perspective, many researchers who conducted studies based on finding the relationship between HRM practices and employees’ behaviours agree that a questionnaire is an appropriate instrument in order to collect and analyse the required data.
In this study, the focus is on measuring the employees’ perceptions and possible turnover intentions influenced by the examined viewpoints. In this case, the use of a questionnaire is expected because this instrument allows for collecting the data regarding the perceptions in the form of numbers. For this purpose, researchers use questionnaires that are usually based on close-ended questions or Likert scales (Murray 2013). The choice of a questionnaire as the main data collection tool is also based on the fact that many researchers used this instrument in prior studies in order to examine the effects of HRM practices of employees’ attitudes and behaviours (Giauque, Anderfuhren-Biget & Varone 2013; Hong et al. 2012; Rahman et al. 2013). Thus, while applying questionnaires used in previous studies to this research and the process of designing questions, it is possible to compose a reliable data collection tool.
Questionnaire Design
The questionnaire for the study was developed by the researcher with references to the information obtained from questionnaires that were used in prior studies in order to guarantee the reliability of the data collection instrument. The certain criteria were determined in order to select studies that would be used in order to design a questionnaire for this research. Studies were discussed as appropriate to refer to in this research if they were written on the topic related to HRM practices, employees’ perceptions and attitudes, employees’ behaviour and turnover intentions. The used HRM practices were expected to include performance management, rewards and promotion, and training and development as the main focus of the study or as practices among other ones discussed in the work. The studies were also expected to test or demonstrate the relationship between HRM practices, employees’ job satisfaction, and the factor of retention. The used questionnaires were selected if they were based on a Likert scale. As a result, 118 articles were found according to the criteria, and 16 articles were selected for the further work. Items used in the questionnaires developed by authors were selected as appropriate to be adapted to the designed questionnaire. In addition, in order to compose certain items, it was important to refer to the text of the HRM Policy adopted in Qatar (Council of Ministers Secretariat General 2009).
The Likert scale named after Rensis Likert, the American educator and psychologist, was selected for the study as the main tool to convert the qualitative data related to employees’ perceptions into the quantitative information (Murray 2013; Saunders et al. 2009). According to this scale, respondents are asked to agree or disagree with the proposed questions or statements. Dittrich et al. (2007, p. 3) note that the Likert scale is a “ubiquitous method of collecting attitudinal data.” The use of this scale allows for constructing a questionnaire easily, while proposing relevant scores for the selected items (Ensslin et al. 2013). For this study, the 5-point Likert scale was selected in order to standardise the respondents’ answers and use them for the further statistical analysis. The participants could rate their answers with scores from 5 to 1, where 5 is ‘Strongly Agree’, 4 is ‘Somewhat Agree’, 3 is ‘Neutral’, 2 means ‘Somewhat Disagree’, and 1 is associated with ‘Strongly Disagree’.
The final version of the questionnaire includes six parts and covers five domains that are associated with five measured constructs, as well as the demographic information. In order to address details regarding HRM practices and employees’ attitudes and behaviours, five domains of the questionnaire were divided into sub-domains that are represented by specific items related to different aspects of the construct and the employee’s experience. The English version of the questionnaire was translated to Arabic because the large group of participants speaks the Arabic language. The back translation approach was used in order to make sure that the Arabic translation matches the original English version of the questionnaire, and the back translation was performed following Brislin’s (1970) guidelines.
Bilinguals were involved in the process of translating the questionnaire in order to guarantee that the items remain reliable, and they can represent the constructs adequately. The versions of the questionnaire that are presented in the English and Arabic languages should be matching, and their equivalence should be guaranteed (Brislin 1970; Ibrahim & Al Falasi 2014). Therefore, the use of the back-translation is important in order to provide the forward and backward translation that is used in order to formulate the items in the most accurate manner (Brislin 1970). This approach allows for avoiding possible changes in meanings of the items that are proposed in the original English version of the questionnaire.
Constructs to Measure
Five domains that are provided in the questionnaire represent five measures that are evaluated by respondents in the study. Following the purpose and objectives for the current study, three HRM practices, such as performance management, rewards and promotion, and training and development, were selected as measures for the study. The other two measures are correlated with the mediating and dependent variables, including job satisfaction and employee retention. The items used to represent these constructs of measures were adapted from questionnaires that were selected following the previously mentioned criteria.
Performance Management
In order to measure the employees’ perception of performance management, 11 items were adapted from studies conducted by Yamamoto (2013), Al-Kahtani and Khan (2014), Dhiman and Mohanty (2010) and Fong et al. (2011) (Appendix A). In his work, Yamamoto (2013) measured Performance Management with references to such aspects as the performance appraisal, clarity of appraisal, salary determination, and promotion. Five items were selected to be adapted to the designed questionnaire. The items that were focused on the supervisors’ support and details of the performance evaluation were adopted from the study by Al-Kahtani and Khan (2014). Items from the research by Dhiman and Mohanty (2010) discuss the problems of performance measurement and the feedback provided to employees. The item on the connection between performance management and employees’ competencies is adapted from the study by Fong et al. (2011). The specific item was adapted from the article by Riordan, Vandenberg, and Richardson (2005) in order to accentuate the aspects of performance management in rapidly developing countries (Appendix A). The statements from the articles of Qatar’s 2009 HRM Policy were also adapted to be reflected in the questionnaire (Council of Ministers Secretariat General 2009). All items that are adopted to measure the construct has the high-level reliability because Cronbach’s alpha is higher than 0.7 (Appendix A). The items were easily adapted to this study, and certain modifications were made in order to guarantee the construct validity and face validity.
Rewards and Promotion
For the purpose of measuring the effect of rewards and promotion as an HRM practice on the employees’ perceptions and attitudes, it was appropriate to adopt the items used by Yamamoto (2013), Al-Kahtani and Khan (2014), Dhiman and Mohanty (2010), and Amin et al. (2014), and Kashyap and Rangnekar (2014) in their questionnaires (Appendix A). The practice associated with rewards and promotion is discussed in Yamamoto’s (2013) study with references to the forms of compensation, the promotion fairness, the career path, the problem of the internal promotion, and types of leaves. Therefore, seven items are adapted from this research to be used in the questionnaire. Some items were adopted without any changes, and two items were modified in order to ensure the higher face validity. Two items were adopted from the work by Kashyap and Rangnekar (2014) because they reflected the issues related to the promotion fairness and internal recruiting for promotion. In order to represent the salary determination and managers’ care aspects, the items were adapted from the article by Al-Kahtani and Khan (2014). The item was modified in order to ensure the easy understanding of the statement and contribute to face validity. The items regarding the promotion method followed in the organisation were adapted from Dhiman and Mohanty’s (2010) questionnaire (Appendix A). In order to propose the reliable item to reflect the compensation types and competitiveness of the proposed rewards, it was necessary to re-formulate statements that were presented in the questionnaire developed for the studies by Snape and Redman (2010) and Tang and Tang (2012). The statements from Qatar’s 2009 HRM Policy were also referenced in the questionnaire (Council of Ministers Secretariat General 2009) (Appendix A).
Training and Development
In order to measure the effectiveness of the Training and Development practice in organisations, it was necessary to adapt the statements presented in the certain sections of the questionnaires that were used in the studies by Dhiman and Mohanty (2010) and Amin et al. (2014). In their research, Amin et al. (2014) studied the relationship between training initiatives proposed to employees and their further professional development and performance (Appendix A). These items were combined with items adapted from the work by Yamamoto (2013) in order to reflect such sub-domain as the use of the training program in place. To focus on the individual approach to discussing the training needs of employees, several items were adapted from the questionnaire used by Bulut and Culha (2010). Items were also adapted from the questionnaires developed by Al-Kahtani and Khan (2014), Den Hartog et al. (2013), and Kashyap and Rangnekar (2014) (Appendix A). The items were taken from Tang and Tang’s (2012) work in order to associate the Training and Development practice with the context of the rapidly developing country. Some statements were adapted from Qatar’s 2009 HRM Policy (Council of Ministers Secretariat General 2009). As a result, this section of the questionnaire became effective to address the employees’ attitude to the design of training programs, as well as describe the practice’s effects on the development of persons’ skills and knowledge that are necessary for the concrete position.
Job Satisfaction
In this study, much attention is paid to measuring the job satisfaction as a mediating variable between the impact of HRM practices on employees and the further retention associated with turnover intentions in organisations. The items proposed in the questionnaire developed by Yamamoto (2013) for his study were adopted for this survey because they are directly related to the relationship between HRM practices, satisfaction of employees, and their further turnover behaviour. Yamamoto (2013, p. 756) applied the appropriate formulation that started with the words “I am satisfied with…,” and it was also used in this questionnaire. These items are effective to associate the employees’ job satisfaction caused by such factors as the feeling of security, individual satisfaction, career development, compensation, and promotion. The items adopted from the mentioned article were added with statements proposed by Marescaux, De Winne, and Sels (2013) and re-formulated for the current survey in order to address the aspect of the face validity. To make the items more representative and reliable, it was also necessary to adapt the statements used in questionnaires by Kinnie et al. (2005) and Yucel (2012) to the needs of this study. Finally, it was important to refer to the statements from the text of Qatar’s 2009 HRM Policy (Council of Ministers Secretariat General 2009). As a result, all the chosen items allowed for measuring how HRM practices can influence the employees’ job satisfaction that can be associated with the aspects of commitment and retention.
Employee Retention (Turnover Intention)
In this study, the level of retention in pubic and semi-private organisations is measured with the focus on assessing the employees’ turnover intentions. This aspect is reflected in items that are selected for the self-administered questionnaire. Six items were adapted from the questionnaire used in the research by Ibrahim and Al-Falasi (2014). The main focus was on demonstrating the factors that influence turnover intentions and retention of employees, such as loyalty and commitment. In order to demonstrate the level of the employee retention in the organisation, statements were also adapted from studies by Dhiman and Mohanty (2010), Marescaux et al. (2013), Yamamoto (2013), and Yucel (2012). It was important to find items that can be the best ones in order to represent how employees’ motivation that is influenced by HRM practices can result in their assessments of needs and turnover intentions. These aspects are significant to predict the possible retention in the organisation. The items with the high level of reliability were also adopted from the articles by Al-Kahtani and Khan (2014), Bulut and Culha (2010), Kashyap and Rangnekar (2014), and Kooij et al. (2010) in order to reflect and measure the employees’ loyalty, commitment, attitude to innovativeness, and the readiness to stay with the organisation. Some items were adopted from the text of Qatar’s 2009 HRM Policy (Council of Ministers Secretariat General 2009).
Demographic Information
In order to conclude about the representativeness of the selected sample, it is necessary to include the specific section in the questionnaire that describes the demographic characteristics of the participants (Burns & Burns 2008). Therefore, the participants of this study are asked to specify the organisation in which they work in order to provide an opportunity for the effective categorisation of results. They also provide the information about their gender and age. These data are important in order to conclude about the representativeness of the sample when the results are interpreted and reported for the purpose of making generalisations (Saunders et al. 2009). The participants are also asked to answer the questions regarding their academic qualifications, the working experience, the professional path in the discussed organisation, and the salary. This information is important to be collected in order to decrease the possible bias and the impact of extraneous variables on the analysis of the collected data (Neuman 2013). The full variant of the questionnaire distributed to the participants is provided in Appendix B.
Data Collection
In February of 2016, the questionnaire that was previously used for the pilot study was revised according to the pilot study results and comments received from supervisors. The changed and added questionnaire items were translated using the back-translation technique (Brislin 1970). It was ensured that the Arabic variant of the questionnaire matched the English variant of the questionnaire items. This procedure is important to improve the content validity of the used instrument.
The gatekeepers’ permission was requested in order to continue the research process and involve participants in the main study. Managers of three selected public organisations of Qatar and four semi-private organisations of Qatar were contacted in order to agree on continuing the cooperation with the help of letters seeking the permission for conducting the main survey. The managers’ approval for conducting the study was received with the help of e-mails, as well as a letter. At this stage, managers agreed to participate in the coordination of the main study to contribute in involving employees from each organisation in the survey.
Managers were informed regarding the number of questionnaires that would be distributed in their organisations and the expected number of responses that were set according to the sample size calculations. Therefore, employees in each organisation were requested to participate in the study and fill in questionnaires according to the set percentage calculated with references to the number of employees in the concrete organisation. The difference between the selected number of participants in each organisation and the expected response rate allowed for the voluntary participation and possible withdrawal from the study at any stage (Saunders et al. 2009). Employees working in all departments or units of each organisation were involved in the study, excluding those employees working in the Human Resources Departments.
In March of 2016, 3645 questionnaires were distributed to employees in seven selected organisations in Qatar. The questionnaires were sent to managers or coordinators in organisations as printed versions. These hard copies were provided along with an envelope for each copy in order to guarantee the privacy and confidentiality of the participants. Employees were instructed regarding the procedure of completing the questionnaire and providing the filled in version in an envelope without stating the name on it or on the hard copy. Some managers and coordinators asked to provide them with soft copies of a questionnaire in order to enable employees to complete the survey and send results directly to the researcher. In this case, the confidentiality of the participants was also guaranteed as employees used the e-mail address of the organisation.
The data collection procedure was started in April of 2016 and continued till May of 2016. The reason for collecting the data during more than one month was in the fact that managers in organisations asked to provide the employees with at least two or three weeks in order to fill in questionnaires, and some managers asked to provide them with an opportunity to complete questionnaires in about four weeks. The returned 783 questionnaires were categorised into two groups: questionnaires for the public sector organisations and questionnaires for the semi-private organisations. It was noticed that the response rate was higher in a case when hard copies were returned. The response rate related to soft copies returned with the help of e-mails was lower. It is possible to explain this fact with the focus on the participation of managers or coordinators in each organisation. When hard copies of questionnaires were provided to employees, the face-to-face communication with the coordinator contributed to encouraging employees to participate in the study and monitoring the process of completing the survey (Neuman 2013). Such encouragement and monitoring were not achieved when employees were provided with soft copies of questionnaires and when they were expected to send the completed copies directly to the researcher.
When all filled-in questionnaires were collected and categorised, the data were prepared for the further analysis with the help of the SPSS tool. The data from the received completed questionnaires were entered in two separate excel sheets that were different for public and semi-private organisations. This procedure allowed for preparing the data for uploading them in the SPSS software for the further data analysis. The SPSS tool was used in order to generate the necessary tables reflecting the data analysis results.
Statistical Data Analysis
In order to analyse the data collected as a result of the study, it is necessary to select the appropriate data analysis procedures. The purpose of this study is to find the relationship between the independent, mediating, and dependent variables with the focus on the numerical information provided by the participants (Burns & Burns 2008; Saunders et al. 2009). Therefore, the statistical tools need to be used in the study. The focus is on the correlation and multiple regression analyses. The SPSS tool is planned to be used in order to conduct the correlation and regression tests, as well as to provide the data analysis reports.
Correlation Analysis
Correlation is discussed as a measure that explains the degree of relationship that can be observed between certain constructs or variables. Thus, it is possible to state that the relationship or link between variables can be of a different degree, and it is important to focus on it in order to explain the nature of relationships (Burns & Burns 2008). As a result, the purpose of the correlational analysis is to determine the presence of the relationship between variables, to identify the direction, and to focus on the strength or degree of it (Sreejesh et al. 2014). Different coefficients that are known as correlation coefficients are used in order to determine the strength of the discussed relationship (Dewberry 2004; Neuman 2013). Pearson’s r is a correlation coefficient that indicates the strength of the specific correlation or relationship between variables. The accepted range for r is from -1.00 to +1.00. This range allows for concluding about the presence of the positive or negative correlation between variables or constructs (Gill & Johnson 2010; Samuel & Okey 2015).
It is possible to conclude regarding the strength of the observed correlation with references to Cohen’s criteria, according to which the weak correlation is typical of variable that has the value from 0.10 to 0.29, the moderate correlation is associated with the score from 0.30 to 0.49, and the value from 0.50 to 1.0 can be discussed as characteristic of the strong correlation between variables (Burns & Burns 2008; Dewberry 2004). These numbers should be taken into account while interpreting the received results. In addition to the widely used Pearson’s coefficient, researchers also apply Spearman’s rank correlation coefficient that is typical of the business research and Kendall’s rank correlation coefficient that is typical of the social and management research (Saunders et al. 2009).
The correlational analysis is directly connected with the factor analysis that is conducted in cases when the correlation analysis is followed by regressions, and several variables are studied by the researcher. The factor analysis is used in order to reduce the number of variables or factors related to these variables, as it is in a case when multiple items represent one variable among other ones used in the study (Burns & Burns 2008; Neuman 2013). From this point, the factor analysis is applied in order to determine the relationships between variables for the purpose of identifying the most significant factors. In this study, the effectiveness of adopted HRM practices and employees’ perceptions cannot be measured directly (Dewberry 2004). Therefore, the factor analysis should be used in order to reduce the number of variables applied to the study. The focus on factors allows for understanding the variance in relation to the participants’ answers in the context of this or that variable (Gill & Johnson 2010; Sreejesh et al. 2014). The factor that is determined as covering the larger variance in relation to variables should be separated. It is important to reduce the number of variables while focusing on this factor as representing the variance of visions.
Regression Analysis
The regression analysis is important to be used when it is necessary to focus on the causal relationship between variables (Burns & Burns 2008; Sreejesh et al. 2014). This statistical tool is based on measuring the relationship with the help of a regression equation. The simple regression analysis examines the linear relationship between the independent and dependent variables (Dewberry 2004; Neuman 2013). While using the regression analysis, a researcher is interested in how a certain independent variable can influence the other variable (Burns & Burns 2008; Gill & Johnson 2010). However, this approach does not address the impact of a variety of associated factors that can also affect the dependent variable (Saunders et al. 2009). In contrast to the simple regression analysis, the multiple regression analysis allows for controlling the other factors that can influence the dependent variable, and they are taken into account during the procedure of analysis. Walliman (2010, p. 125) states that this technique is “used to measure the effects of two or more independent variables on a single dependent variable measured on interval or ratio scales.”
In this study, the effect of such HRM practices as Performance Management, Rewards and Promotion, and Training and Development on the employees’ intentions to stay in the organisation is mediated with references to the employees’ job satisfaction. The complexity of these relationships can be addressed only while using the multiple regression analysis in which Performance Management, Rewards and Promotion, and Training and Development are independent variables, Turnover Intention is a dependent variable, and Job Satisfaction is a mediating variable. In order to conclude regarding the results received after conducting the multiple regression analysis, it is important to focus on the R-square, f-value, and t-value (Rosopa & Stone-Romero, 2008; Walliman 2010).
The Pilot Study
In order to conclude regarding the appropriateness of the selected data collection instrument that is provided in a form of a questionnaire, it is necessary to pre-test it with the focus on the small sample. This approach is known as a pilot study that is often used by researchers in order to guarantee the reliability and validity of the selected instrument (Dewberry 2004; Walliman 2010). In this case, the pilot study was used in order to check the representativeness of the sample and the reliability of the developed questionnaire.
Pilot Study Design
The pilot study was conducted in order to test the validity of the questionnaire as an instrument selected for the research. Furthermore, the purpose of the pilot study was to develop and test the research design in order to use it in the main study. The results of the pilot study were planned to be used in order to improve the items of the questionnaire prepared for the distribution to the larger sample. A pilot study is important to be conducted before starting the main study in order to test the questionnaire, to examine the appropriateness of statistical tools to receive the data, and to study the overall validity and reliability of the used instruments (Gill & Johnson 2010; Neuman 2013). The focus on conducting a pilot study allows for decreasing the number of weaknesses and possible errors in the main study.
The objectives of the pilot study, as well as the hypotheses for testing, reflect the objectives, research questions, and hypotheses adopted for the main study. It was also important to test the validity of both correlation analysis and multiple regression analysis as statistical tools that can be used in the main study. It was important to evaluate the significance of Qatar’s 2009 HRM policy and related HRM practices for influencing the employees’ turnover intention in the public sector organisations in the country in comparison to the semi-private organisations. Thus, the pilot study was aimed at revealing how HRM practices adopted in public and semi-private organisations of Qatar after 2009 could influence the employees’ intention to stay or leave the job.
Still, the number of selected respondents was significantly lower that it was planned for the main study. Thus, 140 employees working in three public sector organisations and four semi-private sector organisations, including gas, petrochemical, investments and real estate, and education or social industries, were invited to participate in the study. The non-probability purposive sampling was adopted for the pilot study in order to involve employees from the targeted public and semi-private organisations. Questionnaires were distributed to participants with the help of e-mail. 110 completed questionnaires were returned, and the response rate was very high (68%).
The pilot study allowed for testing the purposive sampling in terms of its advantages and possible limitations. The selected sampling technique contributed to saving the time and resources, and the target audience of employees was involved in the study (Gill & Johnson 2010; Sreejesh et al. 2014). However, it was found that the purposive sampling lacks representativeness, and it is possible to speak about the high level of bias when managers working with employees can influence the selection of respondents indirectly. These limitations were addressed with the focus on developing the demographic section in the questionnaire. It was added in order to represent diverse employees. For the main study, the involvement of the larger number of employees from each organisation was planned. The quality of the used questionnaire was approved by supervisors. The structure of the questionnaire was developed to reflect such five domains as Performance Management, Rewards and Promotion, Training and Development, Job Satisfaction, and Retention. The use of the 5-point Likert scale was also approved by the pilot study. The questionnaire was evaluated as having the high-level clarity and accuracy.
Pilot Study Analysis
The results of the study demonstrated that the selected sample is rather representative in terms of demographics. It was found that the majority of employees in the public sector are females (73.7%). In the semi-private sector, the number of females is lower, and they represent only 39.4%. In both public and semi-private sectors, employees are aged between 25 and 35-45 years. It was found that, in the public sector, 62.3% of employees have the Bachelor Degree, and in the semi-private sector, this degree is obtained by 51.1% of employees. The pilot study indicated that the used questionnaire is appropriate to test four hypotheses for the research because it was found that there was a statistically significant relationship between the implementation of certain HRM practices and the employees’ satisfaction and turnover intention. The Pearson correlation analysis indicated that the highest correlation of 0.619 was typical of the relationship between Job Satisfaction and Employee Retention in the public sector. The strong correlation was also typical of the semi-private sector (0.588). The moderate correlation was typical of the relationship between Rewards and Promotion as an independent variable and Employee Retention in the public and semi-private sectors.
The multiple regression analysis indicated the presence of significant relationships between HRM practices and Employee Retention as a dependent variable in the public sector. The results showed that it was possible to predict the high impact of Performance Management on Employee Retention (beta is.623) and Job Satisfaction on Employee Retention (beta is.611). The HRM practices had the moderate effect on Job Satisfaction (the highest beta is.503). In the semi-private sector, Rewards and Promotion had the most significant effect on Employee Retention (beta is.511) in spite of the fact that the overall relationship can be discussed as moderately significant. The relationship between HRM practices and Job Satisfaction was significant, with the highest beta of.880.
It was found that Hypothesis 3 was not supported because HRM practices did not influence employee retention in the semi-private sector organisations in a way that could differ from results typical of the public sector. Hypothesis 4 was supported only partially because there were no significant relationships between HRM practices and Job Satisfaction, and then, Employee Retention, that were characterised of all HRM practices. The only meaningful relationship was found for Rewards and Promotion and the mediating variable, and then, the dependent variable. The pilot study results did no demonstrate the significant difference in the perceptions and behaviours of employees in public and semi-private sectors in Qatar. The results also accentuated the necessity of distributing questionnaires to the larger number of participants in order to address the problem of the gender imbalance among participants and make the sample representative. The findings of the pilot study were taken into account while planning the main study, selecting the research design, and improving the questionnaire.
Validity and Reliability
In this study, the validity and reliability are tested with references to the instrument used for the data collection. It is also important to guarantee the validity of a questionnaire with references to the scheme provided in Figure 2. The conducted pilot study allowed for speaking about the high validity and reliability of the designed questionnaire. Thus, it was important to ensure the validity and reliability of selected questionnaire items with the focus on the English and the translated Arabic versions of the questionnaire (Burns & Burns 2008; Dewberry 2004).
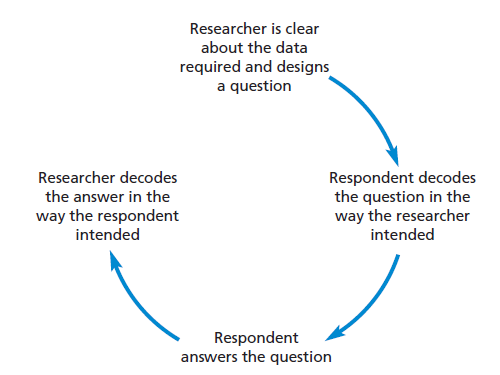
Validity is referred to when it is necessary to state whether the used instrument is appropriate to measure the selected constructs. It is possible to determine four main types of validity that are content validity, face validity, construct validity, and convergent validity (Neuman 2013). Content validity is associated with the particular content of items that should be appropriate in order to test the set hypotheses with references to the selected sample (Bell & Bryman 2007; Quinton & Smallbone 2005). This validity can be discussed as a guarantee that all aspects of the studied concept are measured with the help of the used items (Neuman 2013). Thus, items are expected to cover all details of the measured construct in order to ensure the quality of the research. In this study, content validity was guaranteed with the focus on the process of adapting items to the studied domains in order to cover all the associated factors (Gill & Johnson 2010). Content validity was also tested with references to the supervisory team’s feedbacks.
Face validity is an extent to which the item can represent the studied construct or domain in order to be recognised and understood by respondents. When the face validity is high, items include key words that are helpful to obtain the target information from participants (Neuman 2013; Sreejesh et al. 2014). Experts usually assess questionnaire items in terms of their suitability in order to ask for the certain information (Gill & Johnson 2010). In this study, the face validity was achieved through modifying the selected items, adding key words associated with the domain, and making them representative in terms of the measured construct. The face validity was also assured with the help of the pilot study. It is also important to note that when the face validity is high, respondents perceive the questionnaire seriously because they discuss the items as directly related to the topic of the research (Neuman 2013). Even if the content validity is high, items in a questionnaire can be perceived as confusing or ridiculous when the face validity is not addressed (Saunders et al. 2009).
Construct validity is a concept that is focused on measuring the appropriateness of the items to represent the certain domain (Neuman 2013). This construct is often discussed as a variable of the study. Therefore, it is important to measure how items cover the content and how they can represent the particular variable to ensure that this variable can be measured easily. Construct validity is connected with convergent validity when it is necessary to measure the correlation between different items that are selected to represent or support the construct (Gill & Johnson 2010). In the pilot study, construct validity and convergent validity of the questionnaire were supported with the help of the factor analysis.
In addition to guaranteeing the validity of the questionnaire items, it is also necessary to ensure that the selected statements are reliable. Reliability is measured in order to state whether a measure or a construct has errors that can influence the study results in terms of their accuracy and representativeness (Quinton & Smallbone 2005). Reliability demonstrates that the research results can be the same if the selected instrument will be used one more time. It is important to note that the reliability of data collection instruments is usually measured with the focus on internal reliability. Cronbach’s alpha is a typical measure that is used in order to test the reliability of items. This coefficient demonstrates the reliability of the construct while measuring its internal consistency (Neuman 2013; Streiner 2003). Cronbach’s alpha results are measured using the scale from 0 to 1. The high reliability is associated with the numbers that are close to 1. Researchers note that items can be discussed as reliable if their alpha is higher than 0.7 (Bonett & Wright 2015; Streiner 2003). Still, some researchers agree that the value of 0.6 and higher is also reliable (Neuman 2013; Streiner 2003). However, for this study, the alpha that equals to or higher than 0.7 was selected as desirable.
The Performance Management items adapted from the work by Yamamoto (2013), Al-Kahtani and Khan (2014), Dhiman and Mohanty (2010), and Fong et al. (2011) have Cronbach’s alpha from 0.7 to 0.89. The Rewards and Promotion items were adapted from the studied by Yamamoto (2013), Al-Kahtani and Khan (2014), Dhiman and Mohanty (2010), Amin et al. (2014), Kashyap and Rangnekar (2014), and Fong et al. (2011). The Cronbach’s alpha range that is typical of these items is from 0.71 to 0.83. The Training and Development items were adopted from the works by Yamamoto (2013), Al-Kahtani and Khan (2014), Dhiman and Mohanty (2010), Amin et al. (2014), Den Hartog et al. (2013), Bulut and Culha (2010), and Kashyap and Rangnekar (2014). Cronbach’s alpha ranges from 0.73 to 0.9. The Job Satisfaction items were modified with references to items found in studies by Yamamoto (2013), Marescaux et al. (2013), Kinnie et al. (2005), and Yucel (2012). Cronbach’s alpha is from 0.7 to 0.86. The items to represent Employee Retention were selected from articles by Ibrahim and Al-Falasi (2014), Yamamoto (2013), Al-Kahtani and Khan (2014), Dhiman and Mohanty (2010), Marescaux et al. (2013), Kooij et al. (2010), Yucel (2012), Bulut and Culha (2010), and Kashyap and Rangnekar (2014). The Cronbach’s alpha results are from 0.72 to 0.94.
Ethical Considerations
Ethics in research means the conduct that is appropriate in order to address the interests of participants and achieve the aims of the study. It is important to guarantee the protection of the participants, and any risks for respondents should be avoided (Creswell 2009). It is a task of researchers to focus on ethical issues that can be observed during the research process. Before starting the research, it was necessary to receive the faculty’s and the ethics committee’s approval (Bell & Bryman 2007). Furthermore, it was necessary to address such issues as confidentiality, privacy, and anonymity in relation to participants (Neuman 2013). For this research, letters seeking permission of managers to conduct the study in the organisation were sent one month prior to starting the main study. The letters included the information regarding the research objectives and its importance for organisations in such rapidly developing countries as Qatar. Along with the approval for conducting the survey, managers and participants also provided the signed informed consent forms that indicated that participants were informed about their role in the study and that they understand that their confidentiality, privacy, and anonymity would be preserved (Creswell 2009; Sreejesh et al. 2014). Figure 3 explains the significance of the informed consent for the research.
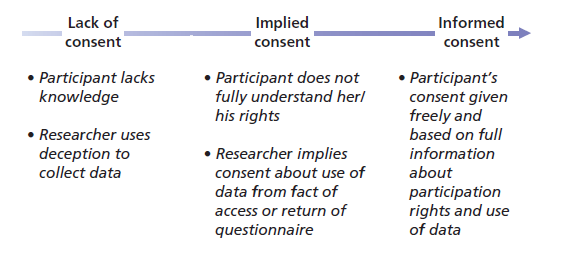
The letter asking for permission to conduct the study or letters for gatekeepers included the information about the research design, and informed consent forms included the information on how the confidentiality of participants would be protected. The letters also included the important information regarding the possibility to withdraw from the study at any stage of the research process (Walliman 2010). Managers of seven organisations provided their agreement to involve their employees in the planned study.
The approach based on seeking the permission for conducting the study and providing the detailed explanation regarding the research design was selected in order to ensure participants that their interests would be protected (Gill & Johnson 2010). This step is important in order to affect the potential participants’ interests and their desire to join the study. Furthermore, it is important to accentuate that the participation in the study is voluntary (Bell & Bryman 2007). Participants were contacted with the help of e-mail and through their managers since hard copies of questionnaires were provided to employees to fill in along with documents that were sent to employees’ e-mails. The absence of the direct face-to-face contact with the employees contributed to preserving their anonymity and protecting confidentiality (Neuman 2013). When the data were collected, they were stored in the computer archive, labelled to address the issue of confidentiality, and protected with the help of a password. The focus on following ethics procedures guaranteed protecting the interests of the participants and the researcher. These procedures allowed for conducting the study according to the adopted ethical norms and principles.
Chapter Summary
The chapter has described the research methodology that was selected for this study in detail. The positivist paradigm was chosen among the existing research philosophies in order to provide the specific framework for the study. The descriptive quantitative research was justified to be applied to the study with the focus on utilising the deductive approach in order to plan the work with research questions, hypotheses, and subjects. In addition, the discussion of available quantitative research strategies is presented in this chapter with the focus on the survey technique. It was also justified that the survey based on the use of a questionnaire was a reasonable choice for the study. Such data collection instrument as a questionnaire was selected with references to the discussion of the sample’s attributes. The chapter has provided the detailed description of the sampling population, its size, and subjects’ characteristics. The aspects of the setting were also discussed in the chapter. In order to support the necessity of using a questionnaire for working with the large population, the description of the questionnaire design was presented, as well as details of the data collection procedures. The overview of data analysis techniques is provided in the chapter along with the discussion of the pilot study’s results to support the use of the developed questionnaire. The final sections of the chapter describe the issues of validity and reliability, as well as ethical considerations.
Reference
Abdullah, Z, Ahsan, N & Alam, S 2009, ‘The effect of human resource management practices on business performance among private companies in Malaysia’, International Journal of Business and Management, vol. 4, no. 6, pp. 65-72.
Al-Kahtani, N & Khan, N 2014, ‘An exploratory study of human resource development practices in Telecom industry in Saudi Arabia: a case study of private sector’, European Scientific Journal, vol. 10, no. 1, pp. 341-355.
Amin, M, Khairuzzaman, W, Ismail, W, Zaleha, S, Rasid, A, Daverson, R & Selemani, A 2014, ‘The impact of human resource management practices on performance’, The TQM Journal, vol. 26, no. 2, pp. 125-142.
Arya, R, Antonisamy, B & Kumar, S 2012, ‘Sample size estimation in prevalence studies’, The Indian Journal of Pediatrics, vol. 79, no. 11, pp. 1482-1488.
Baruch, Y & Holtom, B 2008, ‘Survey response rate levels and trends in organizational research’, Human Relations, vol. 61, no. 8, pp. 1139-1160.
Barwa Company 2016, Home Page, Web.
Bell, E & Bryman, A 2007, ‘The ethics of management research: an exploratory content analysis’, British Journal of Management, vol. 18, no. 1, pp. 63-77.
Bonett, D & Wright, T 2015, ‘Cronbach’s alpha reliability: interval estimation, hypothesis testing, and sample size planning’, Journal of Organizational Behavior, vol. 36, no. 1, pp. 3-15.
Brislin, R 1970, ‘Back-translation for cross-cultural research’, Journal of Cross-Cultural Psychology, vol. 1, no. 3, pp. 185-216.
Bryman, A 2006, ‘Integrating quantitative and qualitative research: how is it done?’, Qualitative Research, vol. 6, no. 1, pp. 97-113.
Buchanan, D & Bryman, A 2007, ‘Contextualizing methods choice in organizational research’, Organizational Research Methods, vol. 10, no. 3, pp. 483-501.
Bulut, C & Culha, O 2010, ‘The effects of organizational training on organizational commitment’, International Journal of Training and Development, vol. 14, no. 4, pp. 309-322.
Burns, RP & Burns, R 2008, Business research methods and statistics using SPSS, Sage, New York.
Council of Ministers Secretariat General 2009, Law no (8) of year 2009 on the promulgation of the human resources management laws, CMSG, Doha.
Creswell, J 2009, Research design: qualitative, quantitative, and mixed methods approaches, Sage Publications, Los Angeles.
Den Hartog, D, Boon, C, Verburg, R & Croon, M 2013, ‘HRM, communication, satisfaction, and perceived performance: a cross-level test’, Journal of Management, vol. 39, no. 6, pp. 1637-1665.
Deutskens, E, De Ruyter, K, Wetzels, M & Oosterveld, P 2004, ‘Response rate and response quality of internet-based surveys: an experimental study’, Marketing Letters, vol. 15, no. 1, pp. 21-36.
Dewberry, C 2004, Statistical methods for organizational research: theory and practice, Psychology Press, Los Angeles.
Dhiman, G & Mohanty, R 2010, ‘HRM practices, attitudinal outcomes and turnover intent: an empirical study in Indian oil and gas exploration and production sector’, South Asian Journal of Management, vol. 17, no. 4, pp. 74-104.
Dittrich, R, Francis, B, Hatzinger, R & Katzenbeisser, W 2007, ‘A paired comparison approach for the analysis of sets of Likert-scale responses’, Statistical Modelling, vol. 7, no. 1, pp. 3-28.
Ensslin, S, Ensslin, L, Back, F & Lacerda, R 2013, ‘Improved decision aiding in human resource management’, International Journal of Productivity and Performance Management, vol. 62, no. 7, pp. 735-757.
Fong, C, Ooi, K, Tan, B, Lee, V & Chong, A 2011, ‘HRM practices and knowledge sharing: an empirical study’, International Journal of Manpower, vol. 32, no. 6, pp. 704-723.
Giauque, D, Anderfuhren-Biget, S & Varone, F 2013, ‘HRM practices, intrinsic motivators, and organisational performance in the public sector’, Public Personnel Management, vol. 42, no. 2, pp. 123-150.
Gill, J & Johnson, P 2010, Research methods for managers, Sage, New York.
Hong, E, Hao, L, Kumar, R, Ramendran, C & Kadiresan, V 2012, ‘An effectiveness of human resource management practices on employee retention in institute of higher learning: a regression analysis’, International Journal of Business Research and Management, vol. 3, no. 2, pp. 60-79.
Ibrahim, I & Harrigan, F 2012, ‘Qatar’s economy: past, present and future’, QScience Connect, vol. 2012, no. 9, pp. 1-24.
Ibrahim, M & Al Falasi, S 2014, ‘Employee loyalty and engagement in UAE public sector’, Employee Relations, vol. 36, no. 5, pp. 562-582.
Kashyap, V & Rangnekar, S 2014, ‘A structural equation model for measuring the impact of employee retention practices on employee’s turnover intentions: an Indian perspective’, South Asian Journal of Human Resources Management, vol. 1, no. 2, pp. 221-247.
Kinnie, N, Hutchinson, S, Purcell, J, Rayton, B & Swart, J 2005, ‘Satisfaction with HR practices and commitment to the organisation: why one size does not fit all’, Human Resource Management Journal, vol. 15, no. 4, pp. 9-29.
Kooij, T, Jansen, P, Dikkers, J & De Lange, A 2010, ‘The influence of age on the associations between HR practices and both affective commitment and job satisfaction: a meta-analysis’, Journal of Organizational Behavior, vol. 31, no. 8, pp. 1111-1136.
Krauss, S 2005, ‘Research paradigms and meaning making: a primer’, The Qualitative Report, vol. 10, no. 4, pp. 758-770.
Marescaux, E, De Winne, S & Sels, L 2013, ‘HR practices and HRM outcomes: the role of basic need satisfaction’, Personnel Review, vol. 42, no. 1, pp. 4-27.
Ministry of Administrative Development Labour and Social Affairs 2016, Web.
Ministry of Environment 2015, About us,Web.
Ministry of Finance 2016, Departments, Web.
Morgan, D 2007, ‘Paradigms lost and pragmatism regained methodological implications of combining qualitative and quantitative methods’, Journal of Mixed Methods Research, vol. 1, no. 1, pp. 48-76.
Murray, J 2013, ‘Likert data: what to use, parametric or non-parametric?’, International Journal of Business and Social Science, vol. 4, no. 11, pp. 258-264.
Neuman, W 2013, Social research methods: quantitative and qualitative approaches, Pearson, Boston.
Qatar Chemical Company Ltd 2016, Home, Web.
Qatar Foundation 2016, About Qatar Foundation, Web.
Quinton, S & Smallbone, T 2005, ‘The troublesome triplets: issues in teaching reliability, validity and generalisation to business students’, Teaching in Higher Education, vol. 10, no. 3, pp. 299-311.
Rahman, M, Akhter, R, Chowdhury, S, Islam, S & Haque, M 2013, ‘HRM practices and its impact on employee satisfaction: a case of pharmaceutical companies in Bangladesh’, International Journal of Research in Business and Social Science, vol. 2, no. 3, pp. 62-67.
RasGas 2013, Home, Web.
Riordan, C, Vandenberg, R & Richardson, H 2005, ‘Employee involvement climate and organizational effectiveness’, Human Resource Management, vol. 44, no. 4, pp. 471-488.
Rosopa, P & Stone-Romero, E 2008, ‘Problems with detecting assumed mediation using the hierarchical multiple regression strategy’, Human Resource Management Review, vol. 18, no. 4, pp. 294-310.
Samuel, M & Okey, L 2015, ‘The relevance and significance of correlation in social science research’, International Journal of Sociology and Anthropology Research, vol. 1, no. 3, pp. 22-28.
Saunders, M, Lewis, P & Thornhill, A 2009, Research methods for business students, Pearson, London.
Scandura, T & Williams, E 2000, ‘Research methodology in management: current practices, trends, and implications for future research’, Academy of Management Journal, vol. 43, no. 6, pp. 1248-1264.
Shepherd, C & Challenger, R 2013, ‘Revisiting paradigm(s) in management research: a rhetorical analysis of the paradigm wars’, International Journal of Management Reviews, vol. 15, no. 2, pp. 225-244.
Snape, E & Redman, T 2010, ‘HRM practices, organizational citizenship behaviour, and performance: a multi-level analysis’, Journal of Management Studies, vol. 47, no. 7, pp. 1219-1247.
Sreejesh, S, Mohapatra, S & Anusree, M 2014, Business research methods, Springer International Publishing, New Delhi.
Streiner, D 2003, ‘Starting at the beginning: an introduction to coefficient alpha and internal consistency’, Journal of Personality Assessment, vol. 80, no. 1, pp. 99-103.
Tang, T & Tang, Y 2012, ‘Promoting service-oriented organizational citizenship behaviors in hotels: the role of high-performance human resource practices and organizational social climates’, International Journal of Hospitality Management, vol. 31, no. 1, pp. 885-895.
Tangthong, S 2014, ‘The effects of human resource management practices on employee retention in Thailand’s multinational corporations’, International Journal of Economics, Commerce and Management, vol. 2, no. 10, pp. 1-30.
Tejada, J & Punzalan, J 2012, ‘On the misuse of Slovin’s formula’, The Philippine Statistician, vol. 61, no. 1, pp. 129-136.
Van Aken, J 2005, ‘Management research as a design science: articulating the research products of mode 2 knowledge production in management’, British Journal of Management, vol. 16, no. 1, pp. 19-36.
Wahyuni, D 2012, ‘The research design maze: understanding paradigms, cases, methods and methodologies’, Journal of Applied Management Accounting Research, vol. 10, no. 1, pp. 69-80.
Walliman, N 2010, Research methods: the basics, Routledge, London.
Will, M, Bertrand, J & Fransoo, J 2002, ‘Operations management research methodologies using quantitative modeling’, International Journal of Operations & Production Management, vol. 22, no. 2, pp. 241-264.
Yamamoto, H 2013, ‘The relationship between employee benefit management and employee retention’, The International Journal of Human Resource Management, vol. 23, no. 4, pp. 747-767.
Yucel, I 2012, ‘Examining the relationships among job satisfaction, organizational commitment, and turnover intention: an empirical study’, International Journal of Business and Management, vol. 7, no. 20, pp. 44-58.