Abstract
The ubiquitous diffusion and rapid adoption of digital media into the Universities’ academic learning environments has contributed a considerable body of knowledge on the unfolding media usage patterns among traditional and nontraditional students. A survey involving 339 students from Saud University was used to investigate media usage patterns, yielding significant data on how media has shaped the usage behavior of students. The main strand of research focused on the profile of users versus the usage patterns of web-based applications such as social networks to get access to academic content, take their lessons, do homework, and collaborate with other students on peer-to-peer platforms to achieve their academic goals. Media usage includes print and electronic media, e-learning platforms, media provided by teachers. Questionnaire responses were analysed using SPSS software and reliability tests were done based on the Cronbach’s Alpha of 0.7. In theory, Cronbach’s Alpha of 0.7 or 0.8 show high internal consistency of the questionnaire constructs. The key critical success factors of the study were that students’ preference to use digital media shaped their media usage patterns depending on the media type, ownership, and access.
Introduction
The features of digital devices and web-based applications that afford efficacious communication among students and teachers have pervaded the modern learning environments significantly changing the learning environment and the learner’s behaviours. Here, learning is a static object, but a dynamically collaborative process achieved through seamless collaboration of learners and teachers on a network of shared connections. The platform has been used to model the media access rates, usage patterns and behaviour among traditional and non-traditional students. However, Chatti, Jarke and Frosch-Wilke (2007) and point out that the digital technologies and web-based applications have significantly shaped the learner’s behavior by complementing the traditional teaching and learning methods that are used in many learning institutions today. Scholars argue that students’ use of digital devices such as mobile electronic equipment to complement the use of Web 2.0 technologies and other web-based applications to get access to the Internet for curriculum content has shaped the thinking of students and moulded the technology usage patterns to meet their academic needs. That has also shaped their acceptance of web-based as useful tools for classroom interactions, which provides a platform for students to communicate their own findings on different platforms and forums and for teachers to communicate feedbacks about course progress reports. Communication also enables students to create new knowledge and presentations, which they share among themselves (Rollett, Lux, Strohmaier & Dosinger, 2007).
Empirical evidence presented by Bhatt (2001) and Beetham and Sharpe (2013) support the idea that using web-based applications play instrumental roles as conduits of information flow, learning resources, knowledge acquisition and exchange to cover the curriculum content depending on the students’ behavioural use of technology. In the course of conducting the study, questions on how do the students’ demographic profiles and interactions with technology and behavior influence their studies arise? To answer the research questions, the research was conducted to determine the students’ rate of access of supporting technologies in the classroom such as web-based applications, access rates to the technologies, users’ learning behaviours, and their patterns of using technology in the classroom for content acquisition (Fulk, Steinfield, Schmitz & Power, 1987). To address the study, the following research questions provided the ground upon which the paper was written.
Statement of the problem
Studies conducted on how students use technology for content acquisition has left a serious gap in knowledge because each technology is used differently, compelling the need to investigate the usage patterns, behavior, and how the demographic profiles influence access to the technologies. The rationale is to determine the most appropriate technologies that could address the students’ usage patterns, demographic profiles, and behavioural patterns in academia.
Research objectives
- To research on the students’ technology usage patterns for academic work
- To investigate the media usage patterns among students
- To analyse recent research about the technology usage behavior among learners
Research questions
- What kind of digital devices do the students own or have access to the Internet?
- Which media and e-learning tools and services are used for learning?
- How often are they used and what is their benefit?
- How are Web 2.0 applications and social networking sites in particular used for learning?
- What are the differences between traditional and non–‐traditional students regarding the acceptance of media, tools and services for their learning and regarding their demand for e-learning?
- What kind of media usage types can be identified and how do these profiles relate to individual and contextual factors associated with the students (e.g. gender, social status, employment status, children?
Signigicance of the study
The study was designed to benefit the Universities in determining the right devices and social networking sites that could be sued to make a presence on the web for academic purposes.
Terminology used
In this paper, modern technologies are defined as “the collections of tools and technical innovations that enable the use of digital devices and resources to pursue the learning objectives on Internet enabled applications and devices” (McCarthy, 2010, p.1). Social networks are defined as “dedicated channels on web-based infrastructure through which people share information” (Urry, 2003, p.4). The learning environment is a “collection of tools, the virtual and physical environments that enable leaners to interact with their teachers by accessing educational materials using clearly defined procedures”. The learners’ behavior is defined as “the mental and physical activities exhibited by a student when conditioned to do so to produce certain outcomes” (McCarthy, 2010, p.2).
Literature Review
Technologies
Individual characteristics, the structural approach to information dissemination, the dynamic of social networks, and the predisposed characteristics of traditional and nontraditional learners have strongly contributed to the structural determination of students’ behavior towards the use of technology for learning. Urry (2003) notes that individual learners show varying degrees of inclination towards the use of media for learning purposes. Here, today’s learners be they traditional or nontraditional students are exposed to a wide range of technologies that have been integrated into the University’s mainstream educational frameworks and other higher learning institutions for knowledge acquisition and content delivery. Figure 1 shows some of the applications which include the virtual world, podcasts, e-quizzes, digital stories, audio self-recoding, Wikis, chart rooms, interactive whiteboards, video conferencing, blogs, web conferencing, workplace simulations, and community simulations.
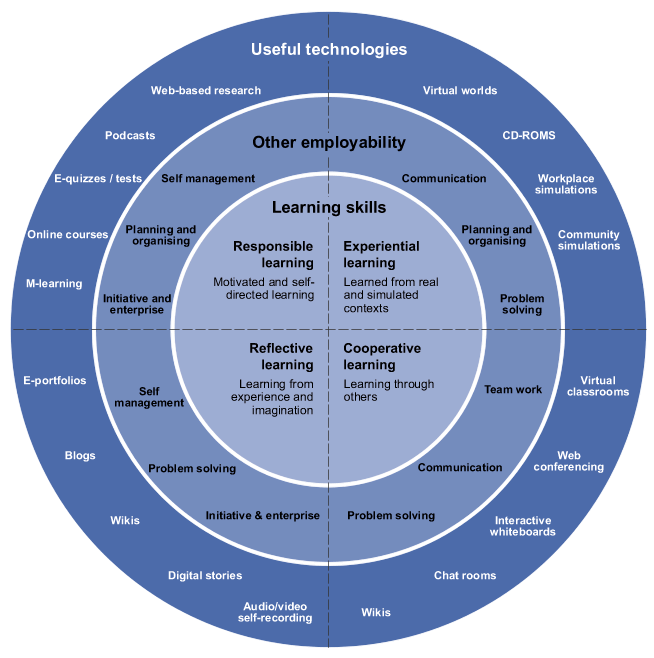
Web 2.0 technologies
Studies conducted in academic settings demonstrate the position of Web 2.0 technology as the most widely used web-based application in educational environment has shaped the way education is taught to traditional and nontraditional students (Carlson & Zmud, 1999). Rollett et al. (2007) notes that Web 2.0 is used as the mainstream technology that students have embraced because of the increased sense of belonging to a community of learners ready to use technology. However, the applications are tailored to suit the learning objectives, learning environment, and the user’s skills. Figure 1 shows students intending to use web-based applications and digital media should learn the basic skills to be comfortable with their use. The most critical skills to learn include reflective learning which depend on the experience of the leaners, imagination and cooperative learning that enables learners to acquire skills through others, and the ability to use peer-to-peer networks for knowledge sharing (Cheung, Chiu & Lee, 2011). The ability to use the self-learning method for knowledge acquisition by guiding learners on how to use technology for knowledge acquisition strongly contributes to the success of the use of technology for educational purposes. Research studies show that the experiential learning strategy enhances the learners’ skills through a knowledge acquisition strategy by using computer simulated environments.
According to Rollett et al. (2007), Web 2.0 technology provides crucial tools such as interactive learning environments that are beyond the static pages that are common on most websites. The technology is highly flexible because it allows users to create and share content by providing a platform that supports communication, collaboration, information sharing, and connectivity among the users.
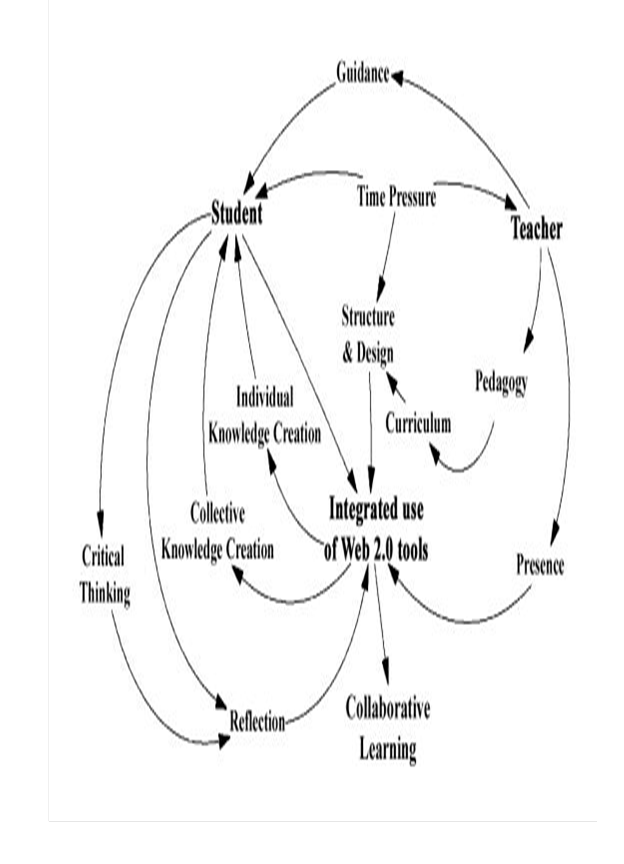
Figure 2 shows how Web 2.0 technology enables users to develop critical thinking skills, evaluate their self-reflection abilities, conduct learning activities on the applications, create on-line presence, and get engaged in collaborative learning with other students. The technology has an interface that guides teachers on how to integrate pedagogy with technology to deliver content to students, which enables them conduct their studies on the application (Seufert, Von Krogh & Bach, 1999). The technology enhances the students’ abilities to cover the curriculum on time, enables teachers to structure and design appropriate content for instructional proposes to ensure effective curriculum coverage, and guides students to work effectively even when working under pressure to deliver the desired results within the set deadlines. According to Seufert et al. (1999), technology enables students and teachers to interact on a peer-to-peer platform for collaborative learning to create knowledge that is suited to meet the specialised needs of different students.
However, the distinct difference between Web 2.0 technology and other web-based applications is that students or teachers do not require specialised skills to use the Web 2.0 technology to create and upload academic content. In addition, Web 2.0 technology is highly flexible and appropriate for use in the classroom because it enables and supports interactive collaboration and sharing of content between the teachers and the students according to schedule (Steinfield, Ellison & Lampe, 2008).
Steinfield et al. (2008) contends that Web 2.0 technology can be acquired at a low cost, it is easy to use and integrate with other frameworks, and it is flexible. It is easy to get access to information on the web depending on when and where needed using Web 2.0 technology and it is highly interoperable with many technologies used in academia for educational purposes. The application is less complex as compared with other applications and provides users with the opportunities to ensure controlled access to information and particularly academic content (Zhang, Johnson, Seltzer & Bichard, 2009). Zhang et al. (2009) and Warschauer (1997) argue that Web 2.0 technology provides students and teachers with the ability to create and post digital content, allows for innovation, enables users to test didactic innovations, allows for the redistribution of efforts, reducing the work done by each student. The application is highly reliable, allows for continuous use without disruptions, and provides a platform for students and teachers to share new discoveries. The successful integration and use of Web 2.0 tools enables students to acquire knowledge in real time using electronic devices when compared with the traditional classroom methods for pedagogical content delivery that are slow and dependent on face to face interactions between the students and the teachers.
However, Cain (2008) noted that Web 2.0 technology has several limitations when used for pedagogical content acquisition and delivery. Web 2.0 technology is slow in speed when compared with other desktop applications for academic use and does not provide an interface that allows users to interact with other applications that are integrated it into the technology. People intending to use the technology can only do so after they have invested time and money to learn on how to use application. In addition, the technology is less secure when compared with other applications used on the Internet for the same purpose (Cain, 2008).
Another technology that is widely used for content acquisition is podcasting. Teachers prepare instructional content materials that they upload for delivery to the students using the web as a platform which is accessed at anytime from anywhere on the Internet. The rationale for using podcasting was that most students had an easy access to the Internet because the Internet infrastructure was easy to get access to the Internet because of the low costs. For the classroom environment, specialised materials are easily prepared and posted on the Internet to address the specialized needs of each groups using the SNS for their studies. The ability to accommodate the needs of different users has made podcasting a popular and preferred application in many Universities as for content acquisition and delivery.
Podcasting
Urry (2003) argues that podcasting enhances the delivery of knowledge and can be used to address the specific learning goals and needs of students. Here, investigations show that podcasting can be used to provide students with web-based materials that are created with specific themes. Students benefit from such materials signing up to the specific podcasting site to automatically receive new content when it is posted on the web. Further, an increase in the demand to use podcasting to post lecturing materials is on the increase and that has increased the popularity of the technology among the students and lecturers (Valenzuela, Park & Kee, 2009). Typically, podcasting enables students to get access to academic content at their convenient time, enables the indexing of lectures, and provides lecturers with the ability to lecture on the web and upload appropriate content that is customised to meet specialised needs of the students. In addition, universities use podcasting to investigate and identify the difficulties students experience in understanding different concepts and to recommend the areas to concentrate on for further studies to address their problems.
Numerous advantages of using podcasting as a technology in the classroom have been established. Here, podcasting enables students to download lectures and seek for clarification in the content areas they have not understood in the downloaded materials (Valenzuela et al., 2009). In addition, podcasting accommodates a wide array of learning strategies and enables lecturers to create materials that target students with different learning capabilities and backgrounds. Podcasting fits into the needs of different students because those who are not able to attend lectures because of illnesses or for any other reasons can be reached with the study materials and content on the web. A typical example includes students taking their courses in English as second language. Investigations show that most of the students who previously used tape recorders for most of the time when taking English as a second language have opted to use podcasting as an emerging tool to get access to academic content on the Internet (Shirky, 2011). According to Shirky (2011), podcasting is flexible and easy to use, cheap, easily available, and does not impose additional requirements for the student to purchase additional software and hardware to get access to academic content on the web.
Despite the numerous advantages associated with podcasting for the student who take their educational content materials from the web, podcasting has some disadvantages such as making the students to develop a tendency of not attending classes and instead seek for materials on the Internet, which leads to increased attrition of classroom attendances.
Social networks for academic purposes
The use of social networking sites for academic purposes has been on the increase in the recent past with more universities integrating social media as a tool for digital and electronic content acquisition. An investigation by Shirky (2011) demonstrated that social networking sites provide a platform for students and teachers to create and upload content to be shared on a peer-to-peer network once it has been made available. Web 2.0 technology is one of the typical examples that have been discussed above that provides a platform for peer-to peer-communication. The technology has widely been used on the Internet between the student and the teachers have significant awareness on how to use the application besides being the most rapidly adopted technology in use today (Schmitz & Fulk, 1991).
Typically, the aim of using social sites is to enable collaborative learning by sharing content and disseminating knowledge using blogs, social book marketing sites, online comments, articles, videos, and wikis among others. Studies conducted on social networking sites show that the social sites increase or foster collaborative learning which fosters active participation and cohesion among the students and teachers. In addition, studies show that even social networking sites that are often used for commercial practices are also used for educational purposes. In addition, commercial sites such as Facebook and YouTube are used for educational services because teachers can upload academic materials such as clips and other educational materials for students to download (Resta & Laferrière, 2007).
Among the several examples where Facebook has been used is in educational purposes. The strategy involves creating a group of users who include teachers and students on Facebook and marking the group with the subject name or title that enables the students to uniquely identify a group to join and share content with to get access to academic content posted to the group. In most cases, the groups are created among the students in a spontaneous manner.
Patterns of using media, technology, and social networks in education
As technology permeates every aspect of society, it is increasingly causing significant changes in the way societal affairs are run, so has a similar impact been experienced in the realms of education. Traditional methods of learning have been the bedrock of delivering content to the students on a face to face environment. However, it has become apparent that the seamless integration of technology into the mainstream educational framework has changed the way leaners embrace and acquire knowledge at all levels of education including the University level (Resta & Laferrière, 2007). Despite the integration and use of technology as a knowledge delivery framework, it has not overwhelmed the use of traditional learning methods, underlining the multifaceted profile of learners evident in the learning intuitions today. The enabling environment includes uses a virtual platform that is characterised by virtual face-to-face sharing of information on the web-based platforms. In addition, the technology enables interactions to occur using video and voice messages that are mediated through social media.
Many institutions of higher learning are keen to adopt the e-learning platforms with customised applications and social media such as YouTube to blend traditional and modern learning techniques to facilitate e-learning and curriculum coverage. The goal is to ensure that the right content and abilities are rendered the student to ensure low attritions and higher satisfaction among the students.
Brady, Holcomb and Smith (2010) maintain that the best strategies of designing the e-learning environment is by ensuring that the environment allows for seamless collaboration among the learners and the teachers, good human interactions for effective use of the e-learning platforms, and the ability to afford personalised learning among users of technology. An appropriate learning environment should factor the user’s knowledge and experience, motivation to use the environment, accommodate a variety of content, and flexibility in the instructional content delivery (Cain, 2008).
In addition, the use of media and its seamless integration into the content delivery framework provides a significant area of interest to discover the media usage patterns and to determine the behavioral characteristics of media usage for studies in the modern learning University environments.
A modern investigation on the profile of traditional users of technology showed that the seamless integration of technology into the mainstream education framework enable students to collaborate with peers and teachers to share academic content. For instance, “Google allows several individuals to collaborate on one document where notes can be made, audio feedback incorporated, and team members can chat in real-time while editing the document and the culture embraces a global mindset” (Brady, Holcomb & Smith, 2010, p.34). Another trend is the humanizing interactions that enable students and teachers to interact collaboratively among themselves by creating and sharing content on the web. The technique enables “asynchronous interaction (not in real-time) that is facilitated by the use of other programs and applications, such as applications that record audio and video, are much improved and conducive to providing students with audio feedback. Learning Management platforms (LMS) also have improved substantially; many include robust tools for asynchronous communication” (Cain, 2008, p.2). When used, the above mentioned system does not remove the use of face to face interactions but enhances content delivery. On the other hand, the use of personalised learning provides users with the experience of a personalised control of the learning environment. The applications are customised to fit the learning needs of the students, making personalised approach to the learning experience of the students.
Cheung et al. (2011) conducted a modern day study ion the use of Facebook among students, a study was conducted by classifying the study into the students’ usage profile, attitudes, and the effects of using the social media for content acquisition. The study factored the time spent on social networking sites, the number of friends they were interacting with on the SNS, the type of activities done by the students, and the reasons for using Facebook as a SNS (Cheung et al., 2011; Cho, Gay, Davidson & Ingraffea, 2007).The study by Cho et al. (2007) revealed that most students spent between 10 to 60 minutes on Facebook per day. A smaller number of students spent less time on Facebook but registered a high frequency of attempted logins to Facebook. On the other hand, other participants reported spending on average 38.93 min on Facebook. The study established that most students access Facebook during working days and the frequency of visiting Facebook during the weekends was lowest among the students than working days as was observed in the study (Steinfield, Ellison & Lampe, 2008). The reason was that most students were away from their computers on weekends and that reduced the time they took to interact on Facebook. However, study did not include the interactions that occur among students on the SNS for leisure.
In terms of friend on Facebook, the study revealed that most of the students had between 150 and 350 friends and a mean of 297 friends. The study established that that most of the friends were peers or of the same age and in the same class besides noting that not all interactions among the students were intended for academic purposes. The results show that university students with the intentions to use the SNS for academic purposes showed a high response rate. A detailed analysis of the purpose for which the students signed up on Facebook showed that most of the students used the platform to post “personal information such as birthday (96%), e-mail address (85%), hometown (85%), and 81% relationship status” (Valenzuela et al., 2009, p.1). In addition, the study showed that “97.4% posted their school name, 83.1% their e-mail address, 92.2% their birth date, 80.5% their the current city or town in which they live, and almost all respondents reported posting an image of themselves (98.7%) and photos of their friends (96.1%)”. However, most of the students on Facebook interacted on the platform for leisure and to post their own materials and not for academic work. The frequency of using Facebook for academic purposes was low (Valenzuela et al., 2009, p.2).
Another study using several questions to investigate the rate of using Facebook showed that most of the students who used the platform to share their notes and homework, project materials and other academic resources were fewer than those who use the platform for leisure (Hernandez, Montaner, Sese & Urquizu, 2011). It was noted in the same study that the most students use the platform to send messages, chart, communicate with friends, post photos, and meet new people on the social platform (Hung & Yuen, 2010).
Haythornthwaite (2005) conducted a study to determine the patterns of using technology among students for learning purposes. Haythornthwaite (2005) used different constructs to create the questionnaire to collect the data and evaluate that was used to evaluate the usage of technology for leaning purposes. The study used the second factor loading to evaluate the usage of technology by considering the web as a platform for learning resources, authoring tools, web games, multimedia usage, and for social interactions (Haythornthwaite, 2005). The questionnaire responses were analysed on a second-order analysis and the results showed that the use of social networking sites for entertainment had the highest loading factor followed by the use of web authoring tools, multimedia usage, games, social interaction, and studies respectively (Haythornthwaite, 2005).
To further understand the patterns of using technology among the students, the study investigated the learning perceptions of the students with technology, how technology was used to teach the community, its usage among peers, and how the students used the technology to the seek for help. The results showed that peers loved using technology for learning but failed to seek for help when they experienced some difficulties using the web as an authoring tool. On the other hand, the use of web technologies to get access to resources used for learning registered higher scores when evaluated on the community scale (Haythornthwaite, 2005). In conclusion, most students do not like to ask for assistance if they experience difficulties when using web-based technologies to get access to content for their studies.
Learners’ usage behavior
Media usage behavior depends on the media they use to get access to content on the Internet and web-based platforms. The study focused on the use of desktop computers and other media and the purpose for which they devote the media such as socialising, sharing discoveries and innovations, doing homework, and other study activities.
Chen and Chen (2009) conducted a study to investigate the aptitude of students toward the use of technology in education and noted varied responses which differed significantly among students according to their demographic profiles. To ensure reliability, Chen and Chen (2009) conducted the study for two years by factoring the learner’s behaviors towards the use of technology for learning purposes. In addition, the investigations were also conducted in an environment consisting of students with good access to technology (Chen & Chen, 2009). The results showed a gap in knowledge on the question of the learner’s behavior towards the use of technology (Garton, Haythornthwaite & Wellman, 1997). The investigation used “seventy-five questions regarding demographics, inventory of how they use their current technology, and attitudes and behaviors concerning technology were asked” (Ellison, 2007, p.11). In summary, the questions inquired on were the type of technology that was in use and specialised on investigating the rate of use of computers among students in the university for educational purposes. Here, the attitudes of the students towards the use of technology were evaluated across all the demographic respondents.
Ellison (2007) noted that 94% of the students had a personal computer and the rate of adoption of computers was increasing. The reason for the increase in computers was that students regard the use of the device as an integral part of learning. According to the study, most of the students used computers to communicate by sharing different information on different platforms. On the other hand, 51% of the students agreed that they used computers to do their assignments and solve other academic problems. In addition, an increase in the ownership of mobile phones was noted among students who also registered a high mobile phone ownership (Orlikowski, 2000). On the other hand, it was established that devices with keyboards were important because they enabled users to send e-mails, browse the Internet, view multimedia, instant messages and for word processing” (Ellison, 2007, p.12). Other devices with high usage were the iPods/MP3 players, digital cameras, and Flash storage drives among students who were involved in the study. It was noted that an increase in the acquisition of storage devices occurred among the students despite lacking an investigation into how they were being used (Kanuka & Anderson, 2007).
Hagedoorn and Duysters (2002), Flanagin and Metzger (2001) and Ellison, Steinfield and Lampe (2006) argue that the percentage of students who acquired and used digital media was on the increase because they used the devices to get access to course materials posted by their lecturers on SNS. The study established that the use of digital devices for the acquisitions of contents and access to digital media was on the increase among the students. The study concluded using statistical data that 88% had an account on Facebook and 73% had an account on MySpace. In addition, the ownership of various technologies including cellphones, PDAs, Digital Cameras, and Computer, which registered the highest possession rate (Maia, Almeida & Almeida, 2008).
A study by McCarthy (2010) to determine the students’ behavior towards technology showed that learners appreciated and felt encouraged to use technology for further studies. In addition, the study showed that integrating technology into the classroom could positively increase their perceptions towards the teachers and the content they were provided to study.
Studies by McCarthy (2010) to investigate the learning behavior of students toward Social Networks (SNS) in academia by administering web-based questionnaires administered on students revealed that 87% had a web presence for the purpose of sharing information and to communicate among friends and teachers. It was revealed that 76% of the students maintained an online presence to find new friends and 20% used the online presence for academic purposes. A detailed study on the differences in gender among the users of media for educational purposes showed significant variations between male and female students.
McCarthy (2010) conducted a study to determine the differences between traditional and non–‐traditional students regarding the acceptance of media, tools and services for their learning and regarding their demand for e learning. The study involved 300 students who use modern electronic devices and those who prefer not to use devices (Valenzuela et al., 2009). The study showed that students are the same despite the platform used to instruct them and the level of engagement varied between the two groups and the outcomes such as content retention and persistence. It was determined that traditional methods provide a more effective platform for engagement and retention of content when compared with web-based teaching methods (Valenzuela et al., 2009). In addition, non-traditional students had a high attrition rate than students on a traditional platform. In addition, attendances at lectures were lower for student who used web-based applications to learn new knowledge, consolidate knowledge, and revise exams than those who used traditional methods (Kanuka & Anderson, 2007).
The differences between traditional and non-traditional students
It has long been established that traditional students have been an important component of universities because they conform to the learning environment that already was established (Valenzuela et al., 2009). However, because of the integration of technology into the mainstream knowledge acquisition, modern students are rapidly replacing the traditional student, who is compelled to adopt the emerging profile of modern learning environment.
Academic literature is full of various contentious definitions of traditional and non-traditional students. Valenzuela et al. (2009) distinguishes traditional and non-traditional students by inferring that traditional students are those aged 24 years and above who are fresh from school. Non-traditional students are those who usually delay enrollment at higher levels of education and consume a significant amount of their time attending part time classes for much of the academic year. In the Anglo-American environment, non-traditional students have financial stability, work for long hours, do not possess high school diploma, and have dependents. Such learners have lifelong commitment to studies, are motivated to take studies because of their status in society, and consider education and knowledge acquisition as a lifetime commitment. In addition, non-traditional students are compelled by the need to advance their studies which is triggered by personal life transitions. Urry (2003) notes that non-traditional students have a long term commitment to knowledge acquisition because e-learning environments are able to meet their needs such as a flexible learning environment, an environment that supports and mentors them, knowledge that has implications on their personal lives, and ease with which knowledge acquisition can be achieved. It is important to note that non-traditional learning and assessment methods embrace peer-to-peer feedback, observations and shadowing, case study, group work, thought, and experiment.
The trend in the increase of the population of non-traditional students is caused by the demand for new and better skilled employees, a changing environment, and rapid advances in technology. Valenzuela et al. (2009) examined a pool of knowledge and summarised the characteristics of non-traditional students to include those leaners that add value and come to education with intentions, better expectations, have established their learning patterns, are more focused, are driven by personal objectives, and have complete responsibility of the learning process.
However, Valenzuela et al. (2009) recommends that non-traditional students operate in a diverse and heterogeneous environment that requires the management of the universities to formulate strategies to address the needs and expectations of the category of students.
On the other hand, traditional learning methods embrace face to face instructions delivery methods while using virtual web-based platforms methods for content delivery. According to Valenzuela et al. (2009), ttraditional methods are highly interactive; provide students with the opportunity to seek for clarification by asking questions, allow for conversation, discourse, and the flexibility to practise new skills.
The web-based presence allows for interactions and the mode of delivery of accessing instructions is flexible. Traditional students conduct their discussions through verbal and on a one-on-one basis. Studies conducted to compare modern with traditional students among 200 students revealed that non-traditional students showed that modern students registered lower persistence rates than traditional face to face students. However, many of the results were conflicting in the context of gender, age, students’ learning goals, grade point averages, and hours of contact (Valenzuela et al., 2009). However, it has been revealed that traditional students feel intimidated when told to use technology than modern students, and instructors find it difficult to engage traditional students using technology to teach (Urry, 2003). However, modern students are more inclined and feel comfortable to use technology, electronic devices such as mobile phones to get access to the Internet for academic content and have high levels of acceptance for the use of web-based applications.
Acceptance of media, tools and services
Many researchers agree that modern students have shown positive inclination towards the use of social media, tools, and services for academic purposes. Many explanations have been proposed as the reasons for the acceptance of social media as a platform for acquiring academic content. Urry (2003) argues that the advent of social media has permeated every aspect of social life such as business, education, personal lives, the acceptance and use of SNS for academic purposes has shown a similar trend among students in universities. The positive trend has further been demonstrated by the high levels of confidence and the ease of access of academic content through social networking sites among students, availability and advancement of internet mobile band services, integration and use of web-based applications, the low cost of digital devices such as web enable mobile phones has facilitated the increase in the level of acceptance of web-based applications for academic work (Urry, 2003). The advancement of internet infrastructure, social media technologies that emphasize on collaboration, community creativity, and communication has facilitated the acceptance of social media for academic use.
However, the use of social media for academic purposes depends on the category of media that has received widespread adoption among the leaners. The seven categories of social media include social networking, text based, virtual world games, synchronous communication, conferencing, mobile base applications, media sharing, and mashups technologies. The continuous growth of the worldwide web, the vast amount of academic content on the Internet, and the integration of the web-based technologies into the universities’ academic environments have facilitate the acceptance rate and use of media and its tools for academic purposes.
Demand for e-learning
The demand for e-learning among university students has taken a similar trend as the acceptance rate of the tools such as mobile phones and media to get access to academic content on the Internet has increased. Academicians argue that e-learning provides the most appropriate platform to mediate and enhance active learning of the students besides using the technology as a learning resource (Kanuka & Anderson, 2007). According to Urry (2003), e-learning is increasingly being adopted by many people because it enables them to schedule classwork around the work and family, reduces the time and cost one takes to travel to campus and home, enables one to build self-knowledge and confidence while encouraging students to take personal responsibilities in scheduling their study programs, enables students to study as long as Internet access is available, and provides students with the flexibility to select study materials of their choice. Web-based studies provide students with the flexibility to study at their own pace, enable them to join and post their discussions on bulletin boards, and enable them to master areas containing new information (Steinfield et al., 2008).
Despite the demerits such as low motivation among learners, lack of routine structures, lack of instructions when needed by the student, slow internet access, and inability to simulate hands on lab work, the study shows the demand for e-learning is on the rise among university students (Steinfield et al., 2008).
Different kinds of media and usage types
Steinfield et al. (2008) investigated the useful factors that have implications on the student’s use of any media for studies. Some of the contextual factors student’s prior knowledge, tasks and learning outcomes, the ability to be assessed on the media, nature and physical features of the media, motivation, logistic factors, the learning context, and the conditions under which the media appears to be useful and effective. Steinfield et al. (2008) noted that technology was affording the users a platform that enabled students and teachers to collaborate, engage in the exchange of ideas on online forums, shape the culture of the users, and enhance creativity. The goal of using different media is to acquire new knowledge, transfer knowledge on the platforms, enhance information with new knowledge, and create quick and simple interactions among the users. However, the factors that influence the adoption and use of media include portability of the devices, familiarity of the leaners.
The acceptability and use of different media typed depend on the integrated mechanisms that enable the student to monitor their progress, the provision for feedback and progress assessments, ability to allow for a wide selection of choices to repetitive tasks, and the ability to support learning tasks.
In addition, the learning domain, knowledge of the area of study, and ease of use of the media were additional factors Steinfield et al. (2008) proposed as salient factors that affect media use. Carlson and Zmud (1999) proposed that the accessibility, ease of use, cost, sense of immediacy, portability, ease of manipulation, and flexibility in allowing collaboration were important factors for determining the media type to use for an effective learning environment. The typography, which include the font sizes and styles, the layout of e-learning course features, the color and texture of different elements, and the medium of communication were used to determine the usage patterns among students with different demographic profiles (Steinfield et al., 2008).
Carlson and Zmud (1999) viewed the transaction that occurred on an e-learning environment to be a critical factor in determining the usability of a specific media type for distant learning. The transaction involved the learner and the student, leaner and content, and the interface between the learner and the media.
Orlikowski (2000) and Urry (2003) analysed a case study involving 100 students of different age brackets on the use of media using cellphones, webcams, whiteboards, screen casting, desktop computers, mobile phones, and smartphones. The results showed that access to the technology, usage skills, and the purpose for which the media was intended for use had a significant impact on the usage statistics. A significant percentage, 30% of the male population compared with 21% of the female student population had access to electronic media were skilled on the use of media, and younger people below the age of 20 years had a low usage statistics of electronic media. Access to media and media ownership were significant among the traditional and non-traditional learners (Urry, 2003). In addition, the learning objectives that were important in determining the type include step by step task performance of learning tasks, facts and concepts, procedures, and the pedagogical elements.
Fiting into individual and contextual factors
A study to determine the usage of media based on individual contextual factors revealed that both male and female students in different age categories accept the use of social media and tools such as iPhones to get access to academic content. Studies show that young male and female college students, experience greater motivation when using digital media for studies. However, older students spent less hours using digital; media to get access to study materials and were less efficient than younger students using the same devices to get access to educational content, leading to the need for lecturers respond differently to different pedagogical; needs of the students (Steinfield et al., 2008).
Methodology
The study was conducted by focusing on traditional and nontraditional media usage patterns on social networking sites and the behavioral learning patterns. The survey questionnaires consisting of the user’s behavior, technology access, media access and ownership relied upon a unidirectional form of communication to collect participant data.
Sample and instrument
The target population consisted of King Saudi University students who use technology for their studies across different disciplines. The study was conducted to analyse the patterns of using modern technologies and social networking sites and the behavior of learners using electronic devices involving 324 students from King Saudi University. A probabilistic sampling strategy was used to select the participants from the target population. The probabilistic sampling strategy using a stratified sampling technique used to identify the population which consisted of traditional and non-traditional University students. The sample frame consisted of systematically selected students from the population of male and female University students. The rationale was to ensure equal representation of participants to avoid bias using a questionnaire to collect data standardized questions because it was flexible to administer and analyze (Tavakol & Dennick, 2011; Liu, Wu & Zumbo, 2010).
The questionnaire was built by determining the required questions, making the question short and clear, avoiding double negatives, and skillfully using balanced listings.
Questionnaire reliability
The impression on the reliability of the questionnaire instrument for data collection was to show how accurate, intense, and reliable the results were using dichotomous and non-dichotomous closed ended questions (Stocks & Freddolino, 1999). The reliability and internal consistency of the questionnaire constructs were tested using the Cronbach’s alpha values by analysing a sample of the questions.. According to Tavakol and Dennick (2011, a Cronbach’s alpha of 0.8 and above showed a high reliability, however, a Cronbach’s alpha of 0.5 and above was still considered to be reliable. The test results generated a Cronbach’s Alpha of.725, showing that the questionnaire constructs had high reliability.
According to the results shown in table 1, the Cronbach’s Alpha based on standardized items is.920 and generally when applied across all the items used in the study, the Cronbach’s Alpha is.910 which is above the recommended value of 0.800. The constructs used in the questionnaires to collect data had high reliability because of the accuracy of the results (Tavakol & Dennick, 2011).
The results showed that 309 respondents answered the questionnaires and provided the data was keyed into the system for analysis, which showed 90.3% validity with 9.7% responses being invalid out of a sample size of 339 participants. An analysis of the questionnaire showed 90.3% validity and a.920 Cronbach’s Alpha, showing perfect validity and reliability.
The responses on table 3 show an average response rate of 305 of valid questionnaire responses among the target population of 339 administered questionnaires. Table 3 shows that the standard deviation lies between 1.56819 and.90889 and the mean varies between 1.2066 and 3.6174. In addition, it is evident from table 3 that the Std. Error Mean occurs between.05204 and.09084. There are significant variations of the Std. Deviation, showing that some items were deleted from the original sample of 339 participants because some of the respondents did not provide answers to all items.
Table 4 shows the results after some items were deleted to determine the reliability of the questionnaire. The average value of the Cronbach’s Alpha, if Item some items were deleted was below.616 and above.502. Because the Cronbach’s Alpha of.5 was considered to be reliable, the questionnaires items were deemed to have high internal consistency and to be strongly reliable.
Procedure and timeframe
Because the sample size and the number of questionnaires to distribute were large, the questionnaires were systematically issued with the help of the research assistants who were recruited for the purpose of helping with the administration of the questionnaires. Each student was required to fill and return a dully filled questionnaire to the assistant or any member of the research team. In addition, respondents who found it difficult to understand the questionnaires were free to seek for clarification from the research team to ensure appropriate responses were made.
Data collection was done for three days because of the time required to cover the large sample size and to clean and code and make the data appropriate for statistical analysis. The Cronbach’s Alpha was used to evaluate the validity and reliability of the questionnaires so that the correct data could be collected to answer the research questions and provide accurate results to address the problem.
Findings
The statistics strengths of the impressions of the responses measured on a scale of access, ownership, and neither ownership nor access ownership levels of the electronic devices among the students who use the electronic devices to get access to the Internet for academic content are shown in table 5. The results were evaluated for the validity of the responses among the students for each construct that was used in the questionnaire. The number of students with electronic devices that provided valid answers for each construct varied between 298 for possessing the E-Book Reader and the responses for Smartphones were 305 as shown on table 5. The lowest numbers of missing items were 2 and the highest were 11, showing that valid items were high when the missing items were low and vice versa.
Table 6 shows the statistics done to determine the percentage of students possessing Smartphones showed that 19.4 % neither had access nor ownership and those with ownership were 26.2% while 27.5% had access to the Internet using either the devices or the computers provided by the university.
Table 6: Smartphone usage frequency and percentages
Table 7 shows the desktop computer responses with 21.1% having full ownership and access, 46% having access, 25% having neither ownership nor access, 7% having no ownership, and 12% having no ownership and access of the desktop computers.
Table 8 shows that 69.8% of the respondents own a printer, 13.9% have access to a printer, and 8.7% do not have direct access to the printer which they could use to print academic materials. However, not all the questionnaires that were issued were duly returned because a 1.3% of the participants did not answer the question.
Table 9 shows that 20.7% of the respondents owned a mobile phone that could provide Internet access, 31.8 % had access to the Internet, and 20.1 % did not have an ownership of a mobile phone that could provide Internet access. The percentages of those who own the cellphone with Internet access were 21% and 32.1 % had no access to the Internet while and 20.1 % neither had access nor ownership if no items were deleted from the analysis. On the other hand, table 10 shows that 37.9% of the respondents owned or had access to P3-Player (e. g. iPod) and 27.2 % had access while 16.2% did not have access to the device.
Table 9: Cellphone without Internet access
Table 10 shows the statistics of the ownership status of MP3-Player (e. g. iPod) among the students. Typically, the 37.9% of the students have full ownership, 27.2% have access, 16.2% have neither ownership nor access, 14.9% have no ownership, and 1.9% does not have ownership or access to the devices.
Table 11 shows a detailed description of the usage rates of the digital devices depending on the users. The results show that 86.7% regarded the devices to be very useful, 8.4% to be useful, 1% not to be useful, and 0.6% never and do not know respectively.
Table 11 shows that 86.7% of the respondents agreed that print media were important or very useful for academic work and 0.6% disagreed that the print media was not useful and 2.6% of the questionnaires were not answered.
Table 11: The use of printed media for academic studies
Table 12 provides a statistical analysis of those students who use electronic books with 52.4% agreeing that they use the books for academic work and 9.1% and 1.9 % of the respondents did not find the e-book useful.
Table 12: Usage of electronic books
Table 13 shows that 63.4% of the respondents use the college email account to post their assignments to the respective tutors. However, 8.4% use the email account rarely and 1% does not use the email account for academic purposes. The total numbers of responses were 309 while valid responses were obtained from 299 participants.
Discussion
The mean number of students who possess electronic devices with Internet access was the highest for mobile devices is 3.9704 and lowest for those with printer/scanner is 1.4393 and mean for the rest of the devices is above 2.00. Here the Cronbach’s Alpha is above.50, which shows high reliability among the students in accessing the Internet because the average number of students who possess the devices is 305 among the ample size of 324 students. The standard deviation is.90889, which shows that most students have access or own mobile devices which provide reliable access to the Internet. A detailed analysis of each item shows a 96.7% possession or access rate for smartphones, 96.1% for desktop computers, 95.7% for scanners, 73.8% mobile phones, 83.1% MP3-Player (e. g. iPod) when calculated cumulatively.
The statistical results showing the usage of digital devices to get access to the Internet for web-based content such as to download applications, lecture notes, homework, and post assignments are shown on table 12. The standard deviations for each construct show the access rates of the resources using the electronic devices. The standard deviations shown in table 11 for the devices include Smartphones (1.22025), laptops (1.18149), desk top computers (1.02803), Smartphone with Internet (1.46773), tablet with Internet access, tablet-PC (.57350), and Internet access at home (1.35702). Apparently, the standard deviation for print media is the lowest, with a standard deviation of 0.5 and a mean usage of 1.1528 measured on a scale of showing that despite the decline in usage of print media among the students, print media is still popular among the students with 86.7% fining it to be very useful, 8.4% find print media useful, and less than 1% do not find the print media useful. It is worth commenting that despite the significance of print media, it does not substitute digital media. Analytically, the observed trend is an indication that no significant deviations occur among the users of the electronic devices to get access to online academic content, leading to the conclusion that most students use the devices to get access to the Internet for notes and other necessary materials for their studies.
However, different sites and resources have different usage statistics for academic purposes among the students. The standard deviations of the use of Electronic books (1.26449), Use Email account (1.07487), Skype group conference (.78975), Wikis (.65200), Social networking (.67703), Blogs (1.12536), Twitter (1.47327), Facebook (.94792), Lecture recordings (.78784), Search Engines/Google (.91497), YouTube (.83698), and Social Networks (1.07051) show that the standard deviations vary insignificantly indicating that the student’s presence on the Internet is supported on any one of the platforms. The frequency of use and access to the Internet show a positive trend and high acceptance among the students. The conclusion is that the use of technology that included web-based applications pervades the entire student population learning patterns.
The behavioral patterns are consistent with the modern trends and acceptance of technology use among university students either for instructional purposes or to get access to academic content on the web. The reliability and the strength of the relationship between the usage of electronic devices and students’ attitude have a Cronbach’s Alpha of.661 showing high internal consistency and acceptability and use of online content and electronic devices. In addition, there was an insignificant difference in terms of the reliability of the items defining the access rates of academic materials on the web. The behavior and patterns show high significance rates because the Cronbach’s Alpha if Item were deleted was above 0.5 for each construct. For instance self-discipline had a Cronbach’s Alpha of.661, I learn from my mistakes was.636, I enjoy studying was.621, I enjoy challenges was.593, and I evaluate my own performance was.627. The results showed that most students developed learning patterns that were inclined towards the use of technology to conduct their studies. The results showed that students enjoy using technology for academic work and prefer to address the challenges that arise when using technology for academic purposes.
Conclusions and Recommendations
In conclusion, the study showed that a significant number of students had easy access to digital media and other electronic devices such as smartphones to get access to the Internet for academic purposes. In addition, most students used web-based applications to get access to content collaborate with other students on social networking sites to communicate among themselves. In addition, the study revealed that social networking sites such as Facebook were critical in enabling peer-to-peer communication and web-based collaborations among the students who readily embraced the use of the technology. Additional technologies that popular among the students include podcasting and Web 2.0. The study revealed high access rates to social media and many students showed positive usage behaviors. However, it was recommended that further studies be conducted to determine the specific technologies that were reliable and popular among the students that could the right platform for students to use for further studies.
Summary
In summary, preference of ruse of web-based applications such Facebook and podcasting to get access to academic materials from the Internet, share their innovations, share problems, seek assistance from their peers on challenging academic problems, and get engaged in collaborative learning among the students is intense. In addition, the study showed that most students prefer the use of web-based learning to the use of traditional face to face methods. Evidence from the study shows that most students possess or have direct access to electronic devices such as smartphones and internet enabled mobile phones and desktop computers to get access to academic content uploaded by the lecturers on the web. In conclusion, the study shows that most students prefer to use web-based applications for academic work, but recommended that further research be conducted to determine the most preferred web-based applications students like most that can be integrated into the academic framework and used to deliver instructional materials and support interactions between the students and the teachers.
References
Bhatt, G. D. (2001). Knowledge management in organizations: examining the interaction between technologies, techniques, and people. Journal of knowledge management, 5(1), 68-75.
Beetham, H., & Sharpe, R. (Eds.). (2013). Rethinking pedagogy for a digital age: Designing for 21st century learning. New York, U.S.A: Routledge.
Brady, K. P., Holcomb, L. B., & Smith, B. V. (2010). The use of alternative social networking sites in higher educational settings: A case study of the e-learning benefits of Ning in education. Journal of Interactive Online Learning,9(2), 151- 170.
Cain, J. (2008). Online social networking issues within academia and pharmacy education. American journal of pharmaceutical education, 72(1)
Carlson, J. R., & Zmud, R. W. (1999). Channel expansion theory and the experiential nature of media richness perceptions. Academy of management journal, 42(2), 153-170.
Chatti, M. A., Jarke, M., & Frosch-Wilke, D. (2007). The future of e-learning: a shift to knowledge networking and social software. International journal of knowledge and learning, 3(4), 404-420.
Chen, I. Y., & Chen, N. S. (2009). Examining the factors influencing participants’ knowledge sharing behavior in virtual learning communities. Educational Technology & Society, 12(1), 134.
Cheung, C. M., Chiu, P. Y., & Lee, M. K. (2011). Online social networks: Why do students use Facebook?. Computers in Human Behavior, 27(4), 1337-1343.
Cho, H., Gay, G., Davidson, B., & Ingraffea, A. (2007). Social networks, communication styles, and learning performance in a CSCL community. Computers & Education, 49(2), 309-329.
Ellison, N. B. (2007). Social network sites: Definition, history, and scholarship. Journal of Computer‐Mediated Communication, 13(1), 210-230.
Ellison, N., Steinfield, C., & Lampe, C. (2006). Spatially bounded Online social networks and social capital. International Communication Association, 36(37), 12-29
Flanagin, A. J., & Metzger, M. J. (2001). Internet use in the contemporary media environment. Human communication research, 27(1), 153-181.
Fulk, J., Steinfield, C. W., Schmitz, J., & Power, J. G. (1987). A social information processing model of media use in organizations. Communication research, 14(5), 529-552.
Garton, L., Haythornthwaite, C., & Wellman, B. (1997). Studying Online social networks. Journal of Computer‐Mediated Communication, 3(1), 0-0.
Hagedoorn, J., & Duysters, G. (2002). Learning in dynamic inter-firm networks: the efficacy of multiple contacts. Organization studies, 23(4), 525-548.
Haythornthwaite, C. (2005). Social networks and Internet connectivity effects. Information, Community & Society, 8(2), 125-147.
Hernandez, B., Montaner, T., Sese, F. J., & Urquizu, P. (2011). The role of social motivations in e-learning: How do they affect usage and success of ICT interactive tools?. Computers in Human Behavior, 27(6), 2224-2232.
Hung, H. T., & Yuen, S. C. Y. (2010). Educational use of social networking technology in higher education. Teaching in higher education, 15(6), 703-714.
Kanuka, H., & Anderson, T. (2007). Online social interchange, discord, and knowledge construction. International Journal of E-Learning & Distance Education, 13(1), 57-74.
Liu, Y., Wu, A. D., & Zumbo, B. D. (2010). The impact of outliers on Cronbach’s coefficient alpha estimate of reliability: Ordinal/rating scale item responses. Educational and Psychological Measurement, 70(1), 5-21.
Maia, M., Almeida, J., & Almeida, V. (2008). Identifying user behavior in Online social networks. Proceedings of the 1st workshop on Social network systems 1(1), 1-6
McCarthy, J. (2010). Blended learning environments: Using social networking sites to enhance the first year experience. Australasian Journal of Educational Technology, 26(6), 729-740.
Orlikowski, W. J. (2000). Using technology and constituting structures: A practice lens for studying technology in organizations. Organization science, 11(4), 404-428.
Resta, P., & Laferrière, T. (2007). Technology in support of collaborative learning. Educational Psychology Review, 19(1), 65-83.
Rollett, H., Lux, M., Strohmaier, M., & Dosinger, G. (2007). The Web 2.0 way of learning with technologies. International Journal of Learning Technology, 3(1), 87-107.
Schmitz, J., & Fulk, J. (1991). Organizational Colleagues, Media Richness, and Electronic Mail A Test of the Social Influence Model of Technology Use.Communication research, 18(4), 487-523.
Seufert, A., Von Krogh, G., & Bach, A. (1999). Towards knowledge networking. Journal of knowledge management, 3(3), 180-190.
Shirky, C. (2011). The political power of social media: Technology, the public sphere, and political change. Foreign affairs, 1(1), 28-41.
Steinfield, C., Ellison, N. B., & Lampe, C. (2008). Social capital, self-esteem, and use of Online social network sites: A longitudinal analysis. Journal of Applied Developmental Psychology, 29(6), 434-445.
Stocks, J. T., & Freddolino, P. P. (1999). Evaluation of a world wide web-based graduate social work research methods course. Computers in Human Services, 15 (2), 51-69.
Tavakol, M., & Dennick, R. (2011). Making sense of Cronbach’s alpha. International journal of medical education, 2(1), 53.
Valenzuela, S., Park, N., & Kee, K. F. (2009). Is there social capital in a social network site?: Facebook use and college students’ life satisfaction, trust, and participation1. Journal of Computer‐Mediated Communication, 14(4), 875-901.
Urry, J. (2003). Social networks, travel and talk1.The British journal of sociology, 54(2), 155-175.
Warschauer, M. (1997). Computer‐mediated collaborative learning: Theory and practice. The Modern Language Journal, 81(4), 470-481.
Zhang, W., Johnson, T. J., Seltzer, T., & Bichard, S. L. (2009). The revolution will be networked: The influence of social networking sites on political attitudes and behavior. Social Science Computer Review, 1(1), 1-25
Footnotes
1 – Indicates that 30 items were factored into the statistic for analysis were because the respondents did not answer the questions.