Introduction
The British American Tobacco PLC is the second largest international tobacco holding in the world. The company has pride in trading tobacco in more than 180 markets worldwide, while moving over 300 brands in the market. The BAT Company is committed to the manufacturing and processing of tobacco in more than 66 nations; it enjoys a 15% global market share. The Company address has its origin from a compromise between the two rival tobacco manufacturers: American and British.
The company official registration dates back to 1902 in London the capital city of the UK. After the acquisition of the recipes and trademarks of both originating companies, the company began its tobacco processing operations fully incorporated. Nevertheless, BAT resumed and preserved the international business engaging in the overseas production activities. Although the first decade after incorporation was difficult for the company, it later anchored the business excellence style. In 1911, the company joined the London stock exchange. The business environment to the company looked auspicious after American tobacco canceled its covenants (British American Tobacco, 2010). Afterward, British American Tobacco discovered local sources of raw materials, which gradually provided a friendly workplace to the company. With the presence of a business-friendly environment, the company enjoyed tremendous growth both in local and international markets. However, after the end of the Soviet Union’s domination of the nations in Eastern Europe in 1989-1990, the tobacco markets were more promising. BAT gained ground and withstood a chance to move its numerous non-tobacco properties. Two years later, BAT continued disposing of non-tobacco properties and acquiring tobacco properties throughout the world. However, like in a normal business setting, where challenges such as political unrest, economic hardship, socio-cultural, technological advance, competitors, etc prevail, BAT was not exceptional. All these challenging factors persisted in her business context. The organization’s capital structure is one of the most relevant and important decisions management takes, to effectively implement because it influences everything from the firm’s risk profile to the ratios such as return on equity and interest coverage. It is worth noting that financial analysis is crucial, as it is the firm’s primary source in accomplishing goals and service delivery.
BAT faces everlasting and challenging competition from other tobacco processor companies like Philip Morris, Imperial British Tobacco group, Japan Tobacco Company among several unlisted. Though these companies pose unmatched competition, BAT still conquers its premier style in the industry. The close and stiff competition comes from its old days’ competitor the Imperial British Tobacco group in UK markets (Tamari 1978). The Imperial British Tobacco Company presents undoubted competition in the tobacco industry. Hence, this forces BAT to pay great attention to the business environment that revolves around its operation. This analytical report shall compare the performance of BAT against its immediate competitor, Imperial tobacco while measuring them against the industry average. This will help gain more insight into the general current and future position of BAT.
Key Focuses
According to the chairperson speech delivered in 2008, the company focuses on many important issues that will see BAT rise high in the sky. So far, the company focuses mainly on how growth and productivity strategies are performing. From the recent past, the company has strategically focused on these two main issues, and in return, it has achieved much. These involve nurturing the talent and ensuring that the company is a great place. BAT has focused on diversification to ensure it continues to embrace customers through services delivery.
Financial analysis for BAT
Analysis of the financial ratios
According to Bragg (2007), the firm attains successful performance by assessing its efficiency. It means that non-financial ratios cannot measure the efficiency of firms. This calls for the application of measurements capable of revealing a firm’s efficiency through ratios such as return on assets and inventory turnover (Walton, 2000). When the efficiency of a firm is established, stakeholders and potential investors gain an insight into how a firm manages its resources in the generation of profits.
Current ratios
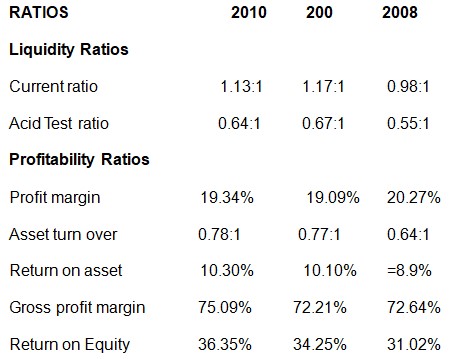
The firm can demonstrate its commitment towards maintaining the best performance by assessing the number of assets it holds. This can be through the assertion of the current ratio. The current ratio serves as a test of a company’s financial strength and relative efficiency. BAT current ratios are systematically showing an upward improvement as we see from the calculations. In 2008, the company recorded 0.98 :1 of current ratio compared to 1.17:1 in 2009, which was slightly higher than the previous year. This shows that the company recorded a good result in the current ratio is 2009.
The company tried to manage its current ratio by recording a bit lower figure in 2010 compared to 2009 but much better than that of 2008. In 2010, the company recorded 1.13: 1 in the current ratio, which was slightly lower than the 2009 figure of 1.172 but above the 2008 figure of 0.98. This shows that the company is trying to manage a positive trend of its current ratio though not steady. However, the analysis shows that BAT is in a position to maintain its liquidity with an improvement of about 0.98:1 to 1.13:1. This indicates the company’s position or the ability to convert its non-cash assets to cash assets.
Asset management
The asset turnover financial ratio assists in the calculation for each dollar of the asset a company owns. It is significant in the provision into a measure of a company’s efficiency in using its assets (Steffy et al., 1974). The BAT Company shows a positive trend in asset management. The company demonstrates a steady upward move in asset management; it can be seen for three years (from 2008-2010). The company consistently improved from a lower record of 0.64:1 in 2008 to 0.77:1 and 0.78:1 in 2009 and 2010 respectively. This trend proves that the company’s assets are properly managed, which is a good indicator of a growing company. Its high asset turnover in both years indicates that British American Tobacco’s asset management is perfect since little asset resources have ensured high net sales (Bragg 2007). The return on assets also reports shows a positive trend. In 2008, the return on assets was 8.9% some percentage lower to 2009, which was at 10.10%.
The company maintained that an upward trend by recording a higher percentage in 2010, which was at 10.30%. This significantly shows that BAT effectively and efficiently manages its assets. A perfectly maintained high asset turnover in respective years is a proper indication that BAT’s asset management is excellent. The profit margin of the company, though not consistent, indicates the realization of profits in an up-down move (Steffy et al., 1974).
Receivable turnover
The receivable turnover ratio is a very useful financial tool. It enables or assists when analyzing a business or a stock. It is worth noting that the company‘s rate of collection of its accounts receivables is very important. When the company collects her dues in time, it stands a chance of carrying out several tasks that may delay late collection.
Within the period (2008-2010), BAT has shown the utilization of this reasonable concept. Through empirical evidence that shows it is receivable turnover is properly accounted. The company’s receivable turnover attains a positive trend, and it practically complies with the receivable turnover rules (Richard, 2007).
Receivable turnover= net sales/average accounts receivable.
Return on equity (ROE) Return on receivables = Total Net Sales
Accounts Receivable
For Year 2010
Net sales=14,883.0
Account receivable=2,482.0
=14,883.0/2,482.0
= 5.996=5.6
For 2009
Net sales=14,208.0
Account receivable=2,441.0
=14,208.0/2,441.0
=5.82
For the year 2008
Net sales=12,122.
Account receivable=2,532.0
=12,122/2,532.0=4.787
The return on equity is one of the most useful profitability metrics. The company can obtain the amount of profit it earned in comparison to the total amount of shareholders equity through the calculation of (ROE). Shareholders equity is the margin obtained when you subtract total liabilities from total assets. If a business has a high return on equity, is more likely to generate cash internally (McLaughlin, 2009). The Company’s successful performance occurs when the rate on equity is higher compared to its industry. In such a business onset, the company is contemporarily termed as successful.
Return on equity= net profit/average shareholder equity.
Return on equity=2879/7921=36.35% in 2010.
=2713/7921=34.25% in 2009
=2457/7921=31.02% in 2008
If we examine deeply this kind of trend that BAT is trying to put across, then we can simply term it a positive indication placing the company in a better position.
A good gauge or indicator for a profit-making company shows the amount of the long-term debt is decreasing repeatedly in the balance sheet while revenue shoots up (Richard, 2007). The long-term debt ratio is the value of the dollar a firm owes and no plans for early payment. The performance improvements occur when the debt ratio decline while the cash is. The company victor profit when a business earns a higher rate of return than the interest rate at which it borrows (McLaughlin, 2009).
This ratio is significantly important since it measures how much money a company should borrow safely over a long period. It is worth noting, that BAT’s debt Ratio Company is steadily decreasing while the cash ratio is increasing (British American Tobacco, 2010). This is a growth-oriented company indicator. In the end, the company will be in a better position to compete favorably with its immediate or closer competitors both locally and internationally. Effective and efficient management of the debt on equity ratio as a financial tool occupies a larger space in organizational mindset.
Inventory Turnover
Inventory turnover demonstrates an excellent method for delivering the actual company’s working capital. When accounting for the period your customers or business partners take to it is more reasonable to utilize this concept. It is the most applicable ratio when measuring the number of times the inventory is in use during a measurement period. Inventory requires close track to ensure that a large amount of cash is in safe ventures or in assets that are not difficult to liquidate in short order. A low rate of inventory turnover shows either that a company has invested much in purchases of goods.
Stock turnover ratio= net sales/average inventory
For the year 2010
Net sales=14,883.0
=14,883.0/3348.66=4.44
Average inventory=3348.66
For 2009
Net sales=14,208.0
Average inventory=3348.66
=14,208.0/3348.66=4.24
For 2008
Net sales=12,122.
=12,122/3348.66=3.61
Average inventory=3348.66
Gross profit margin
The underlying fundamental requirement of a business is profit-making. Gross profit equals net profit inclusive of expenses. When company proceedings exceed the ultimate costs with a great percentage, the company, in turn, receives huge net profit. In a business context, the firm that withholds a large share stands a chance to outsmart its rivals. Most of the investors prefer to pay more businesses to companies with an excellent reputation in efficiency rating than those that have a low-efficiency rating.
The formula for calculating gross profit margin ratio is:
Gross profit margin ratio= gross profit/ total revenue
In 2010, the company recorded a gross profit margin of 75.09% while in 2009, it boasted a gross profit margin of 72.22%. This satisfies that the company gross profit margin is taking a correct direction, which will provide a platform for more investors to pay the company more businesses. The gross profit margin is very significant since it gives the investors morale of doing the business with the company.
Comparative Analysis of BAT and its immediate Competitor
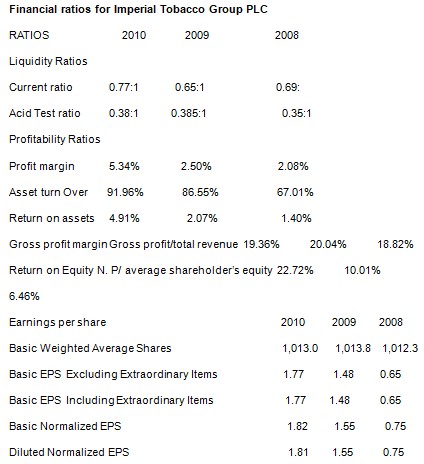
The current business environment is in a state of metamorphosis with contemporary issues such as stiff competition never-ending. The setting continues to be dynamic with challenges ever absent and BAT is no exception in this business environment. The immediate competitor of BAT Company in the UK tobacco industry is Imperial Tobacco Group PLC. The Imperial Tobacco Group PLC is a tobacco-processing company with UK originality. It is a list on the London stock exchange with a small range down their archrival British American Tobacco in terms of share rating. The Imperial tobacco group plc sells its product in both local and on the international scene. Before presenting the comparative analysis between these two giants, it is quite satisfying and reasonable to first look at the financial ratio analysis of the Imperial tobacco group (Vandyck, 2006).
Current ratio
The current ratio as a financial tool is significantly important in measuring the company’s strength and relative effectiveness. A company with a relatively high percentage of current ratio presents a recommendable picture of a -strong and efficient company compared to its competitors. Between the two companies, ample evidence shows that BAT is in a good position than its immediate competitor in the same industry (British-American Tobacco, 2010).
Profitability of the company
Profitability ratios carry more weight in measuring the performance of the company. Profitability ratios are very appropriate tools regarding, reinventing and remolding the financial position of a firm. They provide resourceful information to both the shareholders and the external business partners such as the investors and the suppliers without putting aside the customers. These sufficient gauging tools when effectively utilized correct any alteration that may pin down the business.
Company with a high rate of efficiency competes favorably with their immediate rivals in the prevailing business circle. With the two companies, it is simple to note that BAT has boasted a high gross profit margin than its closest competitor. In the year 2010 (Msnmoney.com, 2011), BAT had a gross profit margin of 75.09% while the Imperial tobacco group had 19.36%.In 2009, BAT still led with a gross profit margin of 72.21% while the competitor recorded a mark of 20.04% (British-American Tobacco, 2010). This automatically implies that BAT is more efficient than its close competitor is. Investors will find it more rational to do business with BAT than with Imperial Tobacco Group (Colin, 2011).
Return on equity (ROE).
Return on Equity is of the most important profitability metrics. It reveals the amount of profit a company earned in comparison to the total amount of shareholders’ equity. Shareholders’ equity is equal to total assets minus the total liability. If a business has a high return on equity, it is more likely to be capable of generating cash internally. BAT Return on equity is a bit high compared with Imperial Tobacco Group.
Conclusion
The British-American Tobacco Company, though facing some environmental, political, and economic challenges, the company is a good player in benefiting the shareholders and community at large. The company’s positive indications from a financial perspective are a sign of a growth-oriented firm with future hopes (Michael et al., 2008). The company is a very good motivator to shareholders and the external business environment in reinvesting and remolding of the business. On the other hand, quality of management, performance of a firm relative to industry metrics, and expectations of future performance. In reviewing the performance of a firm, it is imperative to examine its earning ability (Helfert, 2001). It means that absolute information is the most appropriate in establishing the position of a firm relative to the industry and projected results (Wahlen et al, 2010).
Recommendations
The economy and business settings in the present environment are different from those of a decade ago. As the paradigms have changed, the financial tools for measuring performance have also changed (Colin, 2011). To achieve this process, financial analysts find the use of financial ratios the best in telling the inner financial truth of financial statements. I recommend during the assessment of business performance; the financial ratio tools are significantly important and must be utilized adequately to ensure they provide the true picture of the business. I recommend the BAT managers continue with their managerial tactics and acquire more skills that drive success in the company (Michael et al., 2008).
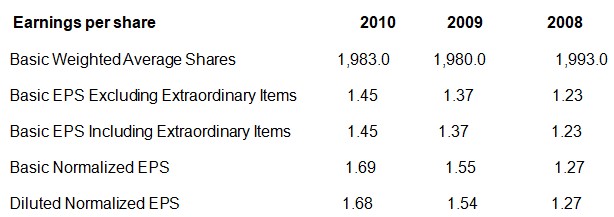
The financial tools’ employed in the analysis revealed that the business performance conforms to the acceptable pace of sound organization. Undoubted management practice different success style that qualifies for an echo. I recommend them to persist in disposing of that management style in line with the changing business setting. I also recommend the management revise its earnings per share. This is important since the company‘s profit is high, but the earning per share is low when you compare with it its immediate competitor. In the end, the shareholders will have that pride and will be committed to doing business with the company.
Appendix
Income Statement
Source: sMsnmoney.com (2011)
Balance sheet
Source: Msnmoney.com (2011)
Appendix 2
Balance Sheet for Imperial Tobacco Group Plc
Income Statement
References
Bragg, S, M., 2007. Financial analysis: a controller’s guide. New York: John Wiley and Sons.
British American Tobacco., 2010. Annual Reports. Web.
Colin, B., 2011. Practical Financial Management. London: Kogan page limited.
Colin, B., 2011. The 30 Day MBA in Business Finance, Your Fast Track Guide to Business Success. London: kogan page limited.
Helfert, E.A., 2001. Financial analysis, tools and techniques: a guide for managers. New York: McGraw-Hill Professional.
McLaughlin, A.T., 2009. Streetsmart Financial Basics for Nonprofit Managers, New York: John Wiley and Sons.
Michael, C.E et al., 2008. Corporate Finance: A Focused Approach. New York: Cengage Learning.
Msnmoney.com., 2011. British American Tobacco Co Plc. Web.
Richard, B., 2007. Financial ratios: how to use financial ratios to maximize value and success for your business, New York: Elsevier.
Steffy, W. et al., 1974. Financial ratio analysis: an effective management tool, Industrial Development Division, Institute of Science and Technology, University of Michigan.
Tamari, M., 1978. Financial ratios: analysis and prediction. Indiana University: Indiana University press.
Vandyck, C., 2006. Financial Ratio Analysis, New York: Trafford Publishing.