Abstract
The present study is dedicated to the investigation of the global market of mergers and acquisitions as a new form of corporate finance and restructuring of companies in the attempt to gain financial leverage and to enter new markets. Upon the review of global tendencies in M&A from the second part of the 20th century, particular attention is paid to American and British M&A tendencies. The focus of M&A consideration is made on mergers and acquisitions financed with the help of syndicated loans. The sample taken for consideration is the 1999 acquisition of Mannesmann AG, the German-based telecommunications giant, by a smaller company Vodafone, and the 2006 acquisition of Alliance Boots (Great Britain) by the American-based private equity investment company.
The main focus of the study is on the assessment of the comprehensive regulatory and non-regulatory environment of the acquisitions, ratios speaking about the profitability of both bidders in the short and long run, as well as peculiarities of loan syndication offered to both bidders for the completion of the deal. The work hypothesizes that the companies engaged in acquisitions usually show negative performance results in the first two years after the acquisition; it is proven by the examples of two companies described in the present work. A set of relevant conclusions about the whole scope of factors influencing bidders’ performance is made from regression analysis, ratio analysis, and evaluation of the regulatory environment of the deal.
Introduction
Background of the Research
Merger and Acquisition activity is continuously changing the corporate landscape internationally. Contemporarily, there is a considerable amount of academic literature related to international M&A activity in general, the financial structure and the post- deal performance. Nevertheless, the amount of academic research (particularly empirical evidence) on Mergers and Acquisitions in Great Britain and the USA context is rather limited. As far as the researcher is aware, the issue of loan syndication in M&As has not been subject to academic research at all, within an international and national context. Hence, this proposal will provide a justification for conducting research into this area and fill the currently existing gap.
M&A are fairly considered the most important business segment for investment bankers after management of public affairs. M&A contributed to a substantial portion of the bottom line of banks dealing with investment, sometimes even comprising the largest revenue stream for them (Subramanyam, 2008). Traditionally, Great Britain and the USA have been the major grounds for M&A deals that started in 1980s with the introduction of such investment tools as junk bonds and leveraged buyouts (LBOs), with the further increase of the M&A market together with the growth of capital flows globally, reaching $3.5 trillion by the verge of centuries (Subramanyam, 2008).
Understanding the reasons that drive the companies into M&A activity is of key importance to grasping the sense of the whole M&A market, realizing the whole image of M&A deals, their purposes and outcomes. There are different approaches to the justification of M&A from the point of view of industrial activities and financial structure. Judging from the first point, M&A deals are conducted due to the desire to achieve or strengthen market power, or the search for efficiency gains (Cassiman & Colombo, 2006). From the financial point of view, M&A deals are called to correct internal inefficiencies, agency problems and capital market imperfections (Cassiman & Colombo, 2006). Both angles of M&A consideration seriously contribute to the M&A research that has reached its peak within the past decade.
Such intense attention to M&A activity is explained by several factors; first of all, the issues of national pride in the volumes of M&A deals is not the last factor affecting academic research conducted in the field. Secondly, the field concerns several sectors of economy that may alter the competitive position of the country in certain strategically important economic areas (Gregoriu & Renneboog, 2007). Finally, the M&A activity is a highly sensitive indicator for the economic situation in the country and can reveal some major trends evident in its economy. Thus, a thorough investigation of the contemporary M&A market has revealed several essential findings in the financial field. E.g., the current M&A cycle is driven by low interest rates; the profit recovery since the intense period of M&A activity of 2003 has finally occurred, leveling the figures in financial reports (Gregoriou & Renneboog, 2007). This factor of acquired prosperity drives the companies on the path of further acquisitions. The second factor influencing the current M&A activity is the cheap debt available nowadays; private equity companies use this tool for removing companies from the stock market (Gregoriou & Renneboog, 2007).
There have been five waves of M&A activity registered in the world for more than two decades, with the last occurring at the end of the previous century, however the rise in M&A deals is also observed since 2003 (Kusstatscher & Cooper, 2005). At the end of the 20th century the USA was a unanimous leader in global M&A. The major rivalry in the M&A market at the end of 1990s, however, was observed between the USA and Great Britain , with the dramatic increase in European M&A in 1991 and 1998. 1990s were marked by British acquisitions in Japan and the USA where technology or market leaders were located, which surely possessed strategic importance for various sectors of industry there (Landau, 2001).
M&A have traditionally been recognized as a high-risk form of business involving collective annual financial investment due to the high percentage of merger cases when there is no rise in the financial return in the long run (Kusstatscher & Cooper, 2005). There is a set of financial factors affecting the success of M&A, including the both the financial synergy of a newly-created union and the human synergy of cultures, languages, traditions etc. (Kusstatscher & Cooper, 2005). Thus, research in post-merger performance has acquired high relevance and importance for the sake of drawing major guidelines for companies willing to undertake domestic and cross-border M&A to enable them to manage the whole realm of variables, hence securing their revenues and position in the market.
Purpose of the Study
The purpose of the present study is to concentrate on the global M&A activity on the national and international level and to find out the current M&A tendencies, in particular those connected with loan syndication. Since M&A deals are a widely-researched subject, it appears necessary to produce an integral combination of sources and data on all M&A-relevant issues to find out the reasons for companies engaging in M&A proceedings, to understand the key processes that occur in the process of a merger or an acquisition, and to identify the factors that provide substantial and adequate information about the success of an M&A deal. One more purpose is to analyze M&A deals in combination with their regulatory and non-regulatory environment to understand the whole realm of variables that affect the post-acquisition performance of the companies that undergo M&A and to evaluate the success of the undertaking in an objective, grounded way. A specific purpose on loan syndication is also pursued within the present study: since there is little literature on the role of syndicated loans acquisition in the growth of M&A activity, it is essential to investigate their true significance in the M&A process and to discuss the impact on post-acquisition performance as well.
Research Problems
There are several research problems that will be touched upon in the present study. The range of problems stipulated for the present research lies within the framework of the global M&A activity, with particular attention paid to the USA and Great Britain. Since the beginning of globalization and corporate integration between sectors in the domestic market, or building strategic corporate alliances beyond the borders of one country, the issue of M&A success has been the key problem for research and analysis. It is a positive global tendency that is tightly controlled by national and international regulatory provisions, preventing the creation of monopolies and trusts that would threaten social welfare, economic stability etc. However, the statistical data witnesses a surprisingly large percentage of M&A failures for different reasons. They are more often connected with managerial mistakes or the inability to align different cultures and traditions, but the financial aspect of the issue still cannot be neglected.
In connection with this fact, the second research problem that will be analyzed in the present paper is loan syndication as a powerful M&A tool that has enabled large-scale mergers and has created innovative possibilities for corporate unification, restructuring and activity. Alongside with multiple advantages syndicated loans offer to the borrowers, there are a large number of threats and risks that are undertaken by both the lending syndicate and the borrower, which is also a crucial variable in the M&A process. Fees charged for holding a syndicated loan, short and demanding timelines stipulated for the borrower etc. produce a serious impact on the post-acquisition performance of the company. Taking into account that post-acquisition performance is one of the key points of the present paper, it is obvious that syndicated loans also become the issue of prior attention here. The way syndicated loans are obtained, benefits and threats they provide as well as the rate of return and its impact on the company’s performance will be analyzed as a part of the research problems posed for the present dissertation.
Research Questions
The present research is focused on the following set of research questions that will be answered and analyzed:
- What is the financial structure of Mergers and Acquisitions in the USA and Great Britain?
- In how far does the financial structure impact upon the post- deal performance?
In addition to these two main questions, there are several secondary questions that will have to be answered to produce a more comprehensive view of the issue:
- What is the contemporary regulatory and social framework in which M&A activity in the USA and Great Britain is taking place?
- Do specific environmental non-regulatory characteristics produce any impact upon the M&A activity in general and the structure of financing in particular in Great Britain and the USA?
Objectives of the Study
The overall purpose of the dissertation is to conduct research into the area of Mergers and Acquisitions in the USA and Great Britain, the financial structure of the deal and the impact on post-deal performance. The objective underlying this research is to investigate the comprehensive structure of M&A deals and to analyze all M&A-related issues, especially the aspect of M&A syndications and their impact on the M&A activity on the whole. Tendencies in M&A activity and the adequate responses that the syndicated loan market provides for this activity also constitute a major part of the present analysis.
Scope of the Study
My research will be conducted in the field of Mergers and Acquisitions (M&A) in the USA and Great Britain, where the focus of research will be firstly the financial structure of M&As in the discussed countries and globally, and secondly the impact of financial structure on post deal performance. In addition, the role of loan syndication in M&A deals will be evaluated: it is an area of research which has been neglected internationally, probably due to a shortage of data, but still lacks adequate coverage up to date.
Furthermore, as mentioned previously, the role of loan syndication in American and British M&A activity will be evaluated, with the objective of evaluating the degree of syndicated loans in financing Mergers and Acquisitions. Despite this special focus, remaining ways of financing, referring to cash payment, classical bank lending or the issuance of bonds or equity will not be ignored. The inclusion of syndicated loans in relation to M&A provides a significant degree of originality to this work, as there is a considerable shortage of research conducted in this area. Hence, this work will provide at least two contributions; the first one is located in the area of M&A (particularly the financial structure and the potential impact upon post- deal performance) within the American and British context, and the second one will be the extension of the currently limited literature on loan syndication.
Literature Review
Mergers and Acquisitions
According to van Horne (1995), a merger is a combination of two corporations in which only one survives; the merged company goes out of existence and leaves its assets and liabilities to the acquiring corporation. In this context, a company might be acquired either by purchasing its assets or its common stock, where the buyer acquires the company paying either in cash or with its own stock. When an acquiring company purchases the stock of another company, the acquired company is combined into the acquiring company. However, Reed et al. (2007) note that one should not mix the essence of the term ‘merger’ and the actual operation of the blended company in future – “all mergers are statutory mergers, …occur as specific formal transactions in accordance with the laws” (p. 3). Sherman and Hart (2006) indicate that mergers and acquisitions constitute the inorganic type of corporate growth and mention that the terms ‘merger’ and ‘acquisition’ are usually used interchangeably, but in fact they need to be distinguished.
A merger is a combination of companies in which the assets of the selling firm are absorbed by the buying firm, but the former still retains its identity, whereas the acquisition process ends with the full absorption of the bought company (Ibid, p. 11). A strategic acquisition occurs when one company acquires another company as a part of its overall business strategy. This has to be distinguished from a financial acquisition, where a financial promoter is the acquirer. In this case, the motivation is to “ sell of assets, cut costs and operate whatever remains more efficiently than before, in the hope of producing value above what was paid.” (van Horne, 1995, p. 653) In case of financial acquisitions, the method of payment is cash, whereas in strategic acquisitions, the payment can be made in either cash or stock.
It goes without saying that the M&A scale growth should be justified by some reasonable factors, driving forces and theories that govern its intensity, direction, specificity etc.; findings in this field can be found in the works of Weston and Weaver (2004) and DePamphilis (2009). Weston and Weaver discuss the evolutionary driving forces shaping the economic landscape on the whole, including the acceleration of technological pace, reduction of communication and transportation costs etc. DePamphilis (2009) discusses the realm of M&A initiating theories that have been historically formed as a result of economic research. They are as follows:
- Operating synergy
- Financial synergy
- Diversification
- Strategic realignment
- Hubris (managerial pride)
- Buying undervalued assets
- Mismanagement
- Managerialism
- Tax considerations
- Market power
- Misvaluation (DePamphilis, 2009, p. 6).
Mergers and acquisitions have become a global tool for creating shareholder value. According to statistics provided by Clements (2000), ‘in 1999, reports Securities Data Publishing of Newark, New Jersey, nearly 33,000 companies worldwide announced $3.4 trillion worth of transactions – an all-time record that continues apace’ (p. xi).
In connection with such growing interest in M&A the significant portion of M&A-related research concerns its financial structure and procedures that are involved in an M&A deal. These implications are discussed by Hunt (2009) and Rezaee (2001) among others. Hunt (2009) pays much attention to details of concluding an M&A deal, including all details of valuation and financial statement analysis, analysis of M&A efficiency, discounted cash flow analysis, comparable company and transactions analysis, merger and leveraged buyout analysis etc. as the key components of the M&A financial structure that has to be observed for the successful M%A completion. Rezaee (2001) refers to the financial structure as a crucial element of the M&A process and states that it “depends on the size of the transaction and the nature and quality of both the target and acquirer organization” (p. 94). The author examines such financial structure elements as the estimated purchase price, the maximum amount of equity needed, the projected amount of cash flow needed and the method of financing the required cash flow, which may be debt or equity, fort instance (Ibid, p. 94).
The contemporary interest to M&A is enormous, which can be witnessed from a large body of research on M&A available up to date. Faccio and Masulis (2005, p. 1) state that “global merger and acquisition activity has grown dramatically over the last 10 years, bringing with it major changes in the organization and control of economic activity around the world.” According to Kirchmaier (2003), most German and British firms diversified actively through mergers and acquisitions in the 1970s and 1980s. Within the article of Faccio and Masulis (2005), the authors explored the determinants of mergers and acquisitions financing decisions using a large sample of European transactions over the period from 1997 to 2000. In addition, literature on mergers and acquisitions examines many various takeover characteristics, as for instance type of takeovers, style (friendly or hostile), method of payment (cash, stock or a combination of both), success factors contributing to the outcomes of M&A or post-merger performance (Gaughan, 2007).
The information on success factors of M&A deals can be found in the works of hundreds of economists, particularly the ones of Bruner (2004), Galpin and Herndon (2007) and Hitt et al. (2001). Galpin and Herndon (2007) favor the structured approach to dealing with M&A and offer some recommendations for its successful completion such as conducting due-diligence analyses in the financial and human capital-related areas, determining the required or desired degree of integration, speeding up decisions, gaining support and commitment of senior managers, clearly defining an approach to integration etc. Bruner (2004) provides some additional strategies for success in M&A including setting clear goals and benchmarks, getting an objective grasp of the M&A process despite the aggressiveness and emotion of the event, getting properly prepared for the M&A event itself, and adopting the best M&A practices widely accessible in various sources of information. Hitt et al. (2001) approach the topic from another angle, analyzing the most widely spread pitfalls that companies face in the process of M&A resulting in their failure afterwards. The authors emphasize such major threats as the reduction of innovation in the company actively involved in M&A processes, the risk of managerial hubris that prevents them from conducting adequate analysis of the target firm, the failure to overcome cultural, structural and organizational diversity (especially in cases of international M&A) etc.
The issue of post-acquisition performance also possesses high relevance for the present work because it is one of the aspects that will be considered in the empirical research part of the present dissertation. On considering the success factors that affect the M&A outcomes, one should also grasp the whole realm of methodologies and approaches to producing adequate assessment of post-acquisition performance and efficiency of the newly-established combination of companies. This topic is discussed in detail in the works of King et al. (2004), Pautler (2003), Agrawal and Jaffe (1999), da Silva Rosa et al. (2003) and Agrawal et al. (1992). Their findings make a significant contribution to understanding of the key factors and indicators governing understanding of post-acquisition outcomes.
King et al. (2004) applied meta-analysis methods to analyzing the post-acquisition performance of a company; the authors state that the conventional methods used to assess post-acquisition performance do not reveal adequate outcomes of the acquisition, and the role of unidentified moderators grows substantially. They suggest that “multiple measures of firm performance should be employed in post-acquisition performance research in order to better document the complete performance implications of M&A activity” (Ibid, p. 196).
Pautler (2003) evaluated the mergers’ success by means of interviews and surveys in 70 companies that conducted M&A to estimate the level of initial goals’ achievement, success perception by employees and executives etc. This evaluation was combined with the financial analysis aimed at finding out “whether the post-merger stock prices rose or fell relative to the pre-merger trend and/or relative to the industry average share price” (Pautler, 2003, p. 3). The author discovered that the executive surveys often contain the subjective information about the acquisition’s success, and revenue growth usually appears lower for both the target and the acquirer in the M&A process.
Agrawal and Jaffe (1999) and da Silva Rosa et al. (2003) support this idea, stating that the long-run performance of mergers and acquisitions is often negative, though their performance is positive. Generally, the idea of acquirer’s losses after the acquisition is a popular focus of researchers’ attention, but the direct connection between the two discussed phenomena is still not proved (Agrawal et al., 1992). Faccio et al. (2006) provide additional proofs for the fact of negative returns to acquirers – the researchers discovered the persistent tendency of lowered returns on both listed and unlisted targets in the European countries and the USA independent of any M&A characteristics investigated in the process. However, this data is not supported by banking M&A reports – they appear beneficial and profitable (Al-Sharkas et al., 2008).
Syndicated Loans
Compared to the literature on mergers and acquisitions, literature on loan syndication is rather limited (at least in terms of relevance for this work), despite the growing importance in international financing. Academic literature on loan syndication is provided by Lee et al (1996), Dennis and Mullineaux (2000), Eichengreen and Mody (2000), Gadanecz (2004), Thomas and Wang (2004), Schure et al (2005), Altunbas et al (2006) and some other authors whose contribution to the study of syndicated loans’ essence, development and role in the world of M&A is indisputable.
According to Gadanecz (2004, p. 1), syndicated loans are “ credits granted by a group of banks to a borrower, combining features of relationship lending and publicly traded debt.” Megginson and Smart (2005) define a syndicated loan as “a large-denomination loan arranged by a group (or syndicate) of commercial banks” (p. 534). The authors note that syndicated loans have increased dramatically in size, volume and import in the last 20 years. During the 1970 and 1980s syndicated loans were usually granted by governments to developing countries. Nowadays the loans granted for top-tier corporate borrowers are floating-rate credits, with very narrow spreads (10-75 basis points) over LIBOR (Ibid., p. 534). Stigum and Crescenzi (2007) state that syndicated loans are usually involved in the M&A deals when the sum of credit needed from a bank exceeds its legal lending limit, or in case the bank wants to diversify the risk. The authors find out from their study that the syndicated loans and volumes thereof are usually correlated with the country’s economic activity (Ibid., p. 247).
Price (1995) analyzes the existing types of syndicated loans that are usually involved in M&A deals. The types that come into the focus of his attention are as follows: traditional syndicated bank loans (with the floating rate), syndicated bank loans (with a fixed rate), revolving credit, standby facility, and multi-option facilities (MOF) (Ibid, p. 30). Madura (2006) focuses on a more detailed analysis of the procedures involved in syndicated loan acquisition, participants involved in the process and fees that the borrower incurs as a result of receiving a syndicated loan from lenders. According to his information, every participant of the syndicate participates in the lending, with the lead bank being responsible for negotiations with the borrower and organizing a group of banks for underwriting the loans. The syndicate is generally formed within six weeks. Borrowers incur additional fees such as front-end management fees that cover the cost of forming a syndicate, and commitment fees equaling from.25 to.50 percent charged annually on the unused portion of the granted loan (Ibid., p. 72). (2009) issued a detailed, in-depth analysis of syndicated loans in comparison with corporate bonds for The European Central Bank in which they assumed that syndicated loans lie somewhere between relationship loans and public debt, where the lead bank may have some form of relationship with the borrower – although this is less likely to be the case for banks participating in the syndicate at a more junior level (p. 9).
Since syndicated loans are a relatively new concept in finance, it is important to analyze the evolution of their position in the global banking sector and the changes that have recently occurred in the syndicated loan market due to particular economic changes in the world. In this context, Schure et al (2005, p. 1) state that “the market for syndicated loans is huge in 2003, banks extended close to USD 2 trillion in syndicated loans.” The authors further state that one of the motivations of banks to join a syndicate is the diversification of risk, as the risk of large investment projects is shared among the syndicate members. Le and Gasbarro (2008) provide substantial evidence in support of this opinion – the authors have completed a comprehensive review of the syndicated loan market from 1980 to 2007 and have found out that global syndicated lending has reached US$ 4.5 trillions in 2007; this statistics proves the stable upward tendency in syndicated loans’ popularity on the global scale. The reason for such popularity of syndicated loans is found in the study of Miller (2006) – the author states that the large leveraged buyout (LBO) was the ‘ancestor’ of syndicated loans and was largely applied in 1980s, but syndicated loans appeared cheaper to bear and more efficient in administering than traditional bilateral and individual credit lines.
Lajoux and Weston (1999) investigated the role of syndicated loans in mergers and acquisitions and found out that it increased substantially during the late 1990s. This way, they inform that in 1997 the value of syndicated loans in the USA was $1.1 trillion, the $172.4 billion of which were granted for financing mergers and acquisitions (Ibid., p. 6). However, the information from Thompson Financial Publishing, Vol. 15, no. 2 (2002) about the temporary decline in M&A syndications is supported by a great body of research: there are two waves of M&A rise detected in the 21st century; they occurred in 2000 and 2005, with the volumes being much lower in the period between those two years. Thus, the statistics shows that only $210 billion, i.e. 18% of all issued syndicated loans, were applied to M&A deals in the USA in 2001 (Ibid., p. 1).
Smith and Walter (2003) support these findings by their research; the economists conducted a statistical analysis of syndicated loans development and popularity growth at the end of the past century and have made a conclusion that M&A syndications had took place in the latter part of 1980s. The authors also found out that in 2000 and 2001 58.4% of syndicated loans were booked by European banks, while the percentage of North American banks’ bookings was only 7.4% (Ibid., 104). Nonetheless, they also note that North American banks lead-managed about 70% of all syndicated loans worldwide in those years, which speaks very eloquently about the distribution of financial responsibilities and capacities at the beginning of the 21st century (Ibid., 104).
Surely, there is the dynamic response to the needs of business entities for syndicated loans in the modern period of time, so continuous attempts for syndicated loans’ acquisition and handling improvements are made. A clear example of such activity can be given on the Depository Trust and Clearing Corporation (DTCC) that published a manual on syndicated loans in 2008 and discussed the future applications and strategies in moving forward in the syndicated loan market. The attempts of DTCC are mostly aimed at processing challenges and market processes that pose major complications in the syndication-related field. Measures planned by the DTCC to ensure completion of the discussed tasks are as follows: to improve the primary and secondary loan-closing process; to leverage the Deriv/SERV model by developing a Loan Warehouse containing real-time definiti9ve loan balances; the initiation of pre-reconciled cash movements of scheduled payment events and net settlement etc. (p. 9).
Altunbas et al (2006, p. 27) identify the role of syndicated loans in corporate acquisitions, arguing that “in the 1990s, prime borrowers became cognizant of the rapidly developing “new style” syndication market, which seemed to offer the possibility of raising larger amounts at attractive terms in a tight time frame; this feature of loan syndication made them a powerful financial tool for strategic corporate transactions such as mergers and acquisitions.” Rhodes (2006) also indicates the key role of syndicated loans in contemporary financing of M&A, stating that the acquisition finance field if one of the most dynamic and exciting areas that offers multiple benefits for companies wishing to undertake M&A because of the size, speed and secrecy of the deal.
Notwithstanding the fact that syndicated loans appear so appealing for M&A participants, they nevertheless conceal numerous challenges that may pose serious problems and risks for the borrower, e.g. the demanding timeframes, the large risk positions and integration with other capital markets instruments (ibid., p. 156). The Loan Market Association (n.d.) expands the existing literature on syndicated loans and informs about possible benefits that a borrower is likely to achieve from engaging in syndications, stating that
A syndicated loan agreement simplifies the borrowing process as the borrower uses one agreement covering the whole group of banks and different types of facility rather than entering into a series of separate bilateral loans, each with different terms and conditions (p. 1).
The author analyzes the added value that syndicated loans can bring to the financial market transactions, M&A deals as well. He also states that the syndicated loan markets are the key contributors to the growth of M&A activity due to the additional financial opportunities they give to borrowers (Ibid., p. 156). This viewpoint is supported by the findings of Megginson (2005) who states that the syndicated loans market has come to play a vital “capital market” role of providing large-scale, rapid financing for capital investments in 1990s and on. The conclusion the author makes from the financing sector analysis is that conventional “relationship banking” is going to lose its position in the global capital market, whereas the large-scale syndicated loan market is gaining force and is going to rise because of the innovative financial opportunities it may give to the borrowers (ibid., p. 237).
Despite the fact that the authors concentrate on the US market, they also indicate that merger and acquisition activity is increasing in Europe since the mid 1990s, creating further demand for syndicated loans. There are certain drawbacks, challenges and risks that accompany syndications, but the growing demand for them certifies the acceptability thereof. The popularity of syndicated loans and intense activity on their improvement, rationalization etc. are continuously taking place, which proves the reciprocal relationships between lenders and borrowers, the mutual interest in the syndicated loan market growth and the irrelevance of traditional bank-lender relations in the context of the innovative, globalized corporate conditions of the 21st century.
M&A market in the USA and Great Britain
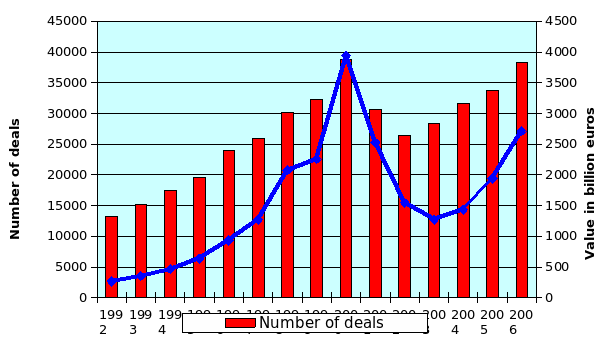
Mergers and Acquisitions (M&A) as a type of business restructuring correspond to the innovative needs of the 21st century – “transcontinental, global and frontier-less corporate competition, production and communication systems” are the overall necessity of every modern country without exception (Picot, 2002, p. 3). The tempos of M&A growth globally are the chief evidence of demand for internationalization of business: in 2000 the number of acquisitions equaled 37.000 with the total value of $3.500 billion. The European M&A involvement has also been increasing throughout the last decade: in comparison with the 11.050 acquisitions in 1999 the number equaled 12.450 in 2000, with the total value of $1.510 billion (according to the Thompson Financial Data) (Picot, 2002, p. 3). The modern statistical information on mergers and acquisitions proves the hypothesis of growing M&A volumes and can be seen on Figure 1:
The most important observation is that mergers and acquisitions increasingly take place between countries, and not within them. According to Picot (2002), cross-border corporate M&A occupied about 85% of investment in 2000. The situation has not changed right now as well, and the USA and Great Britain are fairly considered leaders in the cross-border market together with Germany (Cartwright, Cartwright & Cooper, 2000). The major reason for this is their strong investor protection and less concentrated ownership structure (Renneboog, 2006). This fact is also justified by the tendency for M&A occurrence in industrialized countries (Picot, 2002).
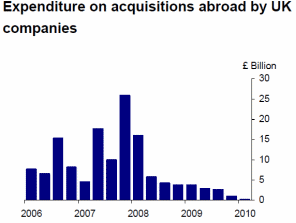
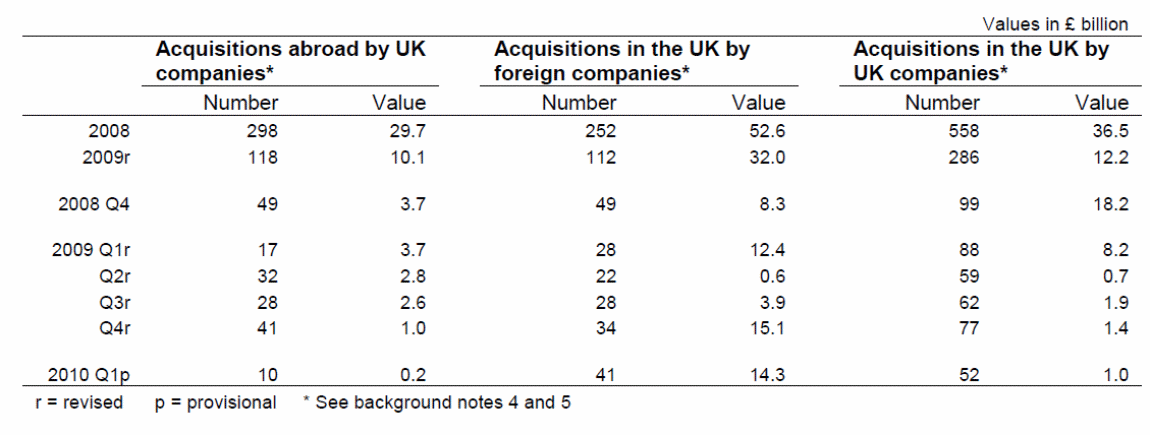
Great Britain became engaged in M&A activities in 1984 (Zotto & van Kranenburg, 2008). Since then the volumes of domestic M&A activities have risen enormously, taking into consideration the development of the British business; from 1978 to 1988 the value of domestic activities in the UK grew twentyfold, rising from £1,140 million to £22,123 million (Cartwright et al., 2000). Afterwards the 1990s’ recession reduced the M&A intensity, with its further growth in 1995 and on. The statistical data on expenditures on M&A at that period of time can be seen on Figures 2 and 3.
The US market of M&A is also a large-scale, intense organism – since the beginning of 1990s it has been going through the fifth wave of M&A rise that has seriously altered the global landscape of banking, finance and other sectors affected (Aldrich, 1999). In the past, the information about US mergers and acquisitions could be found in public announcements and covered only large, publicly held firms, which makes the M&A analysis of the previous decades complex:
For 1993, roughly 2,700 M&A were reported to Mergerstat, representing a rate of 69 per 100,000 active US corporations. Looking only at the set of corporations with $1 million or more in assets, the M&A rate was about 750 per 100,000 active corporations (Aldrich, 1999, p. 262).
Nonetheless, the situation changed largely due to the establishment of a new database that used the Longitudinal Establishment and Enterprise Microdata (LEEM) file; it was initiated by the US Bureau of the Census in 1990s and was aimed to track ownership and employment of all business locations and establishments with employees. The focus of LEEM attention was not spread on the companies’ sales or assets, but still it provided a much more comprehensive analysis and data on the M&A changes in the USA in the 1990s (Aldrich, 1999).
Due to the innovative tools of statistical analysis, recording and measurement it appeared that the US M&A activity grew substantially at the end of the 20th century, being 5 times greater for the period from 1995 to 2001 than any previous M&A boom in the United States (Bhabatosh, n.d.). the value of all mergers and acquisitions concluded in the USA from 1998 to 2000 comprises $4 trillion, which is more than the whole value of M&A deals for the 30 previous years combined (Ibid., p. 525). It is enough to consider the merger of America Online, Inc. with Time Warner that cost $106, the largest deal ever made in the field of M&A, to understand the scale of dealings of that period of time. The first decade of the 21st century is the continuation of previous tendencies. The statistics of recent M&A activities in the USA can be seen on Figure 4.
Figure 4. Current M&A Activity in the USA.
Source: Mergerstat, 2010.
Notwithstanding the fact that M&A are in general a positive trend in all countries without exception, including the USA and Great Britain, one should never forget that M&A dealings have always raised political and economic concerns. The reason for this is that some M&A may have strategic importance for certain countries or within a sector of economy of a particular country. Hence, national governments have regulatory bodies that oversee the domestic M&A activity with the purpose of preventing monopolies and trusts (Curry, 2000). Speaking about Great Britain where acquisitions are generally referred to as ‘takeovers’, a regulatory document titled “The City Code of Takeovers and Mergers” performs this function. In case the situation is problematic for resolution, the Monopolies and Mergers Commission (MCC) may intrude in its consideration (Curry, 2000).
There are some other regulatory documents as well that govern the M&A activity in Great Britain and are applicable under certain circumstances. If it comes to the consideration of the scheme of the company’s arrangement, one may turn to the Insolvency Act of 1986 (ss.110-111), the section on scheme of arrangement and reconstructions (Insolvency Act, 1986). Speaking about reconstruction only, the Companies Act of 2006, Parts 26 (ss.895-901) and Part 27 (special rules for public companies) may be highly helpful – this document discusses all relevant regulatory proceedings for arrangements, reconstructions, mergers and divisions of British companies, with s.979 concerning takeovers in particular (Companies Act, 2006). Finally, The Transfer of Undertakings (Protection of Employment) Regulations were enacted to ensure just working conditions for employees of the companies undergoing the M&A process (Terms and Conditions of Employment, 2006). It is also worth remembering that Great Britain is a member of the European Union, so it is also a part of a much wider regulatory space; thus, it has to subdue to the EU legislation on M&A activity as well.
Generally speaking, it is possible to assume that M&A in the USA and Great Britain have existed under completely different regulatory conditions. The USA has been experiencing the limitations of tough anti-trust laws, while Europe has been encouraging mergers in strategic sectors for the sake of creating “national champions” in particular sectors of economy (Temple & Peck, 2002). Historically, the US M&A field suffered from numerous restrictions of the Clayton Act, Sherman Act and Federal Trade Commission provisions (Antitrust law, n.d.). Only since 1977 economic analysis has become an indispensible part of assessing the efficiency and propriety of M&A in the USA. The tight anti-monopolistic and antitrust policy became much softer, though audacious federal cases against companies suspected of threatening sound competition in the field still continue emerging (e.g. the 1992 cases against AT&T, General Electric, Microsoft Corp. etc.) (Antitrust law, n.d.). At the present moment the major regulatory bodies that establish regulatory provisions for M&A activity in the USA are the Justice Department and the Fair Trade Commission (Temple & Peck, 2002).
Conceptual Framework and Methodology
Conceptual Framework
The conceptual framework of the current study is focused on a set of issues that comprise the major interest in the presently discussed scientific and business area. Logically, there is a clear need for a comprehensive structure that would link these concepts into a natural union and discriminate them comfortably in the process of research. The broadest concepts considered are Mergers and Acquisitions (M&A) and Syndicated Loans (SL). They occupy the central place in our framework because M&A activity is the focus of the present investigation – M&A reasons, trends and practical implications will be analyzed first of all in the theoretical aspect, drawing major conclusions from the overview of global M&A operations and then focusing on the peculiarities of M&A deals in the USA and Great Britain.
Hence, for the purpose of in-depth and comprehensive analysis of M&A in the whole scope of its implications, the present research relies heavily on the works of Gaughan (2007) who discusses the recent M&A trends, types of M&A existing nowadays and M&A financing, DePamphilis (2009) whose prime focus is on motivation for M&A and regulatory constraints existing in the field, and Lajoux et al. (2000) who discuss the intense interest towards M&A deals and issues of security that are currently involved in concluding M&A contracts. Much information from the works of Hitt et al. (2001) who discuss financing M&A in detail, Hunt (2009) studying deal valuation and methodology of M&A analysis, and Sherman and Hart (2006) dedicating their research to M&A-related due diligence proved very helpful in creating the integral conceptual framework for the present study.
The following concept building up our framework of research is loan syndication as a major tool for financing M&A that contributes to the formation of major trends and policies in the M&A field. The syndicated loan market has been expanding enormously within the past decade as an innovative method of investment banking, with the conventional methods of financing and traditional banking tools declining in importance. Syndicated loans open new possibilities in the field of M&A because they enable the companies undertaking a merger or an acquisition to obtain large-scale short-term loans seriously increasing their chance for concluding an M&A megadeal. However, there is reverse side of the SL medal as well: it is a high-risk loan because of the demanding timelines that usually has to be paid within five years; for this reason syndicated loans cause the majority of M&A failures due to their financial non-sustainability. Hence, a thorough analysis of the role of syndicated loans in the M&A market and their impact on the intensity of M&A deals, their success and post-deal performance of companies is crucial for the success of the present research.
There is little literature available on the role of syndicated loans in the M&A market because they are a relatively new concept in the investment banking and corporate finance fields. Consequently, the present study will apply the findings laid out in the works of Rhodes (2006) who investigated the role of syndicated loans in the acquisition finance, Smith and Walter (2003) whose focus was on the multifaceted relationships between loan syndication and acquisition, and Megginson (2005) who also defined the connection existing between M&A and the syndicated loan market. The studies of Stigum and Crescenzi (2007) who provided a comprehensive overview and definition of syndicated loans, Price (1995) who explored the existing typology of syndicated loans, parties playing a role in syndicated loans and steps in completing a syndicated loan acquisition constituted utmost importance for the present study as well. Some other findings of Gadanesz (2004) taking an active interest in the structure, development and implications of the syndicated loan market and of Altunbas (2006) who suggested a comprehensive schedule for analyzing the influence of syndicated loans on the post-acquisition performance in a company that went through the M&A process were successfully applied in the construction of the present conceptual framework for the research.
The stipulated framework of theoretical research will be further on applied to the case studies of the financial performance in such companies as Vodafone Group plc and KKR Financial Holdings LLC. The background of the M&A deals, the M&A process, its social, regulatory and economic environment will be analyzed in an integrated, unified way to produce the full, logical and continuous picture of the deals. The role of syndicated loan acquisition in the success of the present mergers will be discussed separately – this information will be derived from financial indicators of the company’s performance before and after the deal. Ratio analysis will serve as a comprehensive tool for financial analysis and assessment. A set of relevant conclusions summarizing the financial structure of M&A and the affect of loan syndication on post-acquisition performance will be produced in the concluding part of the work.
Research Design/Methodology
In the process of choosing the methodology tools such issues as efficiency in processing information and obtaining relevant data for analysis have been considered. The present research will be qualitative, with the usage of inductive methods for generation of general understanding of M&A procedures, the financial structure of chosen M&A cases and the role of loan syndication in the whole deal. Afterwards, the method of pre- and post-acquisition performance measurement will be applied in the M&A financial success evaluation, with the data synthesized and analyzed to determine the peculiarities and common strategies of M&A dealing in the USA and Great Britain.
Methodology of the present work involves undertaking several steps: the initial stage is conducting a literary review to collect the materials and gather the theoretical basis to continue further analysis. The existing M&A tactics, procedures and regulatory frameworks will be theoretically investigated to define their basic concepts and generate an innovative, integrated model that would combine the strong sides of all existing methods of financial analysis of the company’s performance and would eliminate their drawbacks. The second stage will be practical analysis of the chosen companies in the USA and Great Britain that went through an M&A deal, and their further comparison with the purpose of producing a set of suggestions on what tendencies are observed in both discussed countries and how syndicated loan acquisition influences the post-acquisition performance there.
Separate attention should be paid to the loan syndication indicators analyzed within the framework of the present study. Alongside with the conventional ratios allowing to assess the company’s liquidity, profitability and short-term stability, there are long-term solvency measures that allow to make conclusions about how well the company copes with the syndicated loan it borrowed for an acquisition. Thus, such long-term solvency measures have been chosen for analysis as the interest coverage ratio, the debt and debt/equity ratios and EBIT. Unfortunately, these are the only ratios available from the current financial reports of the companies, but they allow making a clear image of the company’s success in a logical and comprehensive manner.
Data Collection Methods
The empirical nature of this dissertation will imply that not only academic literature will be considered, but also a set of data sources required to conduct the empirical analysis. Besides data related to listed British and American companies, the additional required datasets will be determined by the financing structure of British and American Mergers and Acquisitions. The following data requirements and source can be identified at the moment: the collection of data from various sources will be necessary to conduct the regression analysis, the empirical part of this research project. In this context, the initial step would be the collection of data and probably the merging of datasets into a single one that allows the usage of statistical software packages. Secondly, the financing structure of the Mergers and Acquisitions will have to be evaluated in relation to composition, which may, as mentioned previously, include cash, syndicated loans, bank loans or the issuance of bonds or equity. The subsequent part would then be the evaluation of the pre- and post merger performance.
Methods of Data Analysis
The methodology which might be applied in this context is derived from Altunbas and Ibánez (2004), who applied the approach originally used by Ramaswamy (1997). The methodology is a bit altered because of the mentioned authors’ using a large sample of banks, thus the method will be identification of key financial indicators of both the bidder and the target, with the proper ratio analysis of bidders two years before and after the acquisition. The results obtained from the analysis have to be seen contextually to the academic literature, which will not only provide information on previous related work, but will also provide information concerning the political, social and regulatory environment in which the research is going to take place.
Limitations of Research Methodology
The presently designed methodology has a number of limitations that should be thoroughly considered when assessing the results of the study. Firstly, the focus of the present research on cross-border M&A activity of the discussed countries is considered only in the theoretical dimension, which deprives research of comprehensiveness; the mergers chosen for empirical research were conducted between domestic companies, thus making a considerable contribution to understanding the domestic M&A performance indicators. As it comes from a substantial body of research on M&A, cross-border and domestic M&A differ greatly in many aspects, so the comparison between these two fields is impossible if derived only from the results of the present study.
Secondly, the companies chosen for the present analysis represent one strategic orientation, which deprives research of heterogeneity and analysis of the cases when companies had to achieve a more complicated synergy. Finally, the third limitation of the present research is the number of mergers chosen for analysis – investigating the pre-merger and post-merger financial performance of only one newly-built company in the USA and Great Britain does not allow the researcher to make generalizable conclusions that would be applicable to the whole sector or country. However, it is a relative limitation since the model of analysis and the overview of M&A financial structure, deep review of post-acquisition performance are only an attempt to introduce innovative, comprehensive tools for M&A analysis and to find innovative applications for findings of theorists in the M&A sphere.
Analysis of Vodafone/Mannesmann and KKR Holdings/Alliance Boots Acquisitions
KKR Acquisition of Alliance Boots – Regulatory and Non-Regulatory Environment
The consortium led by the private equity company Kohlberg Kravis Roberts (KKR) headquartered in New York initiated an acquisition deal with Great Britain-based Alliance Boots, the biggest UK drugstore chain in March 2007 (Alliance Boots Takeover Approved, 2007). This deal was a ‘mega’ private equity buy-out and the first time when the FTSE 100 company firm was bought by a private equity firm, with the main acquirers KKR and the Italian billionaire Stefano Pessina who at that time possessed 15% of Alliance Boots stock. The value of the deal constituted £11.1 billion (Alliance Boots Takeover Approved, 2007). The result was achieved only in the middle of 2007 when 96% shareholders backed the deal despite the considerable pension fears and KKR strategy doubts that surrounded the whole course of negotiations.
One more issue that caused close attention in the acquisition-related issue was the fierce rivalry for the bid between the KKR consortium with the Wellcome Trust medical research charity, UK private equity group Terra Firma and British bank HBOS. As soon as the Alliance Boots administration approved of the KKR offer of £10.6 billion, the Terra Firma bid for £10.8 billion came in April 2007. The issue was complicated by the concerns of trade unionists who considered the acquisition threatening to result in job cuts and closures. The employees were worried about their job security and pensions as they could not estimate the acquisition either as a growth strategy or as an asset-stripping one (Barbarians’ £10 bn Battle for Boots, 2007).
The roots for the pension debate were found in the disapproval of the head of Alliance Boots pensions fund stating that it was unfair to approve of the deal before any pension agreements were achieved with KKR. The reason for such anxiety was that Alliance Boots had one of the best-functioning pension schemes, the review of which revealed a possible £305 million deficit. With the proper regard of this fact, it was estimated that an additional £1 billion was needed from KKR to back the successful continuation of pension payments for Alliance Boots employees after the acquisition (Barbarians’ £10 bn Battle for Boots, 2007).
The acquisition process was also complicated with financial problems that occurred in the course of finding a syndicated loan to finance such a large-scale acquisition by KKR and Stefano Pessina. In July 2007 banks were struggling to find investors for the acquisition, which was seriously challenged by the situation in the stock market: “the iTraxx LevX Index of credit-default swaps on loans to 35 European companies dropped to as little as 94.75 today, the lowest since the index began traded” (Gutscher, 2007). The financial institutions were also attempting to syndicate the loan to a wider group of banks and money managers:
KKR’s banks are trying to attract investors to the Boots financing by using their own underwriting fees to discount the price on 1 billion pounds of second-lien loans, which rank after senior debt, to 96 percent of face value. KKR also increased the interest margin offered to 4.25 percentage points over benchmark the London interbank offered rates, 25 basis points more than initially proposed priced (Gutscher, 2007).
As soon as the acquisition was completed, it turned out that the bid was 40% higher than the initial one in March. The last bid was higher than the previous one by KKR and Pessina by 4.5%, and 2.2% higher than the last bid made by the Terra Firma group (KKR Wins Alliance Boots War for $22 million, 2007). The bid was, as it has already been mentioned, £11.1 billion ($22.07 million) (KKR’s Winning European Toehold, 2007). However, the M&A law specialists provided a reasonable explanation to the success of the KKR consortium in Alliance Boots acquisition. They reported that the acquisition occurred only due to the toehold that Pessina had in the company; it means that the initial share of the company that Pessina owned constituted 15% of shares, which was the immense help for the acquisition. Shortly before the moment of acquisition KKR acquired two large blocks of shares of Alliance Boots (the sum equaled 49.7 million shares at a price of 1,139 pence per share) (KKR ups Alliance Boots Ltd., 2007). As a result of these operations, the share of KKR-Pessina ownership constituted 25.6%.
According to the UK Companies Act, in case an acquirer wants to use the target’s assets as security for a leveraged purchase, he/she must own at least 75% of a target to squeeze-out the minority and initiate a ‘whitewash’ procedure (KKR’s Winning European Toehold, 2007). This law prevented the Terra Firma group from acquiring Alliance Boots – with KKR and Pessina having more than 25% of the target the aim became unachievable. This strategy was well-planned by KKR advisors Merrill Lynch and JP Morgan Chase (KKR’s Winning European Toehold, 2007). From the point of view of M&A regulatory environment this technique would never be implemented in the USA because of the intense SEC disapproval of toeholds and the anti-trust waiting period.
Notwithstanding the success of the long-awaited offer, KKR still experienced problems with Alliance Boots stock shortly after the acquisition as the plans to sell a certain portion of debt to investors to cover expenses for the acquisition failed in the stock market in September 2007. The failure could be explained by the unwillingness of panicked investors to buy high-risk loans (Kennedy, 2007):
Although KKR’s deal to acquire Boots is not in any doubt, its failure to syndicate the loans has sent shock-waves through the market. The three banks backing the deal had already been forced to cancel the syndication of the senior debt portion, amounting to well over £5 billion, after nervous investors balked at it. That left the banks with just two smaller portions of debt, which they had planned to sell at discounted rates to investors (Kennedy, 2007).
On analyzing the course of acquisition and the problems related to it, one should also pay attention to the official data on the acquisition justification and all legal information that was of prime interest for shareholders. In an official announcement of the planned acquisition, the administration of Alliance Boots explained the motivation for the agreement to buy the company out in the following way:
KKR and Stefano Pessina believe that the rapid structural changes in the pharmacy retail and wholesale markets in Europe will require an acceleration of Alliance Boots’ transition to a pharmacy-led health and beauty and services-oriented business. It is intended that this be carried out alongside the implementation of the management’s existing integration plan, while actively reviewing acquisition opportunities in Continental Europe and in emerging markets such as Asia and Latin America (Recommended Acquisition of Alliance Boots plc by AB Acquisitions Limited, 2007, p. 8).
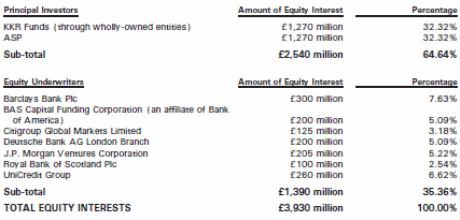
Thus, the company was guided by strategic considerations of the Alliance Boots long-term growth that could be achieved with the help of KKR and Pessina private ownership, experience they have in the field, access to substantial financial resources and help they may grant to the company in its becoming a global leader in healthcare services and beauty industry (Recommended Acquisition of Alliance Boots plc by AB Acquisitions Limited, 2007). According to the same document, the distribution of financing responsibilities looked as follows:
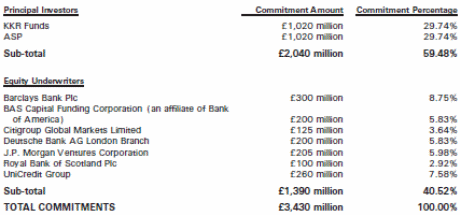
Despite the whole realm of problems KKR experienced in 2007, it became clear in 2009, at the 2-year anniversary after the acquisition that Alliance Boots shows highly positive results in performance. Revenues and earnings before interest, tax, depreciation and amortization (on a pro forma basis) raised by 15.5% and 11.3% respectively (to £20.5 billion and £1.2 billion) (Lewis, 2009). However, financial specialists found a proper explanation to such tendencies – the statistics looks so good because debt valuation is not included in it. In case the debt that comes from the acquisition expenditures is also considered, the whole picture will look as follows:
The estimated trading value of the group’s $2.5bn (€1.8bn) term loan B debt – a tranche of debt lower in priority to the senior debt in the capital structure – was 75% to 77% to face value, according to data provider Markit. Similarly, KKR Private Equity Investors, KKR’s Euronext-listed fund, has marked down its equity co-investment in Alliance Boots to nearly half its cost (Lewis, 2009).
Disregarding the threatening remarks about debt valuation and relativity of Alliance Boots success in the market after acquisition, it is possible to find the positive tendency continuing in 2010 indicators. The latest financial indicators published in May 2010 state that Alliance Boots profit rose 13% due to increased sales within the previous year. The operating profit of the company rose to $1.54 billion, net income increased to £608 million from £101 million observed last year (Shannon, 2007). The current financial forecasts are also highly positive for the company: the retailer is likely to continue growing. The revenue gains are a good indicator of long-term success – they increased by 8.9% in 2010. The net debt was substantially reduced, which is also a significant step forward (to 8.39 billion in 2010 from 9.03 billion in 2009). Thus, the acquisition can be assessed as a fully successful investment step. However, a more comprehensive and full image of financial characteristics of Alliance Boots and KKR can be seen at Figure X (it is necessary to take into consideration the exchange rate adjustment of figures in pounds sterling and US dollars at 1.426 corresponding to the 2006 estimate):
Figure 7. Financial Features of KKR and Alliance Boots – Pre- and Post-Merger Statistics.
Source: from annual reports of KKR Holdings and Alliance Boots.
The 1999 Hostile Acquisition of Mannesmann AG by Vodafone Group
One more example of an acquisition of tremendous scale and value is found in the 1999 acquisition of Mannesmann AG by Vodafone Group. As Hopner and Jackson (2001) state, this acquisition reflected the increasing influence of stock market capitalization in leveraging the takeovers, namely in the case when an industrial giant Mannesmann was bought by a small and relatively young company Vodafone. The case of Mannesmann happened earlier than the KKR and Alliance Boots story, so it illustrated the paradigmatic change in the German corporate governance (Hopner & Jackson, 2001).
In November 1999 Mannesmann rejected the 125 billion takeover bid offered by Vodafone because the administration of the company stated it failed to meet the value test and the value potential of Mannesmann (Mannesmann to step up Vodafone fight, 1999). The EU Commission also warned Vodafone that the offer was likely to be blocked in case the offer did not satisfy the European consumers. However, Vodafone was persistent in the takeover endeavor and offered 58.9646 Vodafone shares for each Mannesmann shares to its shareholders, which surely appeared attractive in the light of growing stock prices for Vodafone shares (Mannesmann FAQs, 2010). Upon a certain period of consideration of the bid and the agreement of about 96% of shareholders the EU antitrust regulators agreed to approve of the bid despite multiple protests from the side of Mannesmann’s board and employees, and accepted the legitimacy of the $173 billion acquisition (EU Clears Vodafone Deal, 2000). Klaus Esser, the CEO of Mannesmann, took desperate efforts to convince shareholders that the company itself was able to provide similarly profitable conditions for them, but he failed, and the takeover took place (Vodafone Takeover Battle Heats Up, 1999).
As a result of the acquisition, Vodafone created the largest telecommunications company of those days; nonetheless, it was the Continent’s first significant cross-border hostile transaction. It succeeded only because the majority of Mannesmann shares were owned by institutional investors outside Germany who waited for the short-term profit but did not take a long-term insight into the destiny of the company. Thus, the $190 billion offer could not help satisfying them as it promised overwhelming immediate profits for them. The price for Vodafone shares rose from $165 in July 1999 to $350 in February 2000, so the offer was generally profitable for all investors without exception (Wallace, 2000).
Some regulatory issues were considered in the course of approving of the acquisition because it overlapped certain EU legislative provisions on competition and monopoly. In general, the regulatory framework of the deal looked as follows:
European regulation favored convergence, the ability for mobile phone operators to offer the same voice and data services as fixed line operators, allowing for direct competition between the two. Direct competition was a difficult issue facing mobile phone operators because they would undoubtedly have to interact with the existing fixed line operators and agree to their terms in order to provide service to their customers (Huvard et al., 2006, p. 5).
Facing such a challenge in the foreign market, Vodafone surely had particular strengths and weaknesses pertaining to the possible outcome of the acquisition of Mannesmann. The company had experience and knowledge in the mobile phone business, already had a significant share in several foreign markets and could take a multi-market and multi-structure outlook on mobile consumers in different countries, and possesses the strong ability to manage change (especially the one accompanying an acquisition), research and development potential and market power that enabled it to conduct operations of such scale (Huvard et al., 2004). However, at the same time it is necessary to admit that Vodafone’s managerial resources were rather restrained due to its rapid growth and aggressive acquisition policy, being weak in the European market as well. This complex of factors shaped the image of acquisition and all problematic and successful aspects connected with it (Huvard et al., 2004).
Notwithstanding a rather weak position in the ‘alien’ market, the administration of Vodafone still could not help realizing the indisputable benefits that the successful deal with Mannesmann could provide. Acquiring Mannesmann, Vodafone also acquired the third operator Orange that increased its market share in the UK to 53,6%; this acquisition also provided Vodafone’s entry to the Belgian market through the KPN Orange division also owned by Mannesmann (Case No COMP/M.1795 – Vodafone AirTouch/Mannesmann, 2000). In addition, Vodafone would hold controlling interests in eight countries of the EU in case of a successful deal completion (Austria, Germany, Greece, Italy, the Netherlands, Portugal, Sweden and the UK) (Case No COMP/M.1795 – Vodafone AirTouch/Mannesmann, 2000). Besides the numerous subsidiaries in Germany and Italy, Vodafone was also able to increase its indirect holding in SFR (Vodafone Annual Report 2008). It is possible that state with full confidence that the position of Mannesmann in the domestic and international market was very sound. Figure X shows the key figures on Mannesmann influence in the market:
Figure 8. Basic Figures for Mannesmann AG (1998).
* The total number of employees in 1998 was 116,247, including other companies and Mannesmann administrative headquarters.
The acquisition offer was accepted, which was a great success for Vodafone, but the sum of the deal was too much for the company to handle – it required a large sum of money to finance the acquisition. Such a sum could not be lent by one bank, so the syndicate of 11 banks financed the acquisition, with a part of the sum financed in the bond markets (Coyle, 2002). Greenhill & Co. International LLP advised Vodafone in all financial issues concerning the acquisition and made a piece of thoughtful advice on selling MCI, one of Vodafone’s belongings, to Verizon to raise funds for Mannesmann takeover (Greenhill Advisory Application, 2007). The final bid constituted €155 billion. The supporting syndicated loan to refinance Mannesmann’s borrowings was underwritten in December 1999 and brought to the general market at the beginning of 2000 (Fight, 2004).
The overall sum of the syndicated loan comprised €30 billion, with each of 11 banks underwriting about €2.7 billion each. The banks that took part in the syndication were the ones that already had close relationships with Vodafone: it was ABN Amro, Bank of America, Banque Nationale de Paris, Barclays Capital, Citibank, Goldman Sachs, Greenwich NatWest., ING Bank, National Australia bank, Toronto Dominion, and Warburg Read (Fight, 2004). Just before the loan underwriting it was reduced to €25 billion by a $5.25 billion of global bond issue, the largest one ever issues by a UK company. The syndicated loan consisted of three parts:
- A revolving credit of €10 billion (1 year with 6 months term out option)
- A revolving credit of €7.5 billion (1 year with 6 months term out option)
- A revolving credit of €7.5 billion (3 years) (Fight, 2004, pp. 86-87).
Afterwards the loan was massively oversubscribed with commitments for €65 billion, resulting in the total raise of €95 billion (the largest ever amount of funds in the global loan market). The loan was then reduced to €17 billion in March 2000 following a reduction in Mannesmann’s borrowing requirements (Fight, 2004). The acquisition was completed in April 2000. Thus, summarizing the financial features of both the target and the bidder in the described case, one should consider Figure X( all indicators are adjusted in US dollars at the 1999 average exchange rate 1.07):
Figure 9. Financial Features of Target and Bidder in the Case of Vodafone/Mannesmann.
Source: from annual reports of Vodafone and Mannesmann AG
Pre- and Post-Merger Ratio Analysis of Bidders
Ratio analysis has been chosen as an analytical tool for a part of the present study because it has proven highly efficient in solving a great number of issues and problems concerning a definite company’s financial performance. Ratio analysis provides the analyst with a dynamic view of the company’s profitability, long-term and short-term potential, the success with which it operates its own assets and whether it represents any shareholder value. Ratio analysis can be helpful both in the diachronic analysis of one company’s performance and in comparison of its financial success with major competitors in the field. Since the task of the present paper is to investigate the change of companies’ performance before and after the acquisition of another company, this tool becomes truly helpful in the assessment, enabling the researcher to produce a set of relevant financial conclusions pertaining to the main point of study.
Since the companies under analysis in the present work are considered within different periods of time (Vodafone – 1998-2001, KKR – 2006-2009), it is impossible to unite their ratios into one table and perform the integrated analysis of their performance change; there are many factors in the external environment that also influence the company’s profitability and financial performance. For this reason the present section will represent the two companies’ ratios with a set of commentaries on their meaning and future relevance for overall performance assessment. The indicators chosen for the present ratio analysis fall into three categories: profitability, short-term liquidity and long-term solvency. These three parameters have been chosen because of their ability to provide a comprehensive view on what level of financial success the companies truly show and to assess it from several angles that may affect the understanding of the whole situation the company finds itself in on the market.
Profitability Measures
The net margin indicator is used to find out how much profit a company can make out of each unit of its revenues or sales, which means its actual ability to operate and control its costs efficiently. It also shows how effectively the company can actually use the mechanism of converting its revenues into profit, so the higher the margin is, the more profitable the company is. Having a look at the figure indicating the net margin of KKR Private Equity Investors L.P., one can make a set of conclusions on its financial performance within the past several years.
Figure 10. Net Margin of KKR Private Equity Investors, L.P.
It becomes evident that the net margin of KKR showed a persistent rise in 2006 and 2007 – the company developed and occupied a more and more stable position in the market, with the acquisition of the growing number of private equity portfolio companies. Comparing the figure of 2006 equaling 13.9% to the 2007 result of 28.7%, it is possible to say that the financial profitability of KKR more than doubled within that period of time, which is highly positive for its market position. However, the 2008 figure shows a sudden, dramatic fall to more than 100% of profitability – it constitutes a negative margin of -109.1%. Reviewing the situation in the investment market in 2008, it is possible to find the reason for such an abrupt fall – the global financial and economic crisis burst out at the end of 2007 and reached its peak in the beginning of 2008, still affecting the majority of businesses operating in all sectors of economy.
In the co-chairmen’s official statement for shareholders in the 2008 Annual Report, the reasons for the indescribable failure of KKR in 2008 are described – with the home prices, global GDP and employment rates soaring, consumers started to defer their discretionary payments, and no sufficient discovery was seen in the near future (KKR Private Equity Investors L.P. 2008 Annual Report, 2009). The company responded to the unexpectable changes in the global market with all attempts directed at increasing volatility and financial stability of their private equity portfolio companies that actually comprised the majority of their assets. The strategy appeared wise and rewarding, which can be seen from the 2009 net margin figure – the company overcame the zero margin and returned to a positive profitability level of 17.3%. The Alliance Boots division the acquisition of which is considered in the present study also did not suffer much from the global recession, which can be seen from its profitability measures described in the previous section.
Figure 11. Net Margin of Vodafone.
Discussing the net margin of Vodafone, it is first of all necessary to admit that the 1998 and 1999 figures show the stable, effective cost control that also witnesses the trend of insignificant improvement. However, starting from 2000 the net margin is experiencing a serious reduction, with drastically low results in 2001. The major discrepancy lies within the fact that Vodafone did not experience any problems or serious financial losses in 2001, which can be seen from its 2001 annual report statements. On the contrary, the company reported stable growth and expansion to other markets, the increase in turnover, number of customers and geographical coverage of its services. Especially beneficial was Vodafone’s policy of expansion to new markets with the help of acquisitions (AirTouch, Mannesmann discussed in the present paper etc.). So, there might be no reasons for the poor financial results showed by the net margin of -65.1% in 2001.
However, it is necessary not to forget that the net margin indicator shows not only the profitability of the company, but also the efficiency of its cost control. The following situation occurred with Vodafone in 2001: the company increased its operating expenses and cost of sales with a significant increase of turnover that nonetheless did not manage to cover the previous two negative figures. As a result, even under the conditions of sustainable, positive growth of Vodafone’s financial indicators in the market, its net loss increased substantially due to the tendencies mentioned, showing inconsistency of cost control resulting in such frightening figures.
The next measure to be assessed is Return on Equity (ROE), which in fact represents a very helpful financial indicator of the company’s profitability and sustainability. This ratio is considered one of the most important financial ones because of two main purposes thereof: the ROE ratio shows first of all the company’s efficiency in generating profit from each unit it has in its assets, and secondly, it shows how well the company uses its investment funds for the same purpose.
Figure 12. ROE of KKR Private Equity Investors, L.P.
The statistics of ROE change of KKR shows the really hard times the company faced in 2007 and 2008, with the global crisis beginning and seriously impairing the consumers’ investment potential. The growing market instability that was observed in 2007 and 2008 led to the seizure of investments and large-scale operations that actually were the major specialization of KKR Holdings LLC. The 2007 lowest figure may also be connected with the acquisition of Alliance Boots that cost the KKR consortium more than $20 billion. This large-scale purchase could not help leaving its trace on the capability of the company to raise profit from its assets – despite the syndicated loan financing of the deal, KKR still had to invest a significant portion of its assets into the purchase, thus risking their ROE indicators that fell to -93.2%, revealing the tension on resources that the purchase produced. However, the company managed to recover after the 2-year recession period, which can be seen from the 2009 figure – it actually represents the same level of return on equity as was observed in 2006, before the recession. This fact is highly positive for the company, which means that it managed to return to the pre-crisis level of performance; this observation may serve as a positive incentive for investors and a sign of the good new start for the company.
Figure 13. ROE of Vodafone.
ROA indicators of Vodafone remained low but stable during 1998-2000, however, 2001 already showed a negative tendency connected with the aggressive spending spree of Vodafone observed 3-4 years before. The most influential expenditures were the acquisition of Mannesmann GmBH and AirTouch, which turned out in 2001 the reason for financial instability of Vodafone. The acquirer turned out to have paid inflated prices for overseas assets, which gradually worsened the company’s position and finally led to the enormous loss before taxes. These heavy losses brought about the substantial decrease in shareholder equity affecting the ROE ratio. During a couple of future years Vodafone managed to achieve positive ROA growth again through the well-thought-over and balanced spending policy, through firming up its newly-acquired companies on profit-raising strategies. However, the 2001 position of Vodafone was rather failing, judging from the negative ROA ratio of -6.4%.
The next ratio chosen for analysis is return on assets (ROA) of both companies. It is also one of the key indicators of the company’s efficiency in financial terms because it shows how profitable the company’s assets are in generating revenue, which means how much money the company can generate from the assets it has in possession. The indicator tells about the company’s capital intensity as well.
Figure 14. ROA of KKR Private Equity Investors, L.P.
So, identifying the ROA figures for KKR Private Equity Investors L.P., one can see that they were substantial in 2006 and 2007, with a significant decrease in 2008. These figures allow speaking about high capital intensity of KKR. Nonetheless, the low 2008 figure may be connected with the acquisition of Alliance Boots – this fact is supported by the tendency of companies requiring investment to have lower ROA figures. Since the 2007 deal requires large-scale financing, it is possible to suggest that the main reason for the downturn in ROA figures can be seen in a large loss that did not have enough time to pay off. However, the continuation of the negative tendency can be seen from the 2009 figure that was already negative, equaling -3% and indicating the inability of the company to generate profit from its assets. This fact is wholly explained by the dreadful impact of the global recession on the global investment activity that experienced a feasible disruption.
Figure 15. ROA of Vodafone.
Unfortunately, there is no data on ROA figures for Vodafone in 1998 and 1999, but the tendencies of 2000 and 2001 can be observed. The 2000 figure was rather low though positive – this fact can be explained by the powerful acquisition policy that the company pursued a couple of years before and continued to pursue in 2000 and 2001. However, the negative ROA result in 2001 that equaled more than 4% was an alarm for the company to think of the stake they paid for numerous acquisitions and attempts to widen their influence in other markets. It is also possible to suggest that it was the ROA negative performance that led to a huge write-off of Vodafone in 2002 resulting from a huge pre-tax loss and devaluation of Vodafone’s assets. In case of write-offs, the company usually reconsiders the value of its assets and diminishes their value. This might have happened with Vodafone as well, with assets performing poorly in 2001 already, but with Vodafone administration and accounting staff being unable to admit the soaring performance tendencies yet.
The next variable chosen for consideration is the price-to-earnings ratio (P/E) of the companies’ stock. The ratio is a direct correlation of the price for the company’s shares paid in the stock market and the annual earnings it can yield for the shareholders. In other words, the P/E ratio is a direct indicator of the demand for the company’s shares. The higher the ratio is, the more stable the company’s position in the stock market is.
Figure 16. P/E ratio of KKR Private Equity Investors, L.P.
The P/E ratio of KKR shows two years of negative results, which proves how hard the period of recession and the acquisition of Alliance Boots turned out for the company. Since it is impossible for the price of a share to be negative, only the negative EPS figure can explain such low, negative results in P/E ratio for the company. This fact means that KKR was persistently losing money on shares during 2007 and 2008. The 2006 figure shows a really high P/E ratio that indicates the financial stability of the company, a relatively high demand for its shares and positive results shareholders got from the company’s activity then. However, the 2007 sharp downturn with a reduction by about 40% shows serious changes in the financial structure of the company.
The event that caused such a serious drop may fairly be the acquisition of Alliance Boots that on the one hand caused multiple debates and disapproval of AB employees, and, on the other hand, was accompanied by hard, long-term work on the loan syndication needed to assist KKR in the acquisition. Since it was very hard to find investors and the banks who previously agreed to participate in the syndication of a loan refused from participation shortly afterwards, which could not help affecting the company’s reputation and confidence of investors. The fact that the company could not sell even the tiniest parts of its debt because or unwillingness of investors to buy high-risk loans also contributed to the negative trend in the company’s P/E ratio. However, despite the shock of the 2008 recession, the company still managed to recover and regain shareholder confidence, which is certified by the positive P/E ratio gained in 2009 and equaling 5.93.
Figure 17. P/E ratio of Vodafone.
The P/E ratio of Vodafone, in contrast to KKR, did not reach any negative figures, but it surely suffered from the Vodafone policy of large-scale, numerous acquisitions conducted in 1999-2001. Despite Vodafone’s occupying leading positions in the communications industry and expanding its influence abroad through acquisitions, the confidence of shareholders began to reduce starting from 2000. The reason for this was the serious increase in expenses, the inability of the company to control its costs, leading an aggressive acquisition strategy that finally resulted in a huge net loss. Disregarding its growing turnover rates, the company was losing its value, which finally resulted in the 2002 write-off. This tendency could not be left unnoticed, and some preconditions revealed themselves in 2000 and 2001 already, warning the shareholders against investment in Vodafone. For this reason the demand for Vodafone shares showed a steady decrease starting from the tremendously high figure of 1999 when the communications boom was at its peak and investors were highly concerned about taking a share of highly profitable industry representatives.
The P/B ratio is one more ratio used to identify the financial performance of the company, but it reflects the profitability issues from an alternative point of view. The P/B ratio indicates how strongly the investors expect the company’s management to raise the value of their shares. However, the company does not give any feasible, precise information about the actual ability of the company to provide this increase in value. Nonetheless, the figure of P/B ratio may reflect the publicity surrounding any company’s activities and the reaction of shareholders to them, thus giving a chance to understand how positively they think about the company and how ready they are to go on with the investment partnership with it.
Figure 18. P/B ratio of KKR Private Equity Investors, L.P.
The P/B ratio of KKR is relatively low, but stable throughout the whole period concerned. The tiny increase is seen in 2008, which may be explained by the negative effect of the economic recession and investors’ hopes for the KKR management to benefit from the impaired market position. Nonetheless, the 2009 figure is almost 2% lower, which means that the expectations did not come true and the company suffered a serious failure in the course of the crisis. This became evident at the end of 2008 already, and the investors reduced their positive expectations regarding the value of stock they possessed for 2009.
Figure 19. P/B ratio of Vodafone.
At the beginning of its expansion activities, Vodafone enjoyed great popularity among shareholders who expected enormous increases in the value of its assets. This fact is fully explainable by great gains of Vodafone in 1998 as compared to 1997 and previous years. According to all financial reports, Vodafone was a soundly developing company that promised great profit to shareholders. In the intensity of the communications boom the shareholders were highly positive about the value of Vodafone assets, which is evident from the 76.72% figure. However, with the beginning of acquisitions and the instability in assets, returns and the share value shareholders began to disapprove the company’s policy due to the short-term effect on their earnings. For this reason their expectations significantly reduced in 1999 to 48.5%. However, 2000 and 2001 showed an incredible downturn in shareholders’ expectations; witnessing the negative financial effect from acquisitions, shareholders’ expectations reduced to a nearly zero level, which marked great disapproval and dissatisfaction of shareholders. However, it is necessary to mark again that the expectations reflected in the P/B ratio do not reveal the actual position of the company’s asset value.
The P/S ratio is also a variable that indicates a certain aspect of the company’s financial performance. It actually denotes the difference between the share price of a company and its past performance (i.e. sales). Despite the fact that it is very limited, not including some accounting elements such as expenses and debt, so the indicator may be quite misleading and distorting the real image of the company’s performance. Nonetheless, under the condition of proper evaluation of accompanying indicators, the P/S ratio can also provide much helpful information about the company’s performance.
Figure 20. P/S ratio of KKR Private Equity Investors, L.P.
As one can see from Figure 11, KKR has had a relatively low P/S ratio for the whole period analyzed. This means that the difference between the share price and its past performance is relatively low. On the one hand, it is positive for the company because of its stable position reflected, but on the other hand it shows the corresponding relevance to a relatively low profit margin. One more reason for a low P/S ratio may be found in the specificity of KKR business – it is a private equity investor that does not have any goods and services to sell but acts as an investor for private equity firms. A similar situation may occur in any company in case it books sales for which it has not yet provided the resources or before the customer fulfills their obligation to pay – the P/S ratio will be substantially lower. Since the core of investment business is in the long-term loans that are not returned at once, it is possible to suppose that the P/S ratio figures will be considerably lower for all investment companies than in other sectors of economy. However, it is necessary to have a look at the insignificant price reduction in 2008 as compared to 2007 – the reason for such a tendency may lie within the scope of both AB acquisition and the effect of the economic recession, which is rather hard to understand now.
Figure 21. P/S ratio of Vodafone.
Vodafone P/S ratios have been rather high since 1998, though a considerable threefold reduction was observed in 2001. The reasons for sustainable, constantly growing P/S figures in 1998-2000 can be explained from the point of view of the company’s expansion and increase in total assets, emission of large numbers of shares and popularity of the communications business on the whole. It goes without saying that under the conditions of the sector’s prosperity and Vodafone’s continuing success sales rose together with market prices of shares. One more reason for such a difference in P/S ratios within years is inflation that caused the reconsideration of share prices from the beginning of Vodafone’s existence. The downturn in 2001 can be explained by the coming write-off of Vodafone’s value due to its self-destructive, aggressive policy of acquisitions that affected its reputation, share prices and sales correspondingly.
Short-term Liquidity Measures
The next group of measures chosen for ratio analysis certifies the companies’ short-term liquidity, i.e. the ability of the company to meet its short-term liabilities and to convert its assets in cash to pay off their obligations. The quick and current ratios can shape the image of any company’s liquidity the best, so they have been chosen for the present analysis. The current ratio shows the ability of the company to pay its short-term debts due within 12 months; in case the company is unprofitable and unlikely to complete that task, the ratio will be less than 1. In case the company is able to complete the task, the ratio will be more than 1. As for the quick ratio, it is used to denote how much near cash and quick assets the company has to pay its debts immediately. The higher the ratio is, the more capability for quick repayment the company has.
Figure 22. Current Ratio of KKR Private Equity Investors, L.P.
Figure 23. Quick Ratio of KKR Private Equity Investors, L.P.
There is no information on liquidity for KKR Private Equity Investors, L.P. because of the specificity of the company. In fact, companies working in the sphere of investment are illiquid; for this reason no liquidity measures will be considered in the present study for the given company.
Figure 24. Current Ratio of Vodafone.
Figure 25. Quick Ratio of Vodafone.
Since the quick ratio is very similar to the current ratio (with the only difference that the current ratio includes stock in assets, and the quick ratio does not, which forms the slight difference in indicators). Judging from the figures of both ratios, it is possible to see that the company’s liquidity has been showing the steady growth within the given period of time, but it was only in 2001 when the level of liquidity rose above 1. It means that the company experienced steady improvement in current assets availability, or managed to substantially reduce its outstanding liabilities as compared to assets, but still remained in the category of illiquid, unprofitable companies. However, with the completion of acquisitions and a significant period of time passing on from that moment giving some time for the company to recover from a significant loss, Vodafone finally managed to recover and became able to pay off its current liabilities only in 2001. However, this data should also be reconsidered as soon as the long-term solvency measures are analyzed. It is possible that the company’s short-term debt coverage possibilities are poor, but they are compensated by its high long-term solvency opportunities. Only analyzing these measures in a complex will give a full and precise picture of the Vodafone’s pre- and post-merger performance.
Long-term solvency measures/loan syndication indicators
The first indicator of the company’s long-term solvency is the debt/equity ratio; it represents the correlation between the company’s own assets and external debt used to finance its operations. Thus, the indicator includes the long-term debt figure as well, giving a good idea of what the long-term prospects of the company in its financial performance are. In the present case, the indicator clearly shows how well the company copes with its syndicated loan.
Figure 26. Debt/Equity Ratio of KKR Private Equity Investors, L.P.
KKR Private Equity Investors, L.P. have had rather high debt/equity ratios within the covered period, which means that they used much more borrowed funds for financing their operations than their shareholder equity constituted. The ratio increased substantially in 2008 equaling 17.87%, which can be explained by a large syndicated loan taken for the acquisition of Alliance Boots; after the completion of the deal the correlation between shareholder equity and liabilities became much more disproportionate and caused the increase. However, within a year the company managed its operations quite well, pursued a wise strategy generated in response to the global crisis and its own debt obligations, thus coming to a serious decrease in the debt/equity ratio to the ever-low figure of the period – 7.83%.
Figure 27. Debt/Equity Ratio of Vodafone.
In the case of Vodafone, one can see that the debt/equity ratios were consistently low during the analyzed period. This means that the company was unwilling to engage external debt in financing its operations and relied heavily on its own assets. However, recollecting the strategy of aggressive, multiple acquisitions conducted by Vodafone in 1999 and 2000, it is necessary to suppose that the low ratio level can also be justified by the growing volume of shareholder equity that increased together with the company’s liabilities, thus concealing the true volume of the company’s debt.
One more figure for analysis in the present section is the interest coverage ratio of both companies. The ratio indicates how ready the company is to cover its interest expenses, and is derived from the correlation between the company’s total income before taxes and the total interest expenses the company has. It also has the direct relation to the syndicated loan performance as it is also called the times interest earned ratio, showing how well the company meets its loan obligations.
Figure 28. Interest Coverage Ratio of KKR Private Equity Investors, L.P.
The ratio of KKR shows that the company was actually never able to cover its interest expenses well enough to be considered profitable. In case the interest coverage ratio is below 1.5, the company’s ability to do this should be questionable. Thus, one can see from the figure that 2006 and 2007 showed some positive tendencies in the interest coverage ratio growth, though it still was rather low. However, 2008 was a failure for KKR in interest coverage because of the crisis and large expenditures on the acquisition of Alliance Boots; for these reasons the company was absolutely unable to pay its interest obligations, which is evident from the negative figure of -0.91%. The balance was restored in 2009 when KKR managed to return to positive figures in interest coverage, though the indicator still remained rather low, certifying a certain number of complications with the obligation payment for KKR.
Figure 29. Interest Coverage Ratio of Vodafone.
A completely different situation can be observed in the case of Vodafone. One can see that 1998 and 1999 were marked with a substantially high level of interest coverage ratios, which proved that Vodafone could easily pay interest on its outstanding debt. However, the 2000 ratio showed a sudden fall that might have derived from the series of acquisitions of 1999 and 2000 that put a strain on the company’s resources and made its interest coverage potential significantly lower. However, the level of 4.33% is still a very good indicator, which certifies that notwithstanding a much more complex situation with funds in Vodafone, it was still able to carry its expenses relatively easily. The abrupt change of the situation can be seen from the 2001 figure – the interest coverage ratio of Vodafone fell to the ever-low minus 4.46%, which was incredible for such a previously profitable company. The problem was quickly recognized by the company’s management, which resulted in the write-off following the dramatic year in 2002.
The final ratio to be analyzed in the present section is the debt ratio that may be characterized as the company’s total debt to the company’s total assets relation. The indicator is very important in the discussion of loan syndication because it shows how well the company uses its assets to cover the expenses for loan repayment. The larger the indicator is, then the less successful the company is in its credit obligations.
Figure 30. Debt Ratio of KKR Private Equity Investors, L.P.
The debt ratio of KKR is rather high in all periods of time observed in the present work, but it is explainable by the fact that the amount of the company’s debt was reducing with a proportionate amount of assets reducing as well. Thus, it is possible to assume that the KKR Financial Holdings LLC was leading a very wise and considerate financial policy, thus managing to reduce the whole amount of debt, though by means of reducing the number of assets as well. It is enough t recollect the policy KKR adopted with the outbreak of the global crisis – its administration decided to sell out its assets to reduce the credit risk. From the figures seen above, it comes that the idea succeeded and the general positive tendency can be seen in the stability of the company.
Figure 31. Debt Ratio of Vodafone.
Vodafone’s debt ratio is rather low, which may speak about the good position of the company and its direct ability to face its credit obligations. However, the figure is a correlation between two indicators, and here one can see the direct relation of the low debt ratio to the tremendous number of assets the company has come to possess within the given period of time. The company’s debt was rising from year to year, but the ratio remained considerably low because the amount of assets owned by Vodafone increased by 60 times within 1998-2001.
WACC Analysis
The weighted average cost of capital is one more key feature that allows understanding the true financial performance of a company. The reason for which it is highly relevant for the present study is that it shows the rate of return to all financing entities – shareholders and lenders – needed to sustain the adequate financial figures and remain profitable for investment. The WACC indicator is often used by investors to identify the measure of investment risk; it also shows how well the company manages its equity and debt that it already possesses and whether it copes with satisfying the minimum expectations of returns for both parties.
The information on WACC pertaining to Vodafone is as follows: in 1998 Vodafone’s administration estimated WACC at the level of 18.5%, though the Competition Commission recalculated the indicator and arrived at an average figure between 14.9% and 7.8%. This experience showed how some companies may overestimate their WACC to seem more profitable for investment. It also seems reasonable for Vodafone to make suchlike attempts if one recollects the large-scale expansion policy unleashed by it in 1999 and 2000. Nonetheless, in 1999 Vodafone’s WACC was about 5.5%, which certifies the growing size of debt and the growing inability of Vodafone to provide sufficient returns. The 2000 WACC was already 7.6%, which certified the positive tendency in the company’s cost management strategy. However, not much change has taken place in the Vodafone WACC presentation because in 2010the company shows the 7% WACC – it does not differ much from the 2000 figure, so it is possible to conclude that the company is still on the average level of providing satisfactory returns for lenders and shareholders in full.
Speaking about KKR Financial Holdings, it is rather hard to estimate WACC on the amount of available information. The 2001 figure was 13.7%, which was rather satisfactory for the industry of private equity investment. Returning to the period of the company’s activity discussed in the present work, one can see the average 2007-2009 WACC at the level of 6.16%, which is twice as low as it used to be five years before. The reasons for this decrease in KKR Financial Holdings’ performance can be diverse. First of all, the global crisis, the influence of acquisitions and other external factors could have undermined the company’s capacity for returns. It is enough to recollect how poor investment companies performed in the peak of the crisis, in 2008 and 2009, when the consumers appeared unable to fulfill their lending obligations. However, KKR pursued a wise asset management and cost distribution policy, which was discussed in previous sections and it sold the majority of its assets to reduce the financial risk; this step could also influence WACC directly.
EBIT Analysis
The following indicator is EBIT – earnings before interest and taxes that a company has. The present indicator has always attracted the close attention of creditors because it shows how much cash the company has to pay off its debts, the syndicated loan obligations in the present case. So, Figure 32 shows the EBIT change tendency of KKR Financial Holdings:
Figure 32. EBIT of KKR Private Equity Investors, L.P.
As it comes from the present figure, the situation with earnings in KKR was quite stable until the sudden fall in 2008; this fact can be explained both with the acquisition of a huge syndicated loan that undermined the ability of KKR to face the credit obligations, and the global crisis that shocked the whole world and especially private equity companies. It is necessary to remember that in 2008 a dramatic portion of borrowers failed to pay off their obligations because of unemployment and economic downturn, so the private equity company like KKR was the first to feel the difference in cash inflows. It is possible to suggest the overwhelming influence of the crisis because of the 2007 figure – it already was considerably lower than the figure of 2006, while the crisis was not yet felt, which suggests that the company’s ability to pay its obligations considerably reduced. Nonetheless, despite the negative figures KKR had in 2008, the 2009 positive result shows how well the company managed to cope with the crisis and how well it manages its credit obligations at the present moment of time.
Figure 33. EBIT of Vodafone.
As it comes from the figures of Vodafone, it had a considerably larger amount of cash to meet its credit obligations, which made it a really attractive target for investing. Even upon the acquisition of a large syndicated loan in 1999-2000 for the acquisition of Mannesmann, and some other loans for a series of acquisitions, the position of Vodafone in 2000 was more than stable – the EBIT figure is ever-high. Nonetheless, it is possible to see how misleading the figure was – it was possible to show such great results because Vodafone’s assets increased enormously due to the acquisition but they had no time to become profitable for the company. Thus, the major write-off of 2002 was preceded by the realization of the fact that Vodafone absolutely could not meet its credit obligations in 2001.
Regression Analysis on Key Productivity Indicators of Bidders
The finalizing part of the present performance analysis is the regression and correlation analysis of key performance indicators for both companies and the measure of dependence of the key performance variable on several additional independent variables. The model chosen for analysis was predetermined by several considerations. First of all, the sample of companies chosen is too small to perform any integrated regression analysis on both of them. For this reason, it was chosen to perform analysis in two parts, each investigating the performance determinants in each separate company. The choice of variables was also heavily determined by the volume of information in the focus of the present study, i.e. four years (two years before the acquisition and two years after). Hence, it was possible to take only 16 indicators of each variable (quarterly data available from financial reports of Vodafone and KKR Financial Holdings). Since it is necessary to have at least 6 indicators for each variable chosen to make up a valid mathematical model, it became apparent that comparison of only 3 independent variables is possible. The chosen variables represent different aspects of the company’s financial performance, so they provide a fairly strong correlation between the factors and the dependent indicator of the company’s performance.
The dependent variable chosen for analysis of Vodafone financial performance is the interest coverage ratio since it directly reflects how well the company manages to pay off its outstanding debt and obligations towards investors. Since it is the central point of the present study – to understand how well the companies manage their financial performance before and after the acquisition, it seems reasonable to derive conclusions from it. The independent variables that reflect the financial situation in the company from different angles are the market capitalization, total equity and revenue. These variables are also relevant in the context of discussing financial performance, so their impact on the interest coverage ratio will be investigated. The following Figure shows the strength of correlation between the chosen indicators:
Figure 34. Correlation Analysis of Vodafone Performance Indicators.
The present correlation shows a rather strong though negative correlation between the dependent variable and the chosen set of independent ones, which means that each stepwise increase in any of the variables chosen was likely to lead to the decrease in the indicator of the dependent variable.
Figure 35. Regression Statistics Vodafone.
The following set of conclusions on the regression statistics shows a rather strong correlation between the variables chosen, which may be seen from the multiple correlation ratio R being more than 78%. 22% more reflect the influence of factors that are not considered in the present analysis. Thus, it seems appropriate to assume that the choice of variables was successful.
Figure 36. Regression Analysis Vodafone.
Judging from the present analysis, one can state that both market capitalization and revenue produce positive influence on the dependent variable, that is, on the interest coverage ratio. However, the influence of market capitalization is much less than that of revenue, which can be seen from the corresponding regression ratios of 0.11 and 3.2. The only variable that shows a negative correlation is market capitalization. However, the influence is still evident and even exceeds the one of total equity movement.
The dependent variable chosen for KKR Financial Holdings is its ROE since it is a strong factor certifying the company’s financial performance. Determinants of ROE were chosen as follows: net income, shareholder equity and book value per share. The choice of variables different from the ones for Vodafone is explained first of all by their belonging to different sectors of economy, thus influencing the assessment of their financial performance.
Figure 37. Correlation Statistics for KKR Financial Holdings.
The correlation data on chosen indicators shows an even stronger positive interdependence of all chosen variables, which proves the correctness of chosen data for regression analysis production.
Figure 38. Regression Statistics KKR.
The chosen indicators have a very strong influence on the dependent variable, which can be seen from the R-square value of 81.5%. Hence, only 18.5% of the influence on ROE can be attributed to the variables that are not considered in the present study.
Figure 39. Regression Analysis KKR.
F-value – 17,62634995
The regression analysis shows the presence of interdependence of variables, though it is more insignificant than in case of Vodafone. As it was evident from the correlation analysis table, again, the net income variable influences the ROE indicators in a negative way, which means the more net income is, the lower ROE will be. Nonetheless, the influence is so insignificant in connection with two more variables that it is possible to say that the latter two should be considered more closely in order to form the precise image of interdependence.
Conclusion
Summary
The present study was dedicated to the investigation of M&A tendencies in the modern world, with separate attention dedicated to the US and British markets. The main questions of the study have been successfully answered, including thorough analysis of regulatory and non-regulatory environments of acquisition processes, the financial structure of M&A and factors that produce a direct influence on the post-acquisition performance of both bidders and targets. On the example of Vodafone/Mannesmann case, the complex hostile acquisition was analyzed with the whole realm of internal and external implications of the bidding process. This acquisition, on the foreground of a much more over-grasping aggressive acquisition policy of Vodafone, showed the long-term consequences of several successive M&A undertakings with the negative impact on the whole financial capacity of the company. The case of Alliance Boots acquisition by KKR Holdings LLC has shown how the acquired company managed to perform better than its new owner, and what the reasons for such a discrepancy were. This case was more complicated for consideration because of the coinciding periods of post-acquisition performance of KKR and the outbreak of the global crisis that could not help producing a set of dramatic effects on the company’s policy, market strategy and performance.
It goes without saying that the present study has offered a much deeper insight into the field of M&A that has often been overlooked in previous studies – the role of loan syndication in the post-acquisition performance of the acquiring company. Both M&A cases were chosen regarding the main factor: syndicated loan underwriting with the purpose of financing the acquisition. Thus, some financial implications of using the syndicated loan for financing, the choice of banks agreeing to participate in the syndicated loan and the challenges that await the company taking such a loan were analyzed. It has become evident that the process of syndicate arrangement and funds provided in the course of loan syndication were decisive in the formation of financial statistics as soon as post-acquisition performance was assessed and debt volumes were considered.
The M&A market is constantly developing, its popularity grows and the sphere of investment banking responds to the needs of M&A bidders correspondingly. This fact may be supported by growing research and evidence in the sphere of syndicated loan market advancement with the purpose of meeting the innovative, growing needs of corporations engaged in M&A activity. The syndicated loan market is one of the most rapidly developing ones because of its diverse benefits it is ready to offer for companies willing to conduct large-scale M&A. Even substantial threats associated with acquiring a syndicated loan do not represent a significant barrier for corporate finance and restructuring, which is seen from the examples considered in the present work. There are many indicators for further diminishing of the conventional banking role and the growing popularity of syndicated loans as a new type of corporate financing; hence, it is essential to pay much more attention to the potentially profitable area of banking that is now only at the early stage of development.
The overwhelming body of research considered at the initial stage of the present research was dedicated to analyzing the puzzle of falling performance figures right after the acquisition is complete. Many authors discussed the phenomenon and analyzed it in financial terms, agreeing that the tendency revealed itself even in cases when there were no preconditions for a recession – e.g. the works of ** prove the dominant failure of companies to sustain performance figures on the prior level, setting aside the ability to gain profit from the acquisition. However, the present research revealed contradictory data: both targets proved successful in their further activities in the market, but the overall performance of the bidder was much lower than it used to be before the acquisition. Surely, there were many accompanying circumstances considered both in case of Vodafone and KKR, but the statistical result still remained rather discouraging for both bidders in the end.
The bidders chosen for analysis performed their M&A activities in different periods of time (Vodafone – 1999, KKR – 2006) and represented different sectors of economy (Vodafone – telecommunications, KKP – private equity investment), so the choice of these cases allowed to manipulate a much larger scope of indicators, financial performance variables and market conditions. More than that, the bidders are from the USA and Great Britain, which allowed to consider different regulatory environments and to understand how much they affected the procedure and structure of M&A (e.g. KKR with Pessina acquired more than 25% of Alliance Boots stock, thus preventing the Terra Firma consortium to gain the control quantity of 75% to eliminate competition, which was totally unacceptable under the US anti-trust law). In addition, the implications of Vodafone/Mannesmann acquisition that represented a large-scale hostile one were considered – the reasons for which the acquisition took place disregarding the protest of the board and employees. The prices for Vodafone shares rose enormously in 1997 and 1998, so shareholders decided the destiny of Mannesmann despite the reluctance of the enterprise itself to be acquired.
In addition to the intricate procedures and tricks implemented in case of M&A, it is possible to assess the motivation for the acquisitions. Vodafone represented a typical example of the telecommunications group that wanted to extend its influence in other EU countries like Italy and Germany. Through the influence of Mannesmann in the European market and shares of telecommunications companies in Great Britain Vodafone managed to strengthen its influence in Great Britain and acquire several influential telecommunications companies throughout the European Union. In case of KKR Holdings, the initial motive was similar to Vodafone, though the KKR in its essence did not act in the sphere of pharmaceuticals – its main function was to invest private companies and to benefit from pure investments. Here the aim of KKR was formulated as the wish to extend the KKR influence in the European market and to offer additional opportunities to Alliance Boots under in the wider access to financial resources, strategic experience and guidance of KKR etc. Thus, the theoretical basis drawn for the present research was practically proven – the motivation for M&A activity was empirically investigated in two case studies.
Finally, the future of M&A market is also researched on the examples of the same companies continuing to conduct their M&A activities after the discussed case. Speaking about the case of Vodafone, it is surely necessary to admit that the outcome of an aggressive expansion policy was dramatic and resulted in the huge write-off that actually constituted the company capital’s devaluation. However, despite the serious threat that the 2002 write-off meant, the modern data on Vodafone performance show that the company managed to cope with the temporary downturn and recovered be means of pursuing a wise market strategy. Its enormous assets and number of belongings in several EU countries as well as advancement and growing popularity of telecommunications services assisted the company in regaining its leading positions. In case of KKR , the strike of the global crisis affected the company’s performance (it is essential to keep in mind how strongly the crisis blocked investment and returns on previously granted investment funds). Nonetheless, the 2009 figures already showed the recovery of KKR balance and income, indicating positive figures as compared to 2007 and 2008.
Limitations and Areas for Further Research
The present research surely has a set of limitations that have to be discussed in the context of considering the M&A process and loan syndication. First of all, it is essential to understand that the financial performance of companies was assessed in the context of some additional influential factors, such as the economic recession of 2008 that coincided with the acquisition of Alliance Boots by KKR. Since KKR Holdings is a private equity investment company, it felt the impact of the recession more seriously than some other sectors did, so the economic downturn could affect its financial indicators even stronger than the acquisition of Alliance Boots did. Judging from the positive figures of 2009 compared to negative ones in2008, it seems that the effect of Alliance Boots acquisition proved not very dramatic for the company’s performance (it would be much harder for it to restore positive performance figures in case both factors produced a highly negative impact). Hence, it is possible to conclude that the considered financial indicators surely give a concise and accurate picture of performance change in both KKR and Vodafone, but they do not reveal the full influence of the acquisition and loan syndication discussed (KKR – for the reason of financial crisis, Vodafone – for the reason of several large-scale acquisitions conducted in 1999 and 2000, with Mannesmann AG being only one of them and producing only the partial impact).
The second limitation of the present research is the choice of companies from different sectors of economy that seriously complicates making generalizations on the subject of influence of acquisitions and loan syndication on post-acquisition performance of both of them. The reason for such choice lies in the constraints in approaching M&A and loan syndication information that still remains non-disclosed for the majority of recent deals. More than that, it was intended to choose one US-located and one Britain-located company to diversify findings and to reflect the true nature of regulatory environment, European and American approaches to M&A etc. However, on achieving the diversification goal it was found out that a private investment company and a telecommunications company have to be measured according to different set of indicators verifying their performance (e.g. KKR is illiquid as all investment companies are, and the main indicator for Vodafone is its turnover). Thus, for the sake of generalizing results for the target and the bidder, which was a part of financial analysis of the acquisition, it was decided to eliminate certain indicators from the list for comparison, which surely could not help resulting in the limited overview.
Finally, the third limitation of the present research results from the application of regression analysis to a small sample of two companies chosen for the study. It turned out completely impossible to perform a generalized regression analysis that would unify data for both companies in their pre-merger and post-merger period of functioning because of the non-compliance of performance measurements mentioned in the previous paragraph. Thus, it was decided to conduct the regression analysis on each company separately and evaluate the influence of some independent variables on the overall performance of the company. The set of variables chosen had to be rather small – only three variables could be chosen from the list because of lack of financial measurements available (16 measurements for each quarter of 4 analyzed years). The statistical analysis was conducted with the help of SPSS (statistical software) and showed truly precise correlation and regression interdependence and mutual influence of variables chosen, but the number of variables did not enable the researcher to provide a more comprehensive, meaningful statistical study. To perform one at least on 8-10 variables, it is necessary to consider up to 100 companies from one sector, which was unfortunately unavailable in the scope of the present study.
References
- Agrawal, A et al. 1992, ‘The Post-Merger Performance of Acquiring Firms: A Re-Examination of an Anomaly’, The Journal of Finance, vol. XLVII, no. 4, pp. 1605-1621.
- Agrawal, A., & Jaffe, JF 1999, ‘The Post-merger Performance Puzzle’, In Cary Cooper and Alan Gregory, eds., Advances in Mergers and Acquisitions, Stamford, CT: JAI Press, 2000.
- Aldrich, H 1999, Organizations evolving, SAGE.
- Al-Sharkas, AA et al. 2008, ‘The Impact of Mergers and Acquisitions on the Efficiency of US Banking Industry: Further Evidence’, Journal of Business Finance and Accounting, vol. 35, no. 1 and 2, pp. 50-70.
- Altunbas et al. 2006, Syndicated loans: a hybrid of relationship lending and publicly traded debt, New York: Palgrave Macmillan Studies in Banking and Financial Institutions Series.
- Altunbas et al. 2009, ‘Large Debt Financing: Syndicated Loans versus Corporate Bonds’, European Central Bank, Working Paper Series.
- Bhabatosh, B n.d., Fundamentals of Financial Management, PHI Learning Pvt. Ltd.
- Bruner, RF 2004, Applied Mergers and Acquisitions, John Wiley & Sons.
- Cartwright, S, Cartwright, S, & Cooper, CL 2000, HR know-how in mergers and acquisitions, CIPD Publishing.
- Cassiman, B, & Colombo, MG 2006, Mergers & acquisitions: the innovation impact, Edward Elgar Publishing.
- Companies Act 2006, CHAPTER 46, Printed in the UK by The Stationery OYce Limited under the authority and superintendence of Carol Tullo, Controller of Her Majesty’s Stationery OYce and Queen’s Printer of Acts of Parliament, Crown Copyright.
- Coyle, B 2002, Bank Finance, Lessons Professional Publishing.
- Curry, JE 2000, A short course in international economics: understanding the dynamics of the international marketplace, World Trade Press.
- da Silva Rosa, R et al. 2003, ‘Post-Acquisition Performance and Analyst Following: US Evidence’, UWA Business School, The University of Western Australia.
- Dennis, S , & Millineaux, D 2000, Some evidence on agency costs and syndicated loan sales, Working paper, University of Kentucky.
- DePamphilis, DM 2009, Mergers, Acquisitions, and Other Restructuring Activities: an Integrated Approach to Process, Tools, Cases and Solutions, 5th ed., Academic Press.
- Eichengreen, B & Mody, A. 2000, ‘Lending booms, reserves and sustainability of short-term debt: inferences from the pricing of syndicated bank loans’, Journal of Development Economics, Elsevier, vol. 63, no. 1, pp. 5-44.
- Faccio, M & Masulis, RW 2005, ‘The choice of payment method in European mergers and acquisitions’, Journal of Finance, American Finance Association, vol. 60(3), pp. 1345-1388.
- Faccio, M et al. 2006, ‘Returns to Acquirers of Listed and Unlisted Targets’, Journal of Financial and Quantitative Analysis, vol. 41, no. 1, pp. 197-220.
- Fight, A 2004, Syndicated Lending, Butterworth-Heinemann.
- Gadanecz, B 2004, ‘The syndicated loan market: structure, development and implications. Bank of international settlements’, BIS Quarterly Review, pp. 75-89.
- Galpin, TJ, & Herndon, M 2007, The complete guide to M&A: process tools to support M&A integration at every level, 2nd ed., John Wiley & Sons.
- Gaughan, AP 2007, Mergers, Acquisitions and Corporate Restructurings, 4th ed., John Wiley & Sons.
- Gregoriou, GN, & Renneboog, L 2007, International mergers and acquisitions activity since 1990: recent research and quantitative analysis, Elsevier.
- Hitt, MA, Harrison, JS, & Ireland, RD 2001, Mergers and acquisitions: a guide to creating value for shareholders, Oxford University Press US.
- Hunt, P 2009, Structuring mergers and acquisitions: a guide to creating shareholders value, 4th ed., Aspen Publishers Online.
- Insolvency Act 1986, 1986 CHAPTER 45, Thomson Reuters (Legal) Limited, UK Statutes Crown Copyright.
- King, DR et al. 2004, ‘Meta-Analyses of Post-Acquisition Performance: Indications of Unidentified Moderators’, Strategic Management Journal, no. 25, pp. 187-200.
- Kirchmaier, T 2003, ‘Corporate Restructuring of British and German Non-financial Firms in the Late 1990’s’, European Management Journal, Iss. 21, no. 4, pp. 409-420.
- Kusstatscher, V, & Cooper, CL 2005, Managing emotions in mergers and acquisitions, Edward Elgar Publishing.
- Lajoux, AR, & Elson, CM 2000, Art of A&M due diligence, McGraw-Hill Professional.
- Lajoux, AR, & Weston, JF 1999, Art of M&A financing and refinancing, McGraw-Hill Professional.
- Landau, A 2001, Redrawing the global economy: elements of integration and fragmentation, Palgrave Macmillan.
- Lee, SH et al. (1996). ‘The behavior of secondary market prices of LDC syndicated loans’, Journal of Banking & Finance, no. 20, pp. 537-554.
- Lee, KS, & Gasbarro, D 2008, The Development of the International Market for Syndicated loans (1980-2007): A Review, Kent Zumwalt, Colorado State University.
- Marks, ML, & Mirvis, PH 2001, ‘Making mergers and acquisitions work: strategic and psychological preparation’, Academy of Management Executive, vol. 15, no. 2, pp. 80-92.
- Megginson, WL 2005, The financial economics of privatization, Oxford University Press US.
- Megginson, WL, & Smart, SB 2008, Introduction to corporate finance, 2nd ed., Cengage Learning.
- Miller, S 2006, ‘A Syndicated Loan Primer’, A Guide To The Loan Market, Standard & Poor’s.
- Pautler, PA 2003, ‘The Effects of Mergers and Post-Merger Integration: A Review of Business Consulting Literature’, Bureau of Economics, Federal Trade Commission.
- Picot, G 2002, Handbook of international mergers and acquisitions: preparation, implementation and integration, Palgrave Macmillan.
- Price, ADF 1995, Financing international projects, International Labor Organization.
- Ramaswamy, K. (1997), ‘The performance impact of strategic similarity in horizontal mergers: evidence from the U.S. banking industry’, Academy of Management Journal 40, 3, pp. 697-715.
- Reed, SF, Lajoux, AR, & Nesvold, HP 2007, The art of M&A: a merger, acquisition, buyout guide, 4th ed., McGraw-Hill Professional.
- Renneboog, L 2006, Advances in corporate finance and asset pricing, Emerald Group Publishing.
- Rezaee, Z 2001, Financial institutions, valuations, mergers, and acquisitions: the fair value approach, 2nd ed., John Wiley & Sons.
- Rhodes, T 2006, Euromoney Encyclopedia of Debt Finance, Euromoney Books.
- Schure et al. 2005, ‘A Theory of Loan Syndication’, Paul Schure Department of Economics, University of Victoria.
- Sherman, AJ, & Hart, MA 2006, Mergers and Acquisitions from A to Z, 2nd ed., AMACOM Div American Mgmt Assn.
- Smith, RC, & Walter, I 2003, Global banking, 2nd ed., Oxford University Press.
- Stigum, ML, & Crescenzi, A 2007, Stigum’s money market, 4th ed., McGraw-Hill Professional.
- Subramanyam, PG 2008, Investment Banking: Theory & Prac, Tata McGraw-Hill.
- Temple, P, & Peck, S 2002, Critical perspectives on business and management, vol.1, Taylor & Francis.
- The Transfer of Undertakings (Protection of Employment) Regulations 2006, Statutory Instrument 2006 No. 246, Printed under the superintendence and authority of the Controller of HMSO being the Queen’s Printer of Acts of Parliament, Crown Copyright.
- Thomas, H & Wang, Z 2004, ‘The integration of bank syndicated loan and junk bond markets’, Journal of Banking & Finance, no. 28, pp. 299-329.
- Thompson Financial 2002, ‘Syndicated Loans for M&A Continue to Slide’, Mergers and Acquisitions Report, vol. 15, no. 2, pp. 1-3.
- van Horne, JC 1995, Financial Management and Policy, 10th ed., Prentice Hall.
- Weston, JF, & Weaver, SC 2004, Mergers and Acquisitions. McGraw-Hill Professional.
- Zotto, CD, & van Kranenburg, H 2008, Management and innovation in the media industry, Edward Elgar Publishing.
Online resources
- Antitrust Law n.d., West’s Encyclopedia of American Law, Web.
- ‘Alliance Boots takeover approved’ 2007, BBC News Web.
- Annual Report & Accounts 1998, Vodafone, Web.
- Annual Report & Accounts for the year ended March 1999 2002, Vodafone.
- Annual Report & Accounts for the year ended March 2000, Vodafone AirTouch plc.
- Annual Report & Accounts for the year ended 31 March 2001 2002, Vodafone.
- ‘Barbarians’ J10bn battle for Boots’ 2007, London Evening Standard.
- Case No COMP/M.1795 – Vodafone AirTouch/Mannesmann 2000, Office for Official Publications of the European Communities L-2985 Luxembourg, Commission of the European Communities.
- ‘EU clears Vodafone deal’ 2000, CNN Money, Web.
- Greenhill Advisory Application 2007, Greenhill & Co. International LLP.
- Gutscher, C 2007, ‘Deutsche Bank, JPMorgan Delay KKR Boots Loan Sale to Next Week’, Bloomberg, Web.
- Hopner, M, & Jackson, G 2004, ‘An Emerging Market for Corporate Control? The Mannesmann Takeover and German Corporate Governance’, Max-Planck-Institut für Gesellschaftsforschung, Web.
- Hungenberg, H 2006, ‘Mannesman AG, 1999’, Friendrich-Alexander-Universitat.
- Huvard, S et al. 2006, ‘Vodafone Air Touch: The Acquisition of Mannesmann Case Analysis’, Strategic Management, Virginia Commonwealth University, Web.
- Kennedy, S 2007, ‘KKR unable to sell any debt for its £9bn Alliance Boots acquisition’, The Sunday Times.
- KKR & Co. (Guernsey) L.P. 2009 Financial Report, KKR & Co. (Guernsey) L.P.
- KKR Financial Holdings LLC 2010, Beta Tracked.
- KKR Financial Holdings LLC 2010, Google Finance, Web.
- KKR Financial Holdings LLC (KFN) 2010, Yahoo Finance.
- KKR Private Equity Investors, L.P. 2006 Financial Report, KKR Private Equity Investors, L.P.
- KKR Private Equity Investors, L.P. 2007 Financial Report, KKR Private Equity Investors, L.P.
- KKR Private Equity Investors, L.P. 2008 Financial Report, KKR Private Equity Investors, L.P.
- ‘KKR ups Alliance Boots bid’ 2007, Reuters.
- ‘KKR wins Alliance Boots bidding war for $22 billion’ 2007.
- ‘KKR’s Winning European Toehold’ 2007, M&A Law Prof Blob, Web.
- Kumar, S 2010, ‘Vodafone’, International Academy of Management and Entrepreneurship.
- Lewis, T 2008, ‘KKR has the prescription for success at Alliance Boots’, Financial News.
- ‘Guide to Syndicated Loans’ n.d., Loan Market Association.
- ‘Mannesmann FAQs’ 2010, Vodafone.
- ‘Mannesmann to step up Vodafone fight’ 1999, BBC News, Web.
- ‘Recommended Acquisition of Alliance Boots plc by AB Acquisitions Limited’ 2007, Alliance Boots.
- Shannon, S 2010, ‘Alliance Boots Profit Gains 13% on Beauty Products, Wholesale’, Bloomberg Business Week.
- ‘Transforming the Syndicated Loan Market’ 2008, The Depository Trust and Clearing Corporation.
- ‘US M&A Activity’ 2010, FactSet MergerStat: Global Mergers and Acquisitions Information.
- Vodafone Group Plc Annual Report 2008, Vodafone.
- Vodafone Group plc 2010, Google Finance.
- Vodafone Group Plc 2010, Beta Tracked.
- Vodafone Group plc (VOD) 2010, Yahoo Finance, Web.
- ‘Vodafone takeover battle heats up’ 1999, BBC News, Web.
- ‘Vodafone’s hostile takeover bid for Mannesmann highlights debate on the German capitalist model’ 1999, EIROnline, Eurofond, Web.
- Wallace, CP 2000, ‘Europe’s first major cross-border hostile takeover will create a global telecommunications behemoth’, Time Europe.