The demographic variables analyzed in the study included six key measures: age, educational experience, job level, gender and nationality. These variables are analyzed below.
Job Level
The job levels of the employees sampled were categorized into three key groups: employee level, middle-level management, and top-level management. The lowest level (employee level) accounted for 36% of the respondents sampled. Comparatively, 33.3% of the research participants were in middle-level management, while 30.7% of them were in top-level management. The distribution of employees across these job levels appears in figure 1 below.
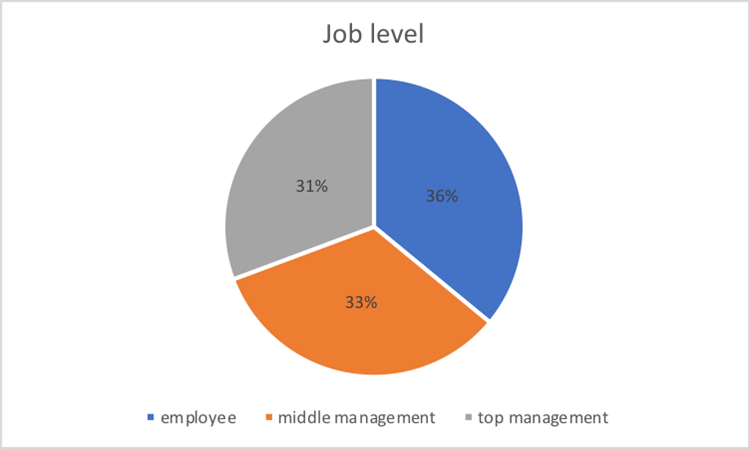
The above data shows that the findings of the study represent all the employees in the organization because the three job levels are not differentiated by more than 6 points. In other words, there is an almost equal number of lower level, middle-level and top-level employees who took part in the study. The lowest employee group (employee-level) comprised the largest cohort of participants in the study. This view implies that a majority of the employees support the decisions that come from the study because top-level managers are usually fewer than lower-level employees. The opposite scenario would be problematic for the study because if top-level managers were the majority of the respondents, it would be easy to criticize the findings based on the view that this employee group is not representative of most people in the organization (by virtue of the number of employees in working in the company). Generally, it could be assumed that all three job levels identified in the study provided a balanced representation of the participants’ views.
Work Experience
The employees’ work experiences were evaluated with regard to how they fit into five key groups. The first one was comprised of employees who had up to two years of work experience. They were 3.5% of the sample. The second group of employees was comprised of those who had between 3 to 5 years of experience and they comprised of 6.1% of the sample. Comparatively, employees who had 6-10 years of work experience were 27.2%, while those who had 11-19 years of experience were 47.4% of the total population sampled. The last category of employees comprised the majority group of respondents. Those who had more than 20 years’ worth of work experience comprised of 15.8% of the sample.
Based on these statistics, most of the employees sampled had 11-19 years of work experience, while the smallest group of employees who took part in the study had less than 2 years of work experience. This finding appears in figure 2 below.
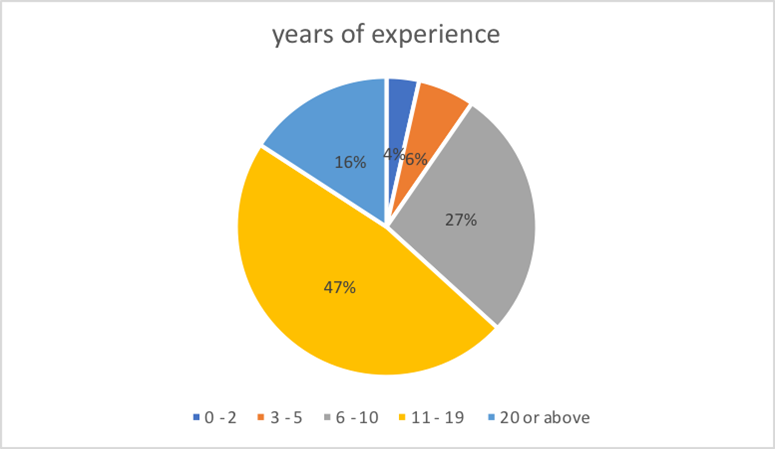
The pie chart highlighted above shows that the employees who had 11-19 years of work experience accounted for most of the responses in the study. This category of personnel was useful to the study because they may have answered the research questions from a point of knowledge about the organization’s activities. Their institutional memory of work processes was also instrumental in understanding the relationship between risk governance processes in the organization and the realization of project objectives in the firm. If this percentage is added to the number of employees who had more than 20 years of work experience, the total percentage of research participants who had more than a decade’s worth of work experience equals to 66% of the sample. This statistic implies that most of the respondents sampled had a lot of work experience to support their views in the study.
Education Level
The education levels of the employees sampled in the study were categorized into five groups that included high school (or less), college degree, higher diploma/bachelor degree, masters, and doctorate (or above). Those who had a higher diploma or bachelor’s degree were the majority because they comprised 42.1% of the sample population. The second biggest educational group of respondents was made up of employees who had a master’s degree. They were 33.3% of the total sample. The third biggest group of respondents was comprised of college-educated employees and they accounted for 15.8% of the respondents surveyed. Employees who had a doctorate degree (or above) were 8.8% of the total number of research participants. No respondent had a high school diploma (or less). These findings are summarized in figure 3 below.
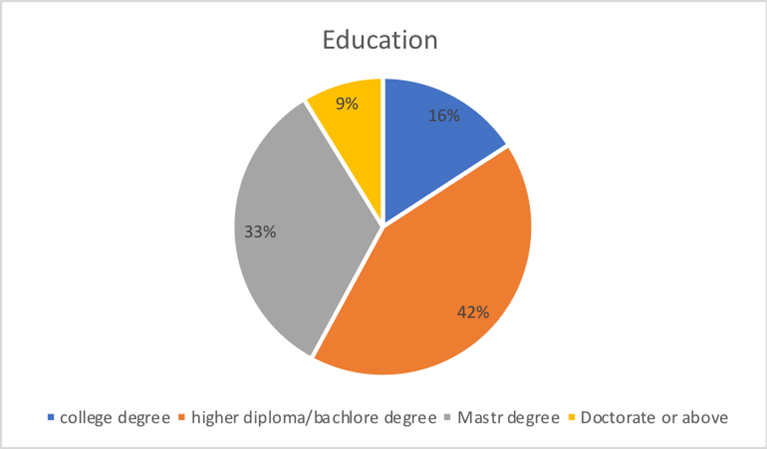
According to the pie chart highlighted above, most of the respondents sampled had a bachelor’s degree and above. The absence of employees who had a lower education level than that means that all the participants sampled were well educated. The pie chart above also shows that at least one-third of the employees sampled had a master’s education. This finding adds to the narrative that all the employees were highly educated. The existence of an 8.8% sample population of respondents who had a doctorate degree also means that some of the respondents had “very high” education levels. Collectively, these percentages imply that their responses were reliable because they were given from an educated point of view. The presence of 8.8% of the employees with “very high” education levels in the study also means that the investigation included different perspectives of workers who had the highest level of academic degree and possibly of the relationship between risk governance and project objectives. Therefore, these variations in education levels provide a balanced understanding of the respondents’ views.
Age
The research participants were also stratified according to age differences. There were five key categories of this variable. They comprised of employees who were 24 years (or lower), 25-30 years, 31-40 years, 41-50 years, and older than 51 years. A majority of the respondents were aged between 31 and 40 years. They comprised 51.8% of the total sample. The second biggest age group was comprised of employees aged between 41 and 50 years. They accounted for 25.4% of the total sample. The third largest age group of employees was comprised of those aged between 25 and 30 years. They were 15.8% of the total sample. Employees who were aged 51 years (or more) were 6.1% of the sample population, while the smallest group of employees was comprised of workers younger than 24 years. They constituted 0.9% of the total sample. A summary of the employee segmentation by age appears in figure 4 below.
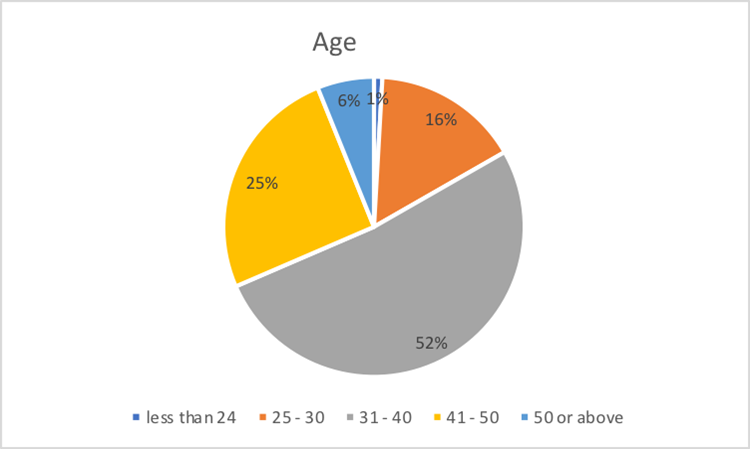
The variations in age highlighted in the pie chart above indicate the inclusion of different generational differences in the findings gathered from the study. Based on the percentages mentioned above, it is plausible to assume that most of the respondents were middle-aged. By relying on the common understanding that young people are aged between 15-35 years, the findings above show that the respondents provided a balanced representation of the views of both the younger and older employees. This analysis makes it easy to extrapolate the findings of the study across different generational cohorts. Furthermore, it means that the views presented by the respondents provided different perspectives of employees in the workplace because older and younger workers often exude varying perspectives of risk management and governance issues. The multigenerational inclusion of respondents’ views also draws attention to the minimization of conflict between different sets of employees in the workplace, which may hinder their understanding of the research questions or their representation of the research issues. The inclusion of a balanced view of responses from both the young and the old also signify the need to merge the effects of different communication styles on the study. Since both sets of employees communicate differently, the inclusion of the younger and older employees in the survey means that communication bias may have been minimized when asking the respondents to give their views about the influence of risk governance on project objectives. Lastly, the presence of a low percentage of participants (0.9%) who were younger than 24 years in the investigation means that the contribution of views from “inexperienced employees” was minimal.
Gender
There were more males than females who participated in the study. Comprehensively, the total male population sampled was 65.8%, while the total sample of female participants in the study was 34.2%. The differences appear in figure 5 below.
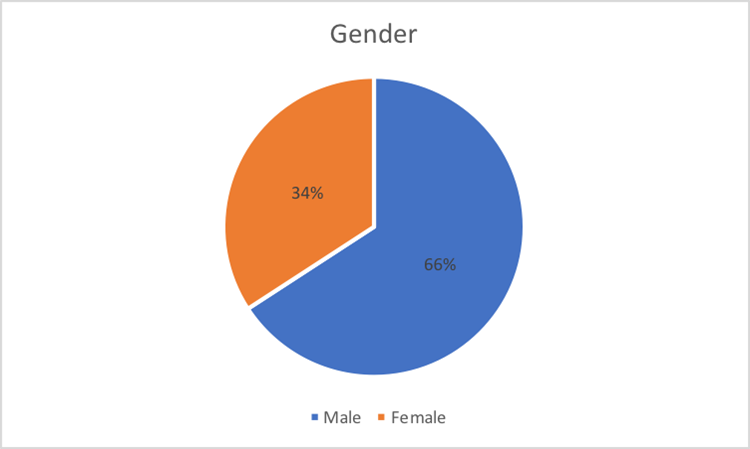
The aforementioned gender differences regarding how employees were sampled represent different views that male and female employees have about risk governance. The high number of male respondents in the study was not deliberate, but a fair representation of the gender differences in the workplace and their willingness to participate in the study. Nonetheless, someone could argue that the findings are gender biased because the percentage of male respondents was almost double that of female participants. However, this outcome was involuntarily achieved because there was no gender bias associated with the process of recruiting the research participants. Therefore, the differences represent the true picture of the workplace and, by extension, people’s views regarding the influence of risk governance on project objectives.
Nationality
Nationality was the last demographic variable used to analyze the research sample. Two categories were used to segment the sample population: UAE nationals and non-UAE nationals. Those who met the first criterion were 55.3% of the total sample, while those who met the second category of employees were 44.7% of the respondents surveyed. Figure 6 below shows the distribution.
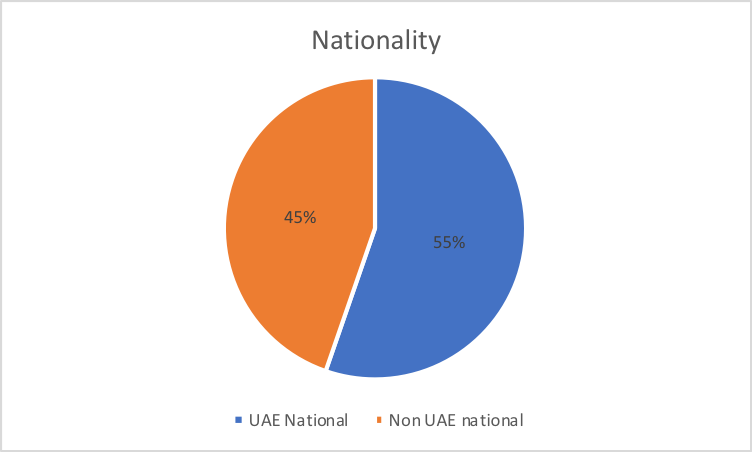
The pie chart above shows that the difference between UAE nationals who participated in the study and those who did not share the same nationality was 10 points. This statistic means that most of the workers who participated in the study were UAE nationals. Its implication is that the views provided by the respondents were mostly contextual to the experiences of the UAE nationals. However, to the extent that 45% of the respondents were non-UAE, it could be assumed that there was a balanced representation of non-UAE views in the study as well. The implication of this analysis is that the findings derived from the research could not only be limited to the UAE context. It also means that it is easy to extrapolate the findings to the non-UAE context.